timestored / pulseui Goto Github PK
View Code? Open in Web Editor NEWReal-time interactive database applications
Home Page: https://www.timestored.com/pulse/
License: Other
Real-time interactive database applications
Home Page: https://www.timestored.com/pulse/
License: Other


user-ra user-rd?
Both tried to zoom in by left clicking similar to qStudio but it had no effect.
It should support that standard zoom?
USer: IL had really large server tree, impossible to navigate.
Need way to filter or search.
So far all actions go:
Forms -> Charts/Tables
Some users would like to click charts/tables and for those interactions to drive actions.
In particular they would like to:
User reported issue from: JC
Color pallette capped to 9 colors?
Once i draw lots of of bars, they begin to repeat. (example below)
Any way to modify the color palette used in assigning colors to multiple lines/bar charts?

When in FormEditor with multiple Labels, on clicking a different Label, the CompenentEditor does not display the coresponding DataSource SQL query unless you press List and then SQL.
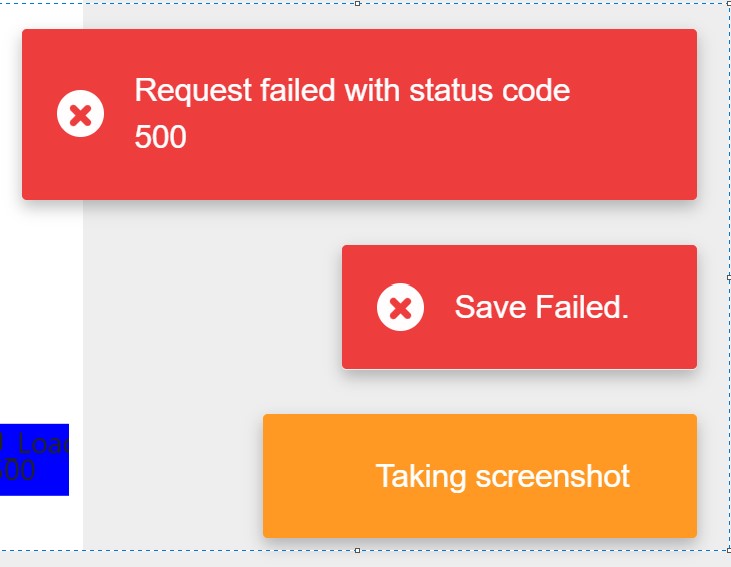
I had created 5 dashboards in total with v0.11.4. On installing v0.11.5 only 2 of them can be modified leaving 3 un-modifiable. On attempting to save, the following is reported
Request Failed with status code 500
Save Failed
Taking Screenshot.
When I tried downgrading to v0.11.4, all dashboards where modifiable again. On then returning back to v0.11.5 the same 3 dashboards where once again un-modifiable.
Users would like to highlight cells:
,<,= number
Some of these are achieveable currently with either formatters (databar) OR per table row formatting. But these generic cases should be easily performable from the UI.
User Reported user-pn,user-sg.
The individual parameter sending works but I would like the ability to send more parameters.
In kdb it would be particular useful to have many sent as a dictionary.
This would be useful in combinariont with:
Right-Click table to generate action
#30
User Request user-pn:
option to overlay a number inside _SD_SIZE components.
Would also be good to have same size components but have numbers inidcating order size etc.
User Reported:
We have tested pulse with some of our old sql dashboard charts and note that the horizontal landscape is much more limited we cant see a whole day of candles
can we zoom in / out to achivee this?
also the hover over function that only works for some of the data in the candlestick chart and
most importantly it is difficult to access the sql editor which stores the sql that serves as the source to the graph - this should be a button on the webpage somewhere.
Users want dual-axis charts.
This issue is to capture some requirements and to put forth a proposal for feedback.
Proposal:
Allow toggling series between left and right.
NOT supported: Multiple axis on same side
Complexity will be allowing axis customization of multiple axis.

Do users want multiple axis on same side?
USer Reported:
We have tested pulse with some of our old sql dashboard charts and note that the horizontal landscape is much more limited we cant see a whole day of candles
can we zoom in / out to achivee this?
also the hover over function that only works for some of the data in the candlestick chart and
most importantly it is difficult to access the sql editor which stores the sql that serves as the source to the graph - this should be a button on the webpage somewhere.
User request P: ability to zoom into and out of graphs
([] t:.z.d+til 3; a:100+1 2 3)
2+2
3+3;
To recreate.
Run line 1, then line 2, then line 3.
Notice whole console dissapears after running line 3.
user-pn,user-sg
ability to trigger an action by clicking on a row -
eg more details pop up or it takes you to another page with appropropriate args
The background color of the overall chart cannot be reset.
Once i set a color, it doesn't seem to reset to default.

Notice I clicked reset multiple times and ahrd refreshed.
User reported via email:

user-pn
Would really appreciate having at least the same refresh's that were present on sqlDashboard, specificly the 10s and 1min. I like the new longer refreshes too. Even better would be customisable if poss.
Users want to per column in data grid / table:
User Reported user-pn.
It would be good to be able to save filters per user.
User Reported JC:
Another one (probably easy fix?). At the moment long words or axis labels seem to get cutoff. For example rotated axis label gets cutoff on the left most value, and even horizontal labels on a bar_horizontal chart gets cutoff on the left hand side. I think this could be fixed with automatic padding/text wrap. Or maybe option to truncate… (I know this I can do in the data but ideally I would like to only change the data as last resort for GUI reasons)
SELECT 'abcdefghijklmnopqrstuvwxyzabcdefghijklmnopqrstuvwxyzabcdefghijklmnopqrstuvwxyz',bid AS abcdefghijklmnopqrst,ask,
 buy as asasdadsd,4+BUY_QUANTITY/50.0 AS BUY_SD_SIZE,
 sell as sell_SD_TRIANGLE,4+SELL_QUANTITY/50.0 AS SELL_SD_SIZE,
 hedger_buy as hedger_buy_SD_CIRCLE,4+hedger_BUY_QUANTITY/50.0 AS hedger_BUY_SD_SIZE,
 hedger_sell as hedger_sell_SD_CIRCLE,4+hedger_SELL_QUANTITY/50.0 AS hedger_SELL_SD_SIZE
FROM taq
ORDER BY TIME ASC LIMIT 10;


user reported via email:
Can I set longer refresh intervals?
E.g. 30min/1hr/2hr (for less high frequency data so I’m not pinging server unnecessarily)
User Reported user-pn,user-sg.
I would like a way to click on a row on a table and to generate an action or actions for that row.
e.g. To right click on a row representing a trade, to amend a trade detail.
e.g. To right click on an algo parameter to update or modify that parameter.
Right click on existing UI is preferred to button or new UI as space is a premium.
User reported from: JC
There seems to be some issue with having “_” in the column names of the grid table.
“Prefix_name” column name only shows the “name” part

User Reported user-pn.
It's very difficult to hover and see all numbers on the time-series chart.
IF item is on it seems to hover more easily but does NOT show all numbers.
If axis is on, it's harder to hover but does show all item values.
User Request Emailed:
We use a custom apache proxy that authenticates all users.
Would it be possible to get a custom handler in Pulse that can take an HTTP request of custom format and allow us to specify who that user is and what permissions they have.
user-ra went to pick a color and was confused when it had no effect.
The color picker on windows / firefox requires:
Still black even though I chose a color!!

We've had requests to:
So far we only enable:
We need:
"Make the easy things easy, and the hard things possible." - Larry Wall
User-IL
populating connections every hour or so from some external api would be nice)
Then only showing certain connections to certain groups would be best.
(edit) Moved server tree to separate issue #74
User Request:
Pulse uses a shared connection with one username/password being used to forward all queries.
We would like to track which requests came from which users on the targeted database side (kdb).
Could you provide a method of wrapping all queries sent to certain server?
To allow passing the username of the currently logged in user?
User Reported user-pn.
I would like a line where a position occurred to represent that it's still open and waiting to execute.
I would also like to be able to control the line width programttically.
e.g. a thicker line to represent a bigger position.
When using the Half Moon setting at top right, left of admin. All Panel names are very difficult to read (grey writing on light blue). Is there a method to change this.
User-ra reports:
When one series is a bar chart, it displays line/area color selectors but these have no effect.
Only item changes the color.
Options that have no effect in the current configuraiton should not be shown otherwise they just confuse and frustrate people.

putting actual numbers into a pie chart.
Time-series does NOT start at zero.
Line chart always starts at zero.
Should these be consistent?

User Reported user-pn.
I find the pulse database opaque. To have reassurance of what is stored and to allow diffs between versions I would like to see textual files representing the data. This would allow me to see in source control what is changing.
user-il user-vol
Do you have any hardware recommendations / min required specs?
We’ll run this on its own server but don’t want to run into memory issues etc.
user-ra
process ran out of memory and wrote error to logs.
User Reported user-pn.
User is currently copying the pulsedb.mv file as a backup.
THis has a few issues:
Proposal:
Allow backup to plainer SQL file from within the UI while running.
User Reported user-pn.
Quants would like the ability to align content left/right/center in the grid column.
user-ra
I want to copy table cells by pressing ctrl+c
Dev Noticed Issue:
Not all columns are renamable.
SD_xxx columns are not shown
Need to clearly think of interaction between named columns and user GUI settings.
e.g. DATABAR and PERCENT are not currently supported via UI.
We should have consistent interaction between both.
Sparklines would be useful for many use-cases. e.g.

user-ra for quants.
When plotting 2 series, some users find it most useful to shade the are between lines:

User Request NM:
Pulse uses a shared connection for user queries.
i.e. Every dashboard user - uses a database connection with the same login details.
THis user wants to be able to log which specific user sent the query and possibly forward the query to a specific server.
user-pn requested ability to link from one dashboard to another.
In particular to link from a row with a value e.g. Google to a different dashboard with the parameter set.
user-rd user-ra
I#ve been working on a dashboard and left the page by mistake losing my work.
It's very frustrating.
Ideally:
User Request user-pn
remove scroll below tables "showing page 1 of 1".
it takes up a lot of space when we have multiple tables in play. this is a major annoyance!
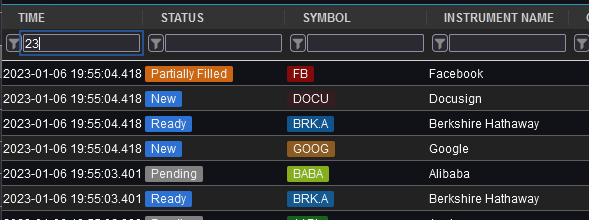
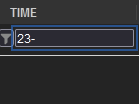
user-ra reported.
Filtering time column for 23- which should match all "2023-" years returns no results.
Searching for $ in a currency column also doesn't work (less unexpected)
user-ra was setting column name in the override box and it made everything very slow.
Also feels slow on my machine.
A declarative, efficient, and flexible JavaScript library for building user interfaces.
🖖 Vue.js is a progressive, incrementally-adoptable JavaScript framework for building UI on the web.
TypeScript is a superset of JavaScript that compiles to clean JavaScript output.
An Open Source Machine Learning Framework for Everyone
The Web framework for perfectionists with deadlines.
A PHP framework for web artisans
Bring data to life with SVG, Canvas and HTML. 📊📈🎉
JavaScript (JS) is a lightweight interpreted programming language with first-class functions.
Some thing interesting about web. New door for the world.
A server is a program made to process requests and deliver data to clients.
Machine learning is a way of modeling and interpreting data that allows a piece of software to respond intelligently.
Some thing interesting about visualization, use data art
Some thing interesting about game, make everyone happy.
We are working to build community through open source technology. NB: members must have two-factor auth.
Open source projects and samples from Microsoft.
Google ❤️ Open Source for everyone.
Alibaba Open Source for everyone
Data-Driven Documents codes.
China tencent open source team.