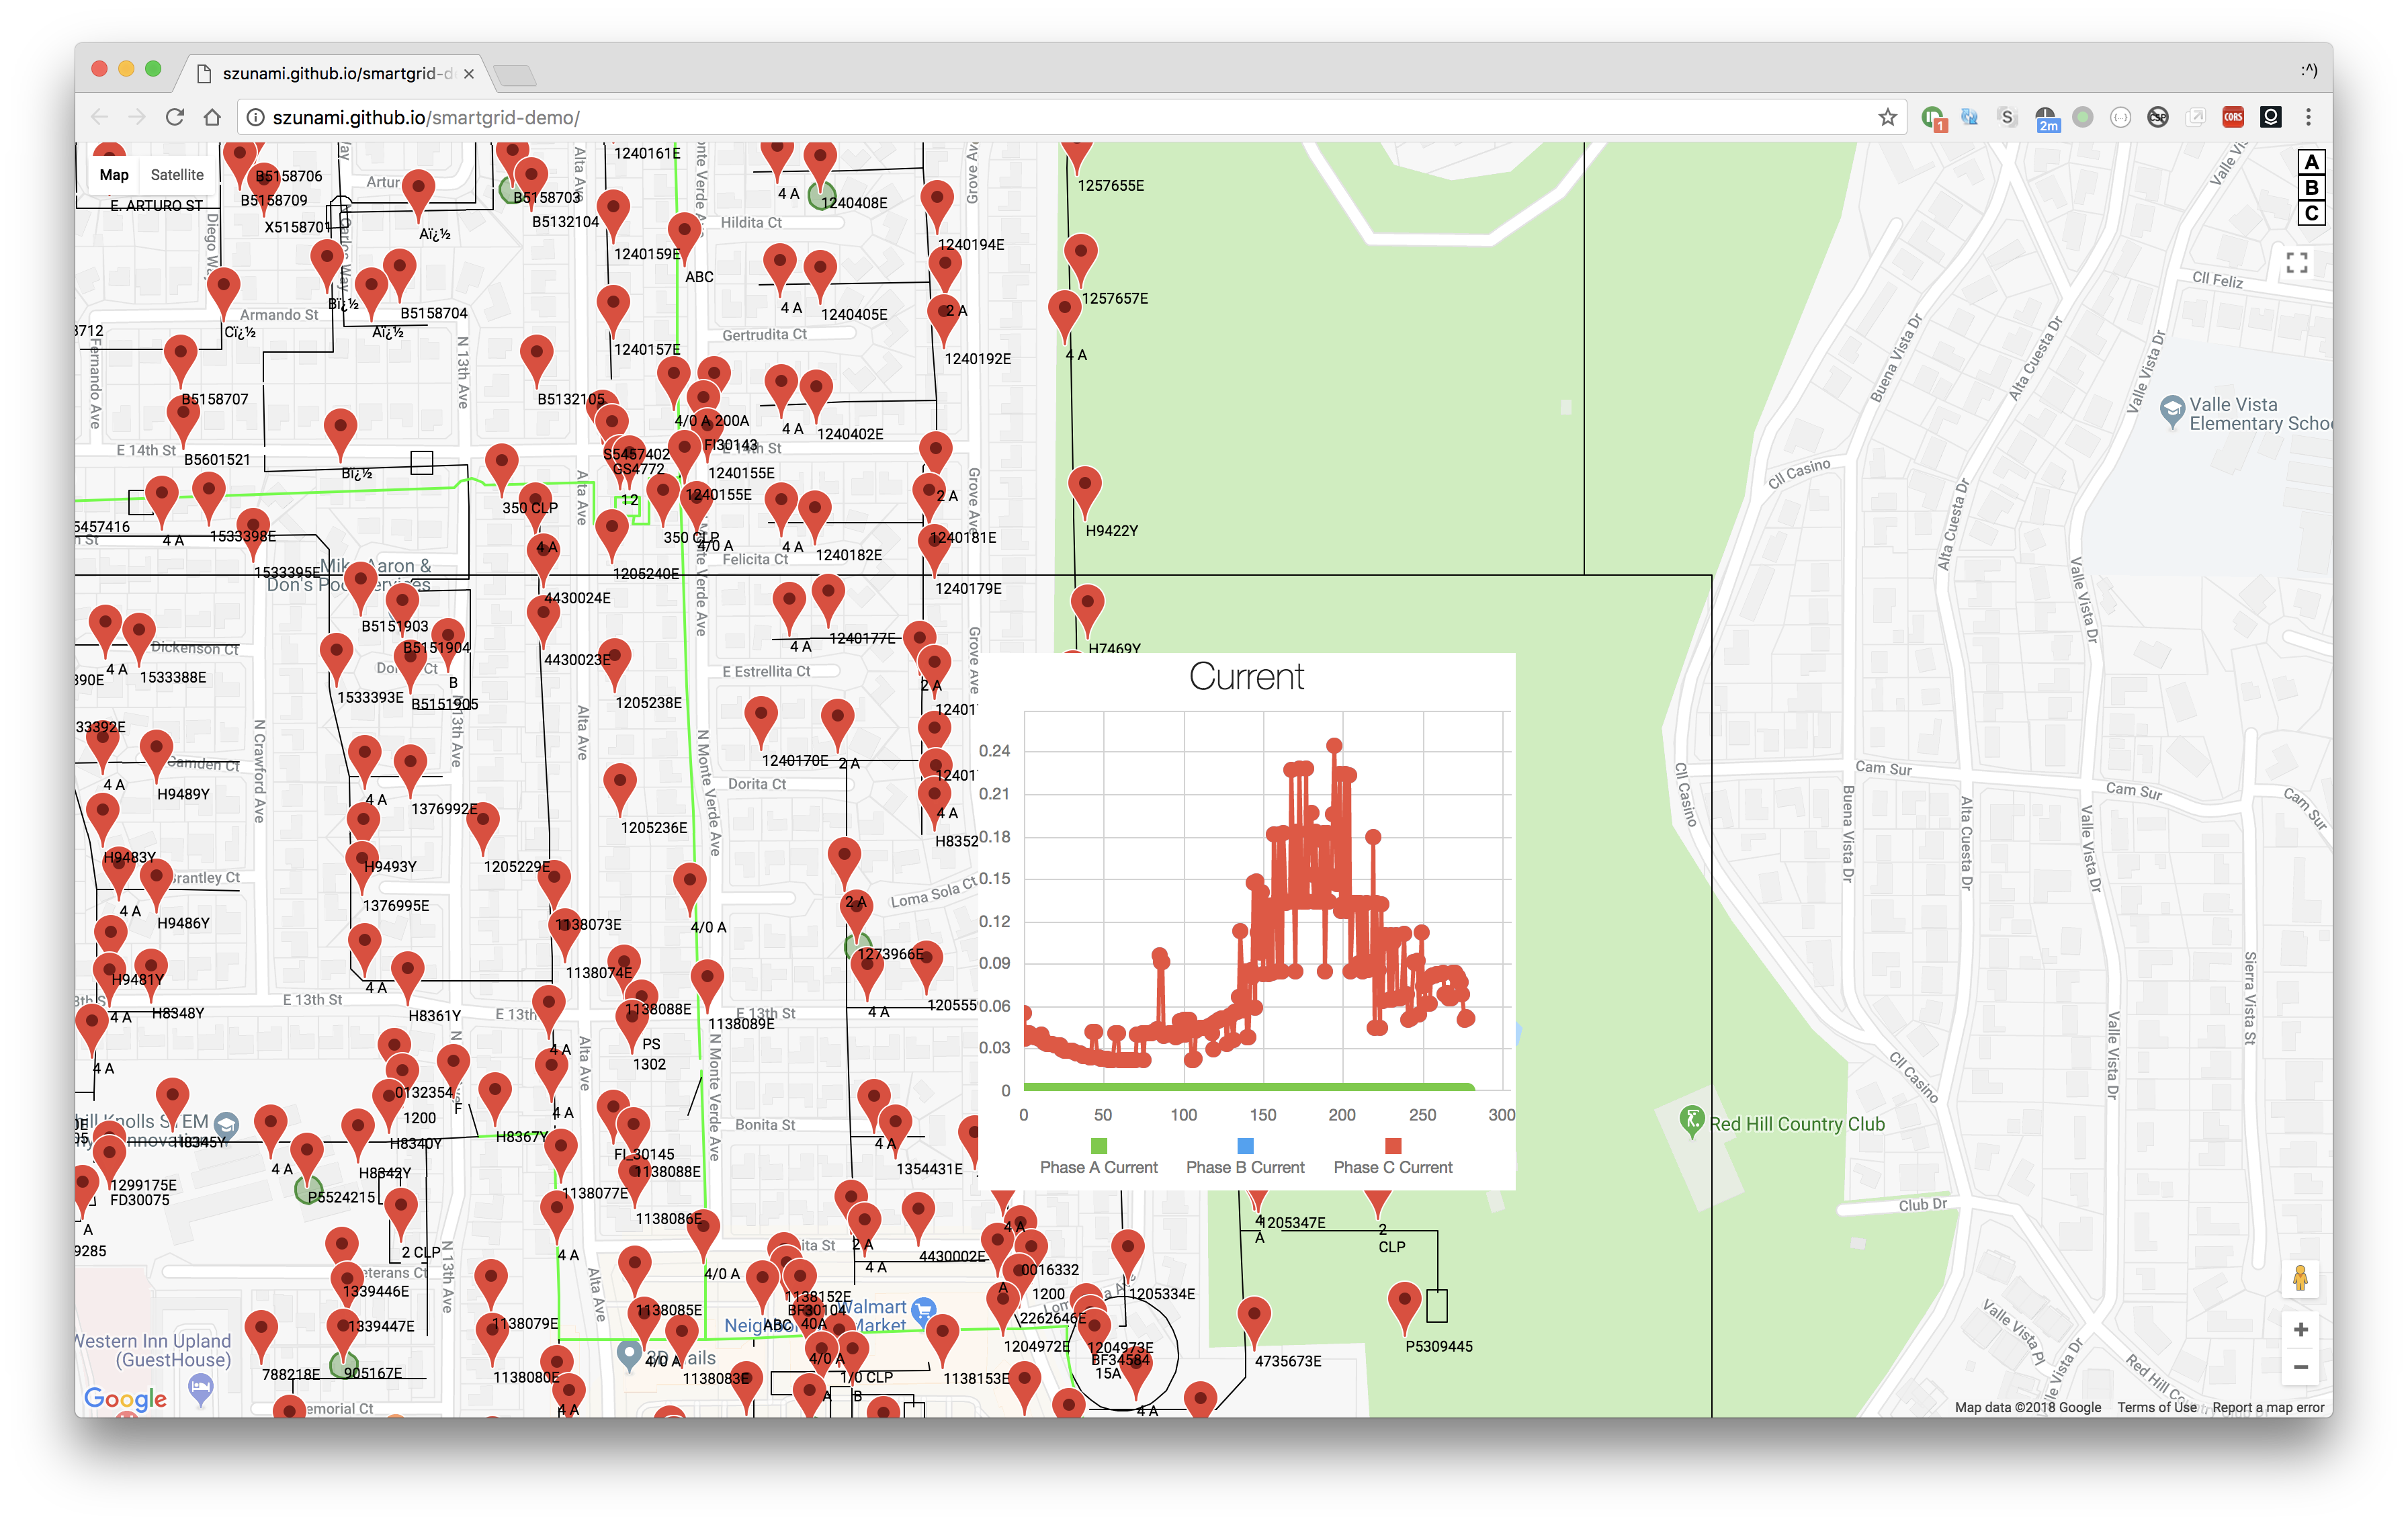
A time-series visualization of power consumption in the Rossi Circuit. To begin the demo, select a voltage phase in the upper right hand corner. Behavior of individual network edges can be observed by clicking on the edge while the demo is active. Presented at a final class presentation at Caltech.
Live demo available: http://szunami.github.io/smartgrid-demo/