This repository contains awesome demos of Syncfusion Flutter UI widgets. This is the best place to check our widgets to get more insight into the usage of APIs. You can also check our widgets by installing the complete Flutter sample browser from Google Play Store or App Store, in which you can browse the demo for all the widgets and view the source code of each sample within the app itself.

- Requirements to run the demo
- Repository Structure
- Widgets Catalog
- License
- Using the examples
- Support and Feedback
- IDE tools are Visual Studio code and Android studio.
- Flutter SDK
Channel Version Stable 2.0.2 Beta 2.0.2 - Dart and Flutter add-ons for Visual Studio Code (available via the Visual studio code extension) in Android Studio it available in plugin preference.
The lib/samples directory contains the Flutter widget examples for each widget such as Charts, DataGrid, etc. All the examples can be deployed in Android, iOS, and web platforms.
| Widgets | Repository |
|---|---|
| Barcode Generator | Link |
| Calendar | Link |
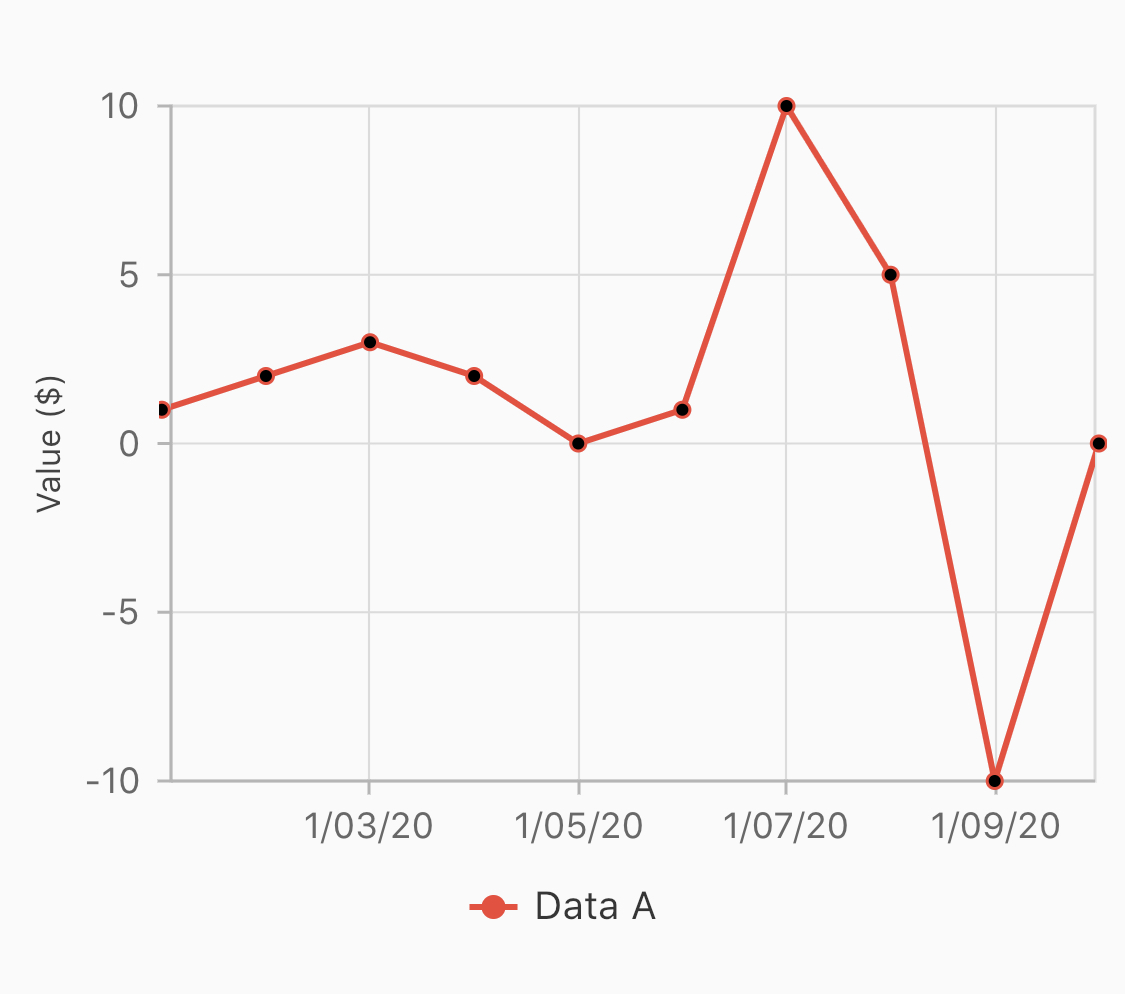
| Charts | Link |
| DataGrid | Link |
| Date Range Picker | Link |
| Linear Gauge | Link |
| Maps | Link |
| Link | |
| PDF Viewer | Link |
| Progress Bar | Link |
| Radial Gauge | Link |
| Range Selector | Link |
| Range Slider | Link |
| Slider | Link |
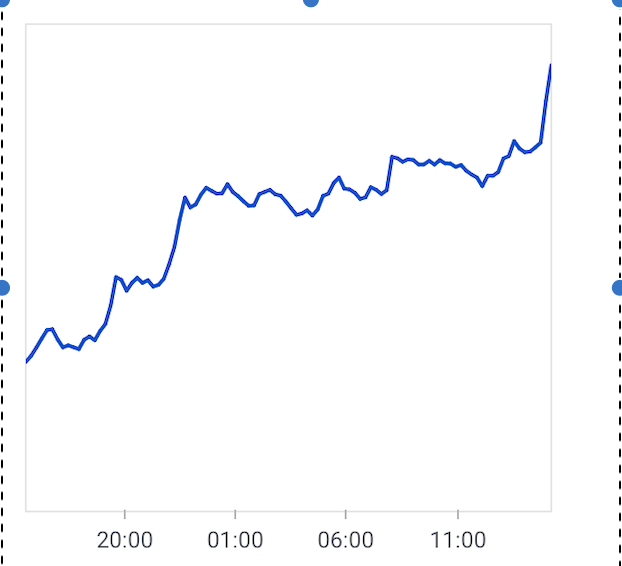
| Spark Charts | Link |
| Signature Pad | Link |
| Treemap | Link |
| XlsIO | Link |
Syncfusion has no liability for any damage or consequence that may arise by the use or viewing of the examples. The examples are for demonstrative purposes and if you choose to use or access the examples you agree to not hold Syncfusion liable, in any form, for any damage that is related to use, accessing or otherwise viewing the examples. By accessing, viewing, or otherwise seeing the examples you acknowledge and agree Syncfusion’s examples will not allow you to seek injunctive relief in any form for any claim related to the sample. If you do not agree to this, do not view, access, utilize or otherwise do anything with Syncfusion’s examples.
Step 1
Unzip the downloaded flutter example archive.
Note: If you clone this repository ignore this step.
Step 2
Open the flutter example folder in an IDE.
Step 3
Run the following command to get the required packages.
$ flutter pub getStep 4
Run your application either using F5 or Run > Start Debugging.
Explore the full capabilities of our Flutter widgets on your device by installing our sample browser applications from the below app stores, and view samples code in GitHub.


Take a look at the following to learn more about Syncfusion Flutter widgets:
- Syncfusion Flutter product page
- User guide documentation
- API reference
- Knowledge base
- Video tutorials
- For any other queries, reach our Syncfusion support team or post the queries through the Community forums and submit a feature request or a bug through our Feedback portal.
- To renew the subscription, click renew or contact our sales team at [email protected] | Toll Free: 1-888-9 DOTNET.
Founded in 2001 and headquartered in Research Triangle Park, N.C., Syncfusion has more than 20,000 customers and more than 1 million users, including large financial institutions, Fortune 500 companies, and global IT consultancies.
Today we provide 1,000+ controls and frameworks for web (ASP.NET Core, ASP.NET MVC, ASP.NET WebForms, JavaScript, Angular, React, Vue, and Blazor, mobile (Xamarin, Flutter, UWP, and JavaScript), and desktop development (WinForms, WPF, and UWP and WinUI). We provide ready-to deploy enterprise software for dashboards, reports, data integration, and big data processing. Many customers have saved millions in licensing fees by deploying our software.