Coder Social home page Coder Social logo

repository.surf's Introduction

Supabase

Supabase is an open source Firebase alternative. We're building the features of Firebase using enterprise-grade open source tools.

  • Hosted Postgres Database. Docs
  • Authentication and Authorization. Docs
  • Auto-generated APIs.
  • Functions.
    • Database Functions. Docs
    • Edge Functions Docs
  • File Storage. Docs
  • AI + Vector/Embeddings Toolkit. Docs
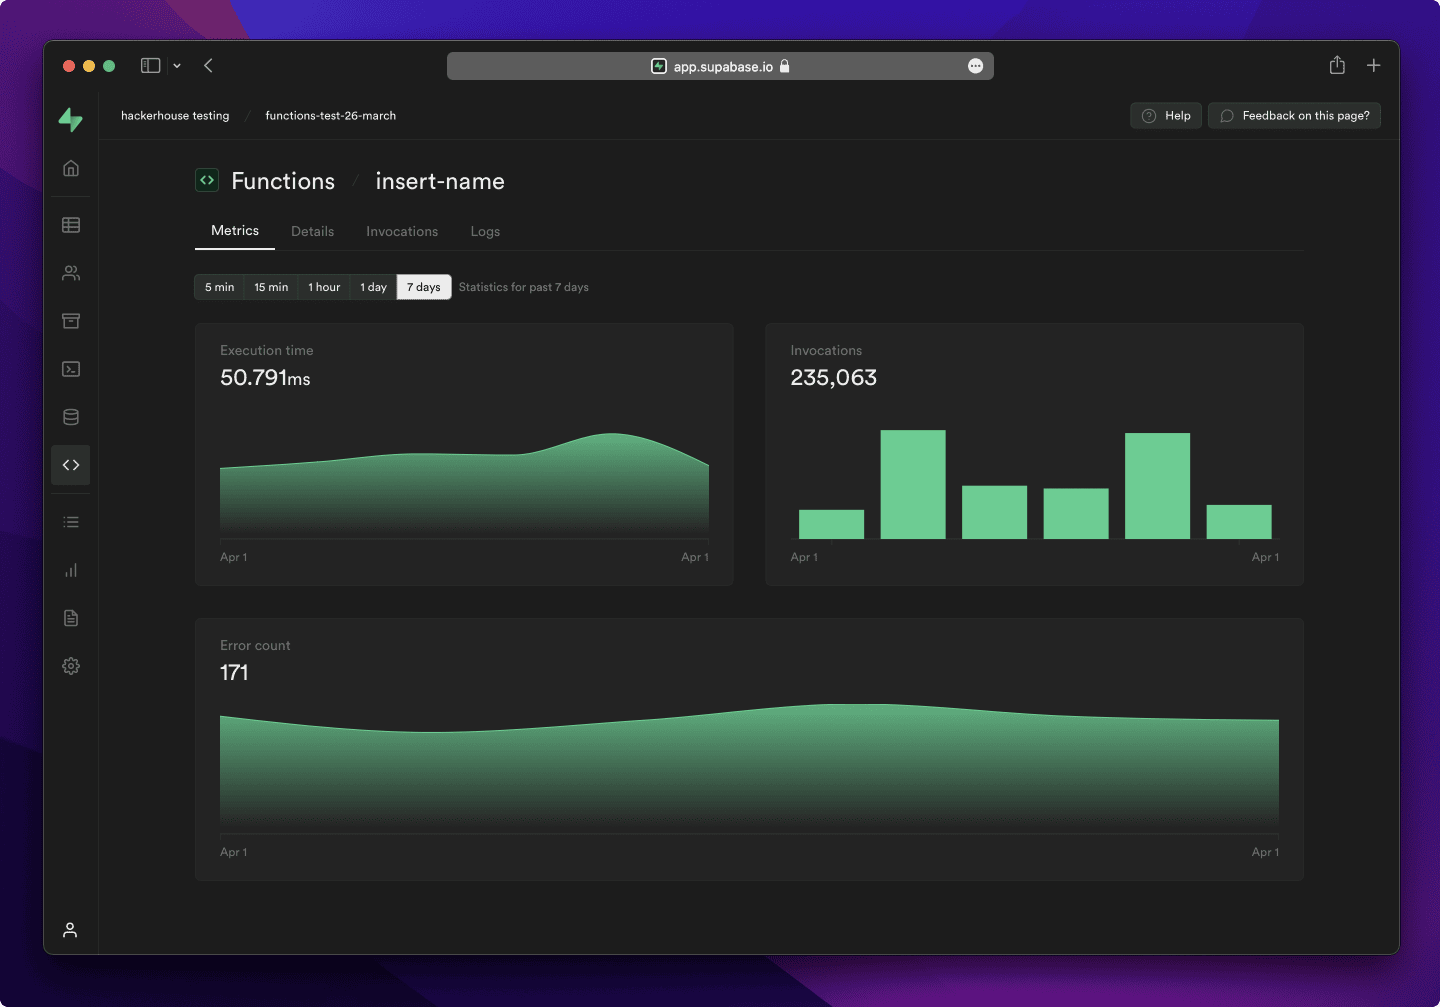
  • Dashboard

Supabase Dashboard

Watch "releases" of this repo to get notified of major updates.

Watch this repo

Documentation

For full documentation, visit supabase.com/docs

To see how to Contribute, visit Getting Started

Community & Support

  • Community Forum. Best for: help with building, discussion about database best practices.
  • GitHub Issues. Best for: bugs and errors you encounter using Supabase.
  • Email Support. Best for: problems with your database or infrastructure.
  • Discord. Best for: sharing your applications and hanging out with the community.

How it works

Supabase is a combination of open source tools. We’re building the features of Firebase using enterprise-grade, open source products. If the tools and communities exist, with an MIT, Apache 2, or equivalent open license, we will use and support that tool. If the tool doesn't exist, we build and open source it ourselves. Supabase is not a 1-to-1 mapping of Firebase. Our aim is to give developers a Firebase-like developer experience using open source tools.

Architecture

Supabase is a hosted platform. You can sign up and start using Supabase without installing anything. You can also self-host and develop locally.

Architecture

  • Postgres is an object-relational database system with over 30 years of active development that has earned it a strong reputation for reliability, feature robustness, and performance.
  • Realtime is an Elixir server that allows you to listen to PostgreSQL inserts, updates, and deletes using websockets. Realtime polls Postgres' built-in replication functionality for database changes, converts changes to JSON, then broadcasts the JSON over websockets to authorized clients.
  • PostgREST is a web server that turns your PostgreSQL database directly into a RESTful API
  • GoTrue is a JWT based API for managing users and issuing JWT tokens.
  • Storage provides a RESTful interface for managing Files stored in S3, using Postgres to manage permissions.
  • pg_graphql a PostgreSQL extension that exposes a GraphQL API
  • postgres-meta is a RESTful API for managing your Postgres, allowing you to fetch tables, add roles, and run queries, etc.
  • Kong is a cloud-native API gateway.

Client libraries

Our approach for client libraries is modular. Each sub-library is a standalone implementation for a single external system. This is one of the ways we support existing tools.

Language Client Feature-Clients (bundled in Supabase client)
Supabase PostgREST GoTrue Realtime Storage Functions
⚡️ Official ⚡️
JavaScript (TypeScript) supabase-js postgrest-js gotrue-js realtime-js storage-js functions-js
Flutter supabase-flutter postgrest-dart gotrue-dart realtime-dart storage-dart functions-dart
💚 Community 💚
C# supabase-csharp postgrest-csharp gotrue-csharp realtime-csharp storage-csharp functions-csharp
Go - postgrest-go gotrue-go - storage-go functions-go
Java - - gotrue-java - storage-java -
Kotlin supabase-kt postgrest-kt gotrue-kt realtime-kt storage-kt functions-kt
Python supabase-py postgrest-py gotrue-py realtime-py storage-py functions-py
Ruby supabase-rb postgrest-rb - - - -
Rust - postgrest-rs - - - -
Swift supabase-swift postgrest-swift gotrue-swift realtime-swift storage-swift functions-swift
Godot Engine (GDScript) supabase-gdscript postgrest-gdscript gotrue-gdscript realtime-gdscript storage-gdscript functions-gdscript

Badges

Made with Supabase

[![Made with Supabase](https://supabase.com/badge-made-with-supabase.svg)](https://supabase.com)
<a href="https://supabase.com">
  <img
    width="168"
    height="30"
    src="https://supabase.com/badge-made-with-supabase.svg"
    alt="Made with Supabase"
  />
</a>

Made with Supabase (dark)

[![Made with Supabase](https://supabase.com/badge-made-with-supabase-dark.svg)](https://supabase.com)
<a href="https://supabase.com">
  <img
    width="168"
    height="30"
    src="https://supabase.com/badge-made-with-supabase-dark.svg"
    alt="Made with Supabase"
  />
</a>

Translations

repository.surf's People

Contributors

dependabot[bot] avatar isaiah-hamilton avatar joshenlim avatar kiwicopple avatar ykdojo avatar

Stargazers

 avatar  avatar  avatar  avatar  avatar  avatar  avatar  avatar  avatar  avatar  avatar  avatar  avatar  avatar  avatar  avatar  avatar  avatar  avatar  avatar  avatar  avatar  avatar  avatar  avatar  avatar  avatar  avatar  avatar  avatar  avatar  avatar  avatar  avatar  avatar  avatar  avatar  avatar  avatar  avatar  avatar  avatar  avatar  avatar  avatar  avatar  avatar  avatar  avatar  avatar  avatar  avatar  avatar  avatar  avatar  avatar  avatar  avatar  avatar  avatar  avatar  avatar  avatar  avatar  avatar  avatar  avatar  avatar  avatar  avatar  avatar  avatar  avatar  avatar  avatar  avatar  avatar  avatar  avatar  avatar

Watchers

 avatar  avatar  avatar  avatar  avatar  avatar  avatar  avatar  avatar  avatar  avatar  avatar  avatar  avatar  avatar  avatar  avatar  avatar  avatar  avatar  avatar  avatar

repository.surf's Issues

Allow users to navigate to other organizations without having to go back to the landing page

Feature request

At the moment, on the organization page, to view another organization's page, users have to go back to the landing page (either by the provided back button in the UI, or browser back button) to key in another organization

Allow users to do this action without having to traverse back to the landing page

And idea is to leverage on tailwindui's nav bar?

Refactor chart embed

Chore

At the moment chart embed piggy backs on the repository page (shows chart per repo) which is going to be deprecated.

Two things here:

  • Org page to show the share icon
  • Embed modal to show cumulative chart data for selected repos
  • Need to think of another way to handle the embed URL, as mentioned in slack perhaps query array string?

Organization star history loading state

I'm wondering if its possible to have a loading indicator on the organization's star history similar to how we do it for the individual repositories? I'd say just a loader will be fine we dont have to show the chart updating live as results are pulled in

Also while the organization's star history is loading, if we go to a repository page and the repository's star history is still loading, then go back to the organization overview page, the star history on the organization page will show a chart (that's incomplete cause not all the data is pulled in yet) and with a Loading 100% message

Growth statistics for "past day" showing 0

When I go to http://<url>/supabase and select all repos, the growth statistics for "Past day" shows 0 even though I don't think it should be 0.

I feel like we could simply remove the whole section now that we have "daily new counts"? Or, alternatively, I feel like we should show "Past week" and "Past 30 days", and then compare them to the previous 1 week period and 1 month period, respectively.

Make it easier to see which repos are selected, and make it sharable

When the user selects repos, the UI doesn't make it too clear which repos have been selected:

image

I think it should show it like, "selected repos: supabase, supabase-js, realtime, repository.surf and 11 more"

Also, it seems like there's no sharable/bookmarkable link that contains info about which repos have been selected. I think it would also be nice to have?

Implement search for repositories in the side bar

Feature request

At the moment due to the github's api's pagination per_page limitation of max 100, we only show 100 repositories in the side panel - most organizations have more than 100.

However it isn't optimal as well to paginate through the api and throw all the repositories in the side panel as some organizations like Google has 1.9k repos. I feel the best way is to implement a search field and only display max 100 results in the side bar.

  • Will need to think in terms of UX where is best to have the search field
  • Search should have debouncing
  • If possible, we need to fix the message on the organization page as well "Timeline of issues across xxx repos", atm max will be 100 which may be inaccurate

We may need to start being careful about our API rate limits too

Remove the "Today" option when showing a star history

Clicking the "today" option when looking at a star history tries to show a single data point, which is not useful.

So instead of having the "today" option, I think we should have something like "Past 30 days".

UX for API rate limit exceeded

Bug report

Describe the bug

I busted through Github's API rate limits while testing the organizations' star history feature, will be good to show a toast for such an error and the corresponding UI state across the pages.

Resolving #33 should mitigate the issue of busting rate limits too

Make the repo sorting option more pemanent

Continuing from #3.

When I sort the repos by star count, click one of the repos and refresh the browser, it goes back to them being sorted alphabetically.

Also, I think they should be sorted by star count by default.

Case sensitivity

Bug report

Describe the bug

To Reproduce

  1. Type Supabase into the into screen (with capital letters)
  2. The repos will appear fine
  3. The issues graph will not appear

Show a chart of daily increases in star counts

It would be nice to have a "show daily increase" option. So the options will be "cumulative stars" vs "daily increase".
When you click cumulative stars, you see what you see now. When you click daily increase, you'll see a time-series chart of daily increases. Either way, you'll be able to filter it by time (all time, past month, past week)

Discrepancy between total star count and latest point in star history chart

Bug report

This one's tricky - it might be that edge case issue that was mentioned. I noticed that the total star count of a repo does not match the latest node in the star history chart as such:

image

Total star count on the header is 4731 but the latest node in the chart is 4736, checking the github repo directly shows that supabase repo has 4731 stars

Another example under vercel:

image

Total star count on header is 59687 but latest node in the chart is 59721

One thing's consistent is that our chart is showing slightly higher numbers than the actual

Duplicate organization and repository rows under star history table

Bug report

Been noticing a couple of rows with repeated organization and repository name pairs (not too sure if its from testing, but the data in this table is not that important since its a cache so not to worry). I did verify that the updating of the cache is working without inserting new rows though. Two possible solutions:

  • Do a check if a row with the organization and repo exists before inserting

  • Change PK of the table to be organization and repository to enforce this from the DB

Personally feel that option 2 is more optimal - i guess this is one of the instances which the table editor should support creation of more than 1 PK for a table as well haha

For now, we can do it via the second method by good ol' SQL query

Do issue tracking on-demand (just like we do with stars)

@joshenlim's note:

I realised pulling issue tracking on demand (skipping lambda) might be possible:

{
  repository(owner: "supabase", name: "supabase") {
    issues(first: 100) {
      totalCount
      edges {
        node {
          createdAt
          closedAt
        }
      }
    }
  }
}

But not exactly sure if possible or how complicated it might be

Stars chart for embed no longer working

Bug report

Charts can be embedded via the following url for example:

repository.surf/supabase/supabase/embed?chart=stars

Think the stars chart is broken due to the changes we've done for star retrieval. Will need to bring the changes over from index.js to embed.js.

Clean up the "up to 100" from the graph UI

Current UI:

image

"up to 100" is a bit awkward there.

Maybe we can add something in the repo filtering view instead. If there are 100 repos shown there, we can say something like, "Only up to 100 repos are available in the free tier." We could have an info icon with that message in a tooltip.

When not all repos are loaded, none of the repos are available

Example: Go to Microsoft's page. When TypeScript's repo is not completely loaded, when you select one of the other repos, it says "Preparing star history... 1 out 1 repos loaded" but it doesn't show the graph.

Also, when a single repo is selected, it should start showing the partial graph even when the data is not completely loaded yet.

Tracking of issues by label

Feature request

Describe the solution you'd like

I think a good feature (and also an idea brought up by Bobbie + Inian) will be to provide a chart that tracks open/closed issues filtered down to tags (e.g project-zero or high-priority) under the issue tracking section.

This may add value to project managers that are tracking burndowns for specific issues, something like what Clubhouse or JIRA (i think?) does (e.g Burndown chart for Sprint xx)

We can also provide data such as turnover rate for labelled issues, e.g average of 2 days per high-priority issue -> good indication of response for certain issues

Additional context

Probably can follow these steps:

  • Figure out how to store issues and their labels in the DB first
    • Note that the labels of an issue may also change (e.g an issue might be given 'bug' and 'frontend' at first, but later 'frontend' is removed and 'backend' is added
    • Based on this, perhaps we need to pull this type of data on demand?
  • Render that data as a chart
  • Provide an input field somewhere on the FE for users to enter the labels they want to retrieve issues for
  • Derive a turnover rate for labelled issues (x days?)

Temporary UX solution to long retrieval times for star histories

Feature request

At the moment, it takes about 20 seconds to load the star history graph for repositories with > 10k stars if not cached, let alone more than 10k stars. The spinning loader in this context becomes a really bad UX as the user has no idea if the site died or not.

Am thinking we should have a progress bar for the star history retrieval - we can know the total number of pages that needs to be fetched by (total # number of stars / MAX_ROWS_PER_PAGE), as an when each page is successfully fetched, we update a counter and the progress bar % can just be (# pages fetched / total # of pages)

Keep in mind this should also work with our debouncing issue request (#13) as well

Tidy up stars history and issue tracker layout

Chore

  • Change the titles to just Stars and Issues
  • Add the total number of (opened/closed) issues to the right of the header (similar to stars)
  • Shift last updated to below the graph (I'd actually say lets hide it for now if its not important)
  • Shift additional actions (e.g View For) to the top right of the graph (But we will need to see where we can place the set baseline to 0 toggle too)
  • [KIV] Shift the graph description to below the graph

Deprecate Icons folder

Chore

With the supabase ui library, we can remove the Icon folder entirely - screen through the repo and update accordingly

Embeddable charts

Feature request

It would be awesome if you could embed charts into other sites (with a Powered by .. of course)

Allow GitHub org owners to "Claim" an organisation

Feature request

Is your feature request related to a problem? Please describe.

As a github org owner, I want to be able to manage what is visible, and provide my own Developer Key so that this repo can track issues for private organisations.

Describe the solution you'd like

  • Add Auth - GitHub login
  • Ability to "Claim" an org - perhaps we can know already if they are the owner of the GitHub org based on their github handle?
  • Add some settings
    • GitHub Token (should be hashed)
    • Choose whether issue tracking is turned on for repos
    • Choose whether private repos should be visible to the public (right now everyone can see our infrastructure repo), or just to people inside the same github org

We can use the owner's github token so that we aren't maxing out our own each day

UI feedback: reduce the redundant info

On the new layout, we're showing the URL twice - and I'm thinking it might not be necessary:

image

I'm not sure what would be a good solution for it - but one simple solution might be just changing the text in the search box. Instead of having repository.surf/... which feels a bit redundant, what if we had something like, "Switch to another org/owner: "?

Show total stars across whole org

This should be feasible even for orgs with many repos and many stars.

We get 5000 points every hour from the GitHub API, and each point gives us the ability to retrieve about 100 stargazers. So, that means we can retrieve about 500,000 stargazers every hour - which should be enough for almost all orgs.

Plus, once we have the star history data cached in SB, we won't have to retrieve older data anymore. We can just retrieve newer data and merge it with the cache.

Add a footer with some links and supabase branding

Feature request

We probably can add these stuffs in 2 areas: landing page + side bar

Will need to confirm exactly what links to add, what I can think of are:

  • Github Icon that links to the repo
  • Powered by supabase that links to supabase's site
  • Throw in the created logo for repo surf too maybe?

Recommend Projects

  • React photo React

    A declarative, efficient, and flexible JavaScript library for building user interfaces.

  • Vue.js photo Vue.js

    🖖 Vue.js is a progressive, incrementally-adoptable JavaScript framework for building UI on the web.

  • Typescript photo Typescript

    TypeScript is a superset of JavaScript that compiles to clean JavaScript output.

  • TensorFlow photo TensorFlow

    An Open Source Machine Learning Framework for Everyone

  • Django photo Django

    The Web framework for perfectionists with deadlines.

  • D3 photo D3

    Bring data to life with SVG, Canvas and HTML. 📊📈🎉

Recommend Topics

  • javascript

    JavaScript (JS) is a lightweight interpreted programming language with first-class functions.

  • web

    Some thing interesting about web. New door for the world.

  • server

    A server is a program made to process requests and deliver data to clients.

  • Machine learning

    Machine learning is a way of modeling and interpreting data that allows a piece of software to respond intelligently.

  • Game

    Some thing interesting about game, make everyone happy.

Recommend Org

  • Facebook photo Facebook

    We are working to build community through open source technology. NB: members must have two-factor auth.

  • Microsoft photo Microsoft

    Open source projects and samples from Microsoft.

  • Google photo Google

    Google ❤️ Open Source for everyone.

  • D3 photo D3

    Data-Driven Documents codes.