Coder Social home page Coder Social logo

suchak1 / hyperdrive Goto Github PK

View Code? Open in Web Editor NEW
137.0 5.0 19.0 15.66 MB

algorithmic trading using machine learning

Home Page: https://FORCEPU.SH

License: MIT License

Python 98.88% Shell 1.12%
algorithmic-trading algotrading algotrading-machine-learning algorithmic-trading-python financial-machine-learning robinhood

hyperdrive's Introduction

hyperdrive: an algorithmic trading library

Build Pipeline Dev Pipeline New Release Downloads PyPI

hyperdrive is an algorithmic trading library that powers quant research firm ย  FORCEPU.SH.

Unlike other backtesting libraries, hyperdrive specializes in data collection and quantitative research.

In the examples below, we explore how to:

  1. store market data
  2. create trading strategies
  3. test strategies against historical data (backtesting)
  4. execute orders.

Getting Started

Prerequisites

You will need Python 3.8+

Installation

To install the necessary packages, run

pythom -m pip install hyperdrive -U

Examples

Most secrets must be passed as environment variables. Future updates will allow secrets to be passed directly into class object (see example on order execution).

1. Storing data

Pre-requisites:

  • an IEXCloud or Polygon API key
  • an AWS account and an S3 bucket

Environment Variables:

  • IEXCLOUD or POLYGON
  • AWS_ACCESS_KEY_ID
  • AWS_SECRET_ACCESS_KEY
  • AWS_DEFAULT_REGION
  • S3_BUCKET
from hyperdrive import DataSource
from DataSource import IEXCloud, MarketData

# IEXCloud API token loaded as an environment variable (os.environ['IEXCLOUD'])

symbol = 'TSLA'
timeframe = '7d'

md = MarketData()
iex = IEXCloud()

iex.save_ohlc(symbol=symbol, timeframe=timeframe)
df = md.get_ohlc(symbol=symbol, timeframe=timeframe)

print(df)

Output:

           Time     Open       High      Low    Close       Vol
2863 2021-11-10  1010.41  1078.1000   987.31  1067.95  42802722
2864 2021-11-11  1102.77  1104.9700  1054.68  1063.51  22396568
2865 2021-11-12  1047.50  1054.5000  1019.20  1033.42  25573148
2866 2021-11-15  1017.63  1031.9800   978.60  1013.39  34775649
2867 2021-11-16  1003.31  1057.1999  1002.18  1054.73  26542359

2. Creating a model

Much of this code is still closed-source, but you can take a look at the Historian class in the History module for some ideas.

3. Backtesting a strategy

We use vectorbt to backtest strategies.

from hyperdrive import History, DataSource, Constants as C
from History import Historian
from DataSource import MarketData

hist = Historian()
md = MarketData()

symbol = 'TSLA'
timeframe = '1y'

df = md.get_ohlc(symbol=symbol, timeframe=timeframe)

holding = hist.buy_and_hold(df[C.CLOSE])
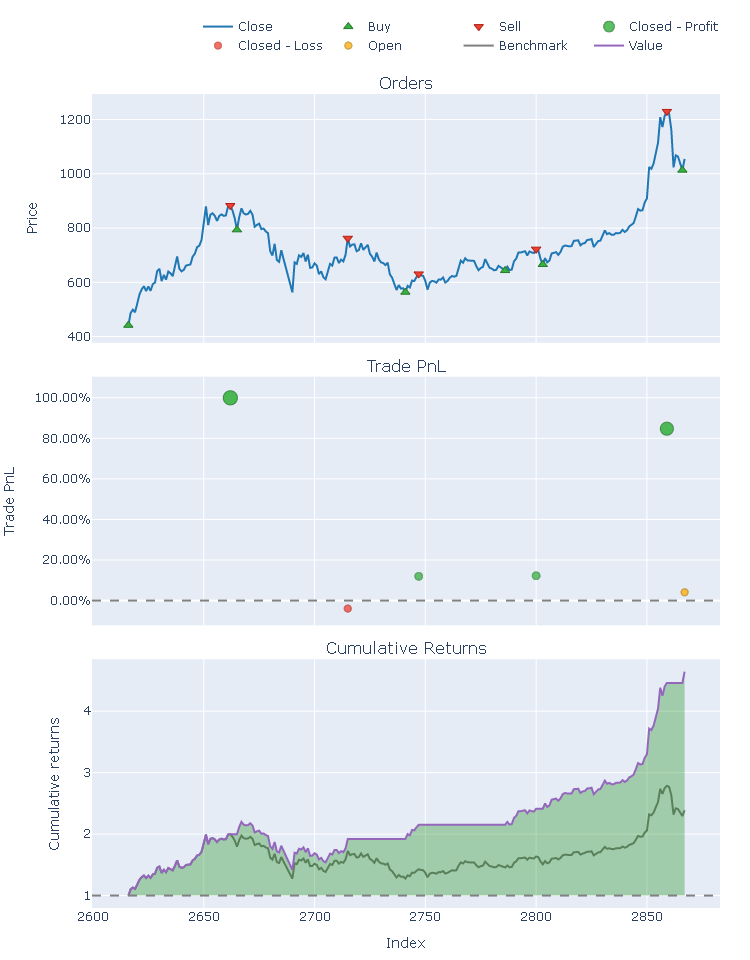
signals = hist.get_optimal_signals(df[C.CLOSE])
my_strat = hist.create_portfolio(df[C.CLOSE], signals)

metrics = [
    'Total Return [%]', 'Benchmark Return [%]',
    'Max Drawdown [%]', 'Max Drawdown Duration',
    'Total Trades', 'Win Rate [%]', 'Avg Winning Trade [%]',
    'Avg Losing Trade [%]', 'Profit Factor',
    'Expectancy', 'Sharpe Ratio', 'Calmar Ratio',
    'Omega Ratio', 'Sortino Ratio'
]

holding_stats = holding.stats()[metrics]
my_strat_stats = my_strat.stats()[metrics]

print(f'Buy and Hold Strat\n{"-"*42}')
print(holding_stats)

print(f'My Strategy\n{"-"*42}')
print(my_strat_stats)

# holding.plot()
my_strat.plot()

Output:

Buy and Hold Strat
------------------------------------------
Total Return [%]                138.837436
Benchmark Return [%]            138.837436
Max Drawdown [%]                 36.246589
Max Drawdown Duration    186 days 00:00:00
Total Trades                             1
Win Rate [%]                           NaN
Avg Winning Trade [%]                  NaN
Avg Losing Trade [%]                   NaN
Profit Factor                          NaN
Expectancy                             NaN
Sharpe Ratio                      2.206485
Calmar Ratio                      6.977133
Omega Ratio                       1.381816
Sortino Ratio                     3.623509
Name: Close, dtype: object

My Strategy
------------------------------------------
Total Return [%]                364.275727
Benchmark Return [%]            138.837436
Max Drawdown [%]                  35.49422
Max Drawdown Duration    122 days 00:00:00
Total Trades                             6
Win Rate [%]                          80.0
Avg Winning Trade [%]            52.235227
Avg Losing Trade [%]             -3.933059
Profit Factor                     45.00258
Expectancy                      692.157004
Sharpe Ratio                      4.078172
Calmar Ratio                     23.220732
Omega Ratio                       2.098986
Sortino Ratio                     7.727806
Name: Close, dtype: object

4. Executing an order

Pre-requisites:

  • a Binance.US API key

Environment Variables:

  • BINANCE
from pprint import pprint
from hyperdrive import Exchange
from Exchange import Binance

# Binance API token loaded as an environment variable (os.environ['BINANCE'])

bn = Binance()

# use 45% of your USD account balance to buy BTC
order = bn.order('BTC', 'USD', 'BUY', 0.45)

pprint(order)

Output:

{'clientOrderId': '3cfyrJOSXqq6Zl1RJdeRRC',
 'cummulativeQuoteQty': 46.8315,
 'executedQty': 0.000757,
 'fills': [{'commission': '0.0500',
            'commissionAsset': 'USD',
            'price': '61864.6400',
            'qty': '0.00075700',
            'tradeId': 25803914}],
 'orderId': 714855908,
 'orderListId': -1,
 'origQty': 0.000757,
 'price': 0.0,
 'side': 'SELL',
 'status': 'FILLED',
 'symbol': 'BTCUSD',
 'timeInForce': 'GTC',
 'transactTime': 1637030680121,
 'type': 'MARKET'}

Use

Use the scripts provided in the scripts/ directory as a reference since they are actually used in production daily.

Available data collection functions:

  • Symbols (from Robinhood)
  • OHLC (from IEXCloud and Polygon)
  • Intraday (from IEXCloud and Polygon)
  • Dividends (from IEXCloud and Polygon)
  • Splits (from IEXCloud and Polygon)
  • Social Sentiment (from StockTwits)
  • Unemployment (from the Bureau of Labor Statistics)


hyperdrive's People

Contributors

dependabot[bot] avatar suchak1 avatar

Stargazers

 avatar  avatar  avatar  avatar  avatar  avatar  avatar  avatar  avatar  avatar  avatar  avatar  avatar  avatar  avatar  avatar  avatar  avatar  avatar  avatar  avatar  avatar  avatar  avatar  avatar  avatar  avatar  avatar  avatar  avatar  avatar  avatar  avatar  avatar  avatar  avatar  avatar  avatar  avatar  avatar  avatar  avatar  avatar  avatar  avatar  avatar  avatar  avatar  avatar  avatar  avatar  avatar  avatar  avatar  avatar  avatar  avatar  avatar  avatar  avatar  avatar  avatar  avatar  avatar  avatar  avatar  avatar  avatar  avatar  avatar  avatar  avatar  avatar  avatar  avatar  avatar  avatar  avatar  avatar  avatar  avatar  avatar  avatar  avatar  avatar  avatar  avatar  avatar  avatar  avatar  avatar  avatar  avatar  avatar  avatar  avatar  avatar  avatar  avatar  avatar

Watchers

 avatar  avatar  avatar  avatar  avatar

hyperdrive's Issues

Add more data

Check easily accessible sources. Look into adding ๐Ÿ’ฑ โฌ…๏ธ๐ŸŒŠ and ๐Ÿ’ฑโžก๏ธ๐ŸŒŠ (ex. inflow vs outflow)

Scarlett init function

We should make a Scarlett class with an init function that

  1. authenticates the current user with Robinhood
  2. loads the user's current portfolio holdings
  3. loads their portfolio history
  4. loads the historical data for each instrument in their portfolio history
  5. creates an instrument: symbol lookup table for each instrument above

Keep Low Dimension models for visualization

Create 2 and 3 dimensional models as part of a script that runs after create_model.py.
(First, use pca, lda, tsne, umap to reduce dimensionality.)
(Will add 1-2 hrs to workflow runtime or use matrix and decide whether to use dimensionality reduction in create_model.py thru env var (DIMENSIONALITY_REDUCTION: ['None', 'PCA', 'LDA', 'TSNE', 'UMAP'])
Create csvs or jsons for 2d and 3d plottable data or plotly html file.

Check account balance during should_order

In execute_order script, should_order script should consider account balance when deciding to order (BTC balance when selling, USD balance when buying) after consecutive same signals.

Walk through portfolio history

Create a function to walk through the portfolio and simulate the actions that led to the current holdings. Might be useful to create the simulation functions for buying and maybe selling here.

buy(symbol, quantity, price)

Get/Store Historical Dividend Data

Get historical dividend data for all stocks in portfolio using Yahoo Finance (yahooquery package) or Nasdaq. Save table as csv in data/ and preload as part of load_portfolio.

Looking into import pandas_datareader as pdr as well.

Add checks for update scripts

For scripts using multiple processes, use a lock or manager to manage a shared variable and figure out if > 5% of data saves / function calls fail.

Figure out position sizing

Find a way to get optimal position sizing for each time t with size 0 <= s <= 1.0 and s being the proportion of quote asset used to buy base asset or base asset sold for quote asset.

Fix Symbols

Fix symbols to include only symbols in holdings not all in portfolio history.

Split script false-positive failure

Split script reports a failure bc <5% of symbols tracked have had stock splits in the last 3 months. Find a solution to stop false positive failures. Reduce threshold to 1%?

Make Config Class

Make a Config class that loads all environment variables in config.env and import/load config when needed. Move Pathfinder into its own file.

Fix holiday error

If Fri or Mon is a holiday, then the OHLC script will produce an error on Mon or Tue bc there is no market data returned during the 3 day buffer.

Check if market holiday is in date range and don't produce error.

Moving average function

Create a function that calculates n-day moving average for a symbol.

moving_avg(n, symbol, date=today)

Look into use of the ta library for incorporation of even more indicators.

Automatically generate docs

google "python library docs generator", pick best one, and refactor library to autogenerate docs

get a linter to make sure functions are compliant w doc generation during pr validation?

generate html doc, push to forcepu.sh bucket (better for making docs public acl read - remove delete flag from deploy units workflow) or hyperdrive bucket (better for showing docs from hyperdrive) and serve from forcepush - pull in locally as part of build process s3 download w creds (hyperdrive bucket) or just make request to object url (public access - forcepush bucket) or git checkout hyperdrive and generate docs on the fly

Polygon OHLC isn't updating for new symbols (post Oct. 30)

Namely MARA, RIOT, ARK*

Probably from this commit: 9c338b7

Theory: The time related update didn't work, and the response from Polygon is empty for '1d', so MarketData obj is either returning nothing or most recent row in cached data (csv) instead of previous day's data directly from Polygon.

Create Split Worker

Create split worker that updates historical data accordingly (dividends, eod ohlc, intraday ohlc)

S3 Integration

Save data in S3 rather than in repo
Smart load of data (check if data is 1 day or 1 week old?) - local
Mock data for CI tests + step to download relevant data files used in tests from s3 ('AAPL.csv')

Add Double Redundancy

Use Polygon.io as a secondary data provider to add double redundancy to the data collection pipeline.

Remake the model

  • Clean up model to use preprocess fx instead of undersample.
  • Add SMOTE
  • Use ddof=0
  • Don't convert date to int64 for derivative, just assume dx = 1
  • Don't use PCA for final

Fix dependency update version/tag bump

Best soln:
Try anothrNick/github-tag-action w dry run enabled first, then use version output (steps.bumpVersion.outputs.new_tag) for INPUT_TAGGING_MESSAGE in stefanzweifel/git-auto-commit-action, then create new release (action from release.yml)

Plot annualized dividend yield over time

At each point in time, find total dividend / total account value as percentage. Then, divide resulting value at each time t by current time in years. This is the annual dividend yield for all t.

Plot Historicals

Create a function to plot historicals for a given instrument or symbol.

plot(symbol, start, end, instrument=None)

Rewrite readme

  • Remove mention of "Robinhood"
  • Describe as library for algotrading research and execution
  • Provide example of how to get data (iex env var), store data (s3 and iex env var), create model, backtest model predictions, execute order based on prediction, visualize research
  • Use new logo

Recommend Projects

  • React photo React

    A declarative, efficient, and flexible JavaScript library for building user interfaces.

  • Vue.js photo Vue.js

    ๐Ÿ–– Vue.js is a progressive, incrementally-adoptable JavaScript framework for building UI on the web.

  • Typescript photo Typescript

    TypeScript is a superset of JavaScript that compiles to clean JavaScript output.

  • TensorFlow photo TensorFlow

    An Open Source Machine Learning Framework for Everyone

  • Django photo Django

    The Web framework for perfectionists with deadlines.

  • D3 photo D3

    Bring data to life with SVG, Canvas and HTML. ๐Ÿ“Š๐Ÿ“ˆ๐ŸŽ‰

Recommend Topics

  • javascript

    JavaScript (JS) is a lightweight interpreted programming language with first-class functions.

  • web

    Some thing interesting about web. New door for the world.

  • server

    A server is a program made to process requests and deliver data to clients.

  • Machine learning

    Machine learning is a way of modeling and interpreting data that allows a piece of software to respond intelligently.

  • Game

    Some thing interesting about game, make everyone happy.

Recommend Org

  • Facebook photo Facebook

    We are working to build community through open source technology. NB: members must have two-factor auth.

  • Microsoft photo Microsoft

    Open source projects and samples from Microsoft.

  • Google photo Google

    Google โค๏ธ Open Source for everyone.

  • D3 photo D3

    Data-Driven Documents codes.