![]()
This repository contains a modern set of Grafana dashboards for Kubernetes.
They are inspired by many other dashboards from kubernetes-mixin and grafana.com.
You can also find and download them on Grafana.com.
Theses dashboards are made and tested for the kube-prometheus-stack chart, but they should work well with others as soon as you have kube-state-metrics and prometheus-node-exporter installed on your Kubernetes cluster.
They are not backward compatible with older Grafana versions because they try to take advantage of Grafana's newest features like:
gradient modeintroduced in Grafana 8.1 (Grafana Blog post)time seriesvisualization panel introduced in Grafana 7.4 (Grafana Blog post)$__rate_intervalvariable introduced in Grafana 7.2 (Grafana Blog post)
They also have a Prometheus Datasource variable so they will work on a federated Grafana instance.
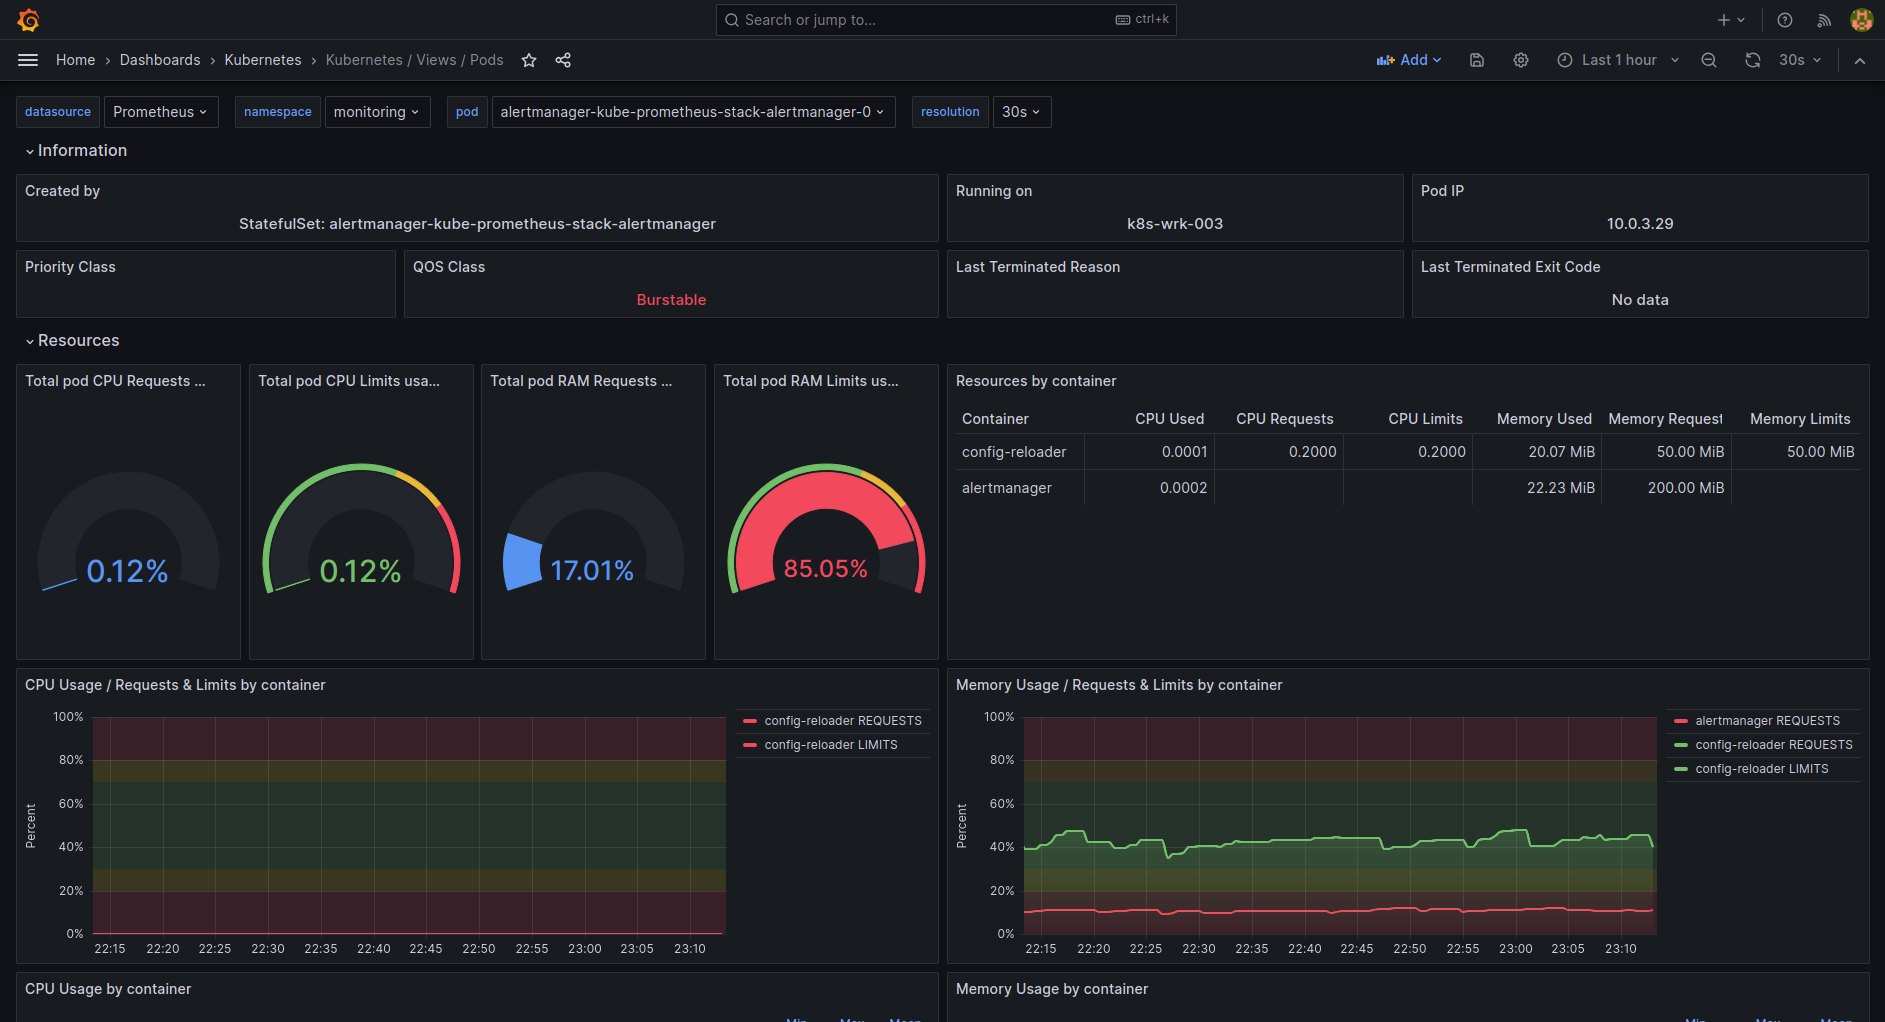
As an example, here's how the Kubernetes / Views / Global dashboard looks like:

| File name | Description | Screenshot |
|---|---|---|
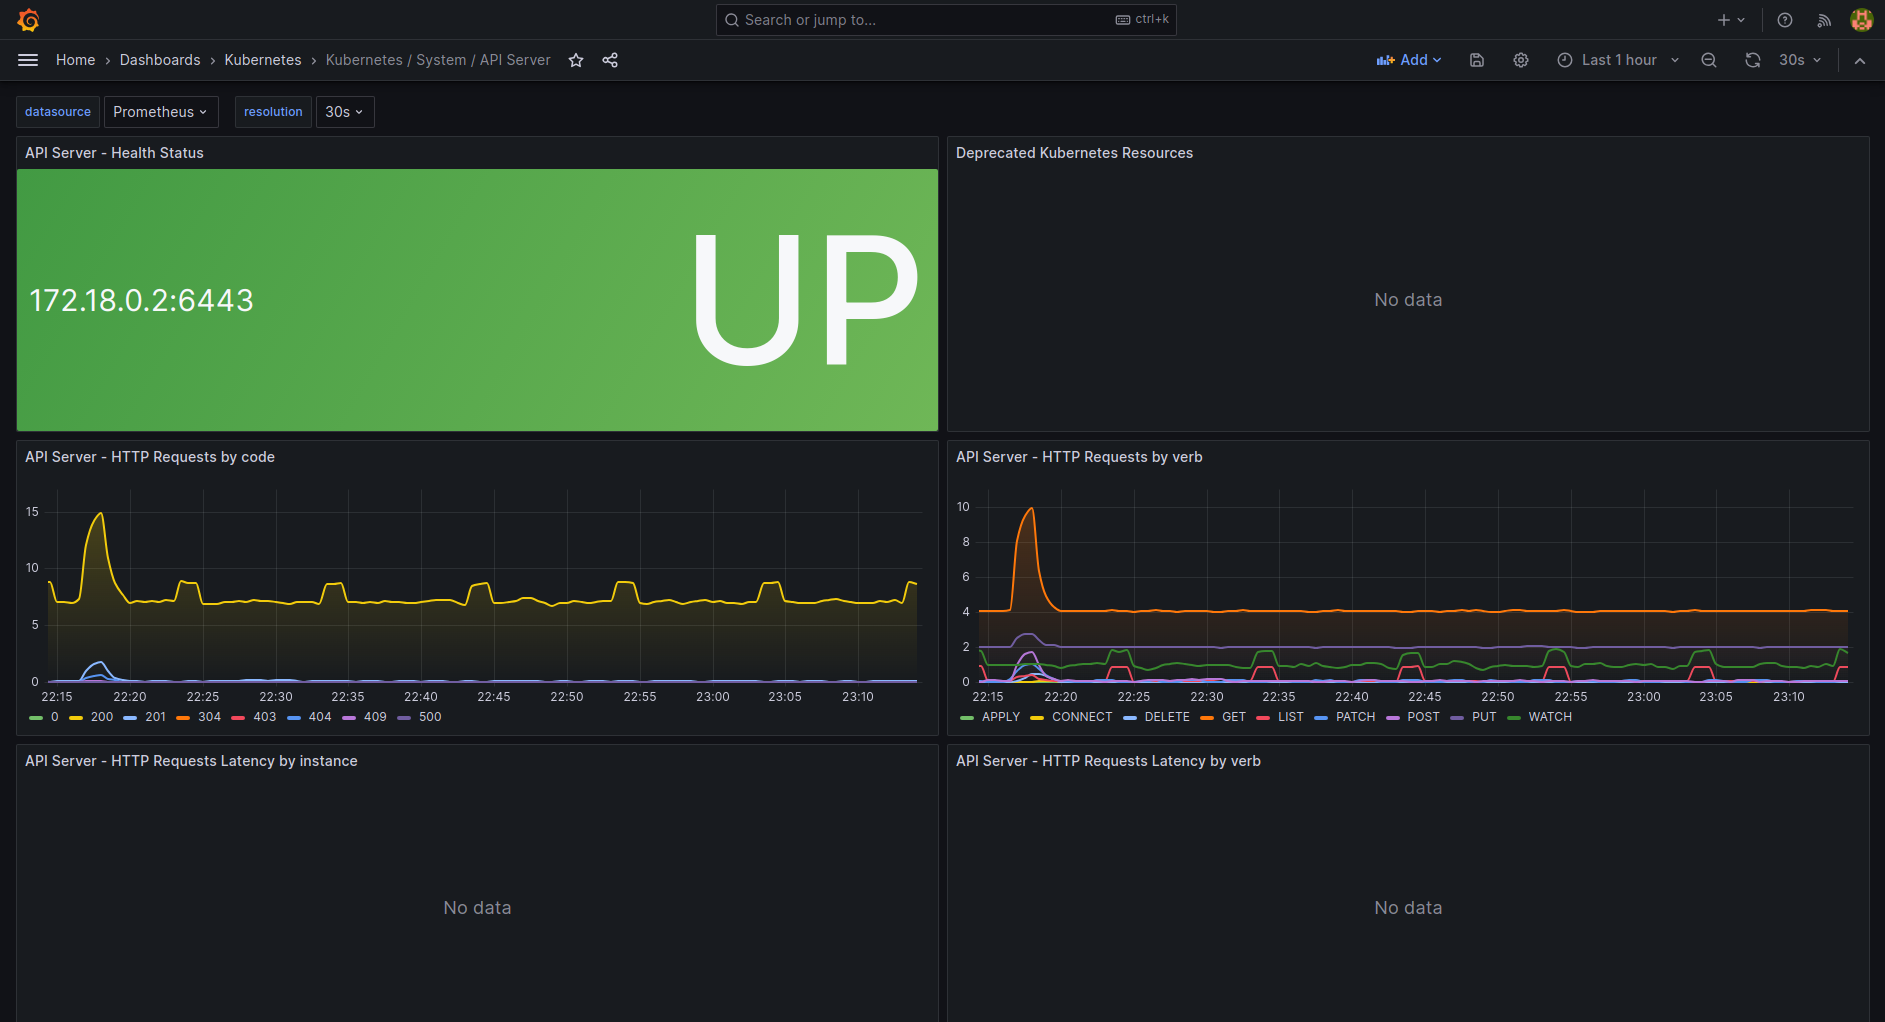
| k8s-system-api-server.json | Dashboard for the API Server Kubernetes. | LINK |
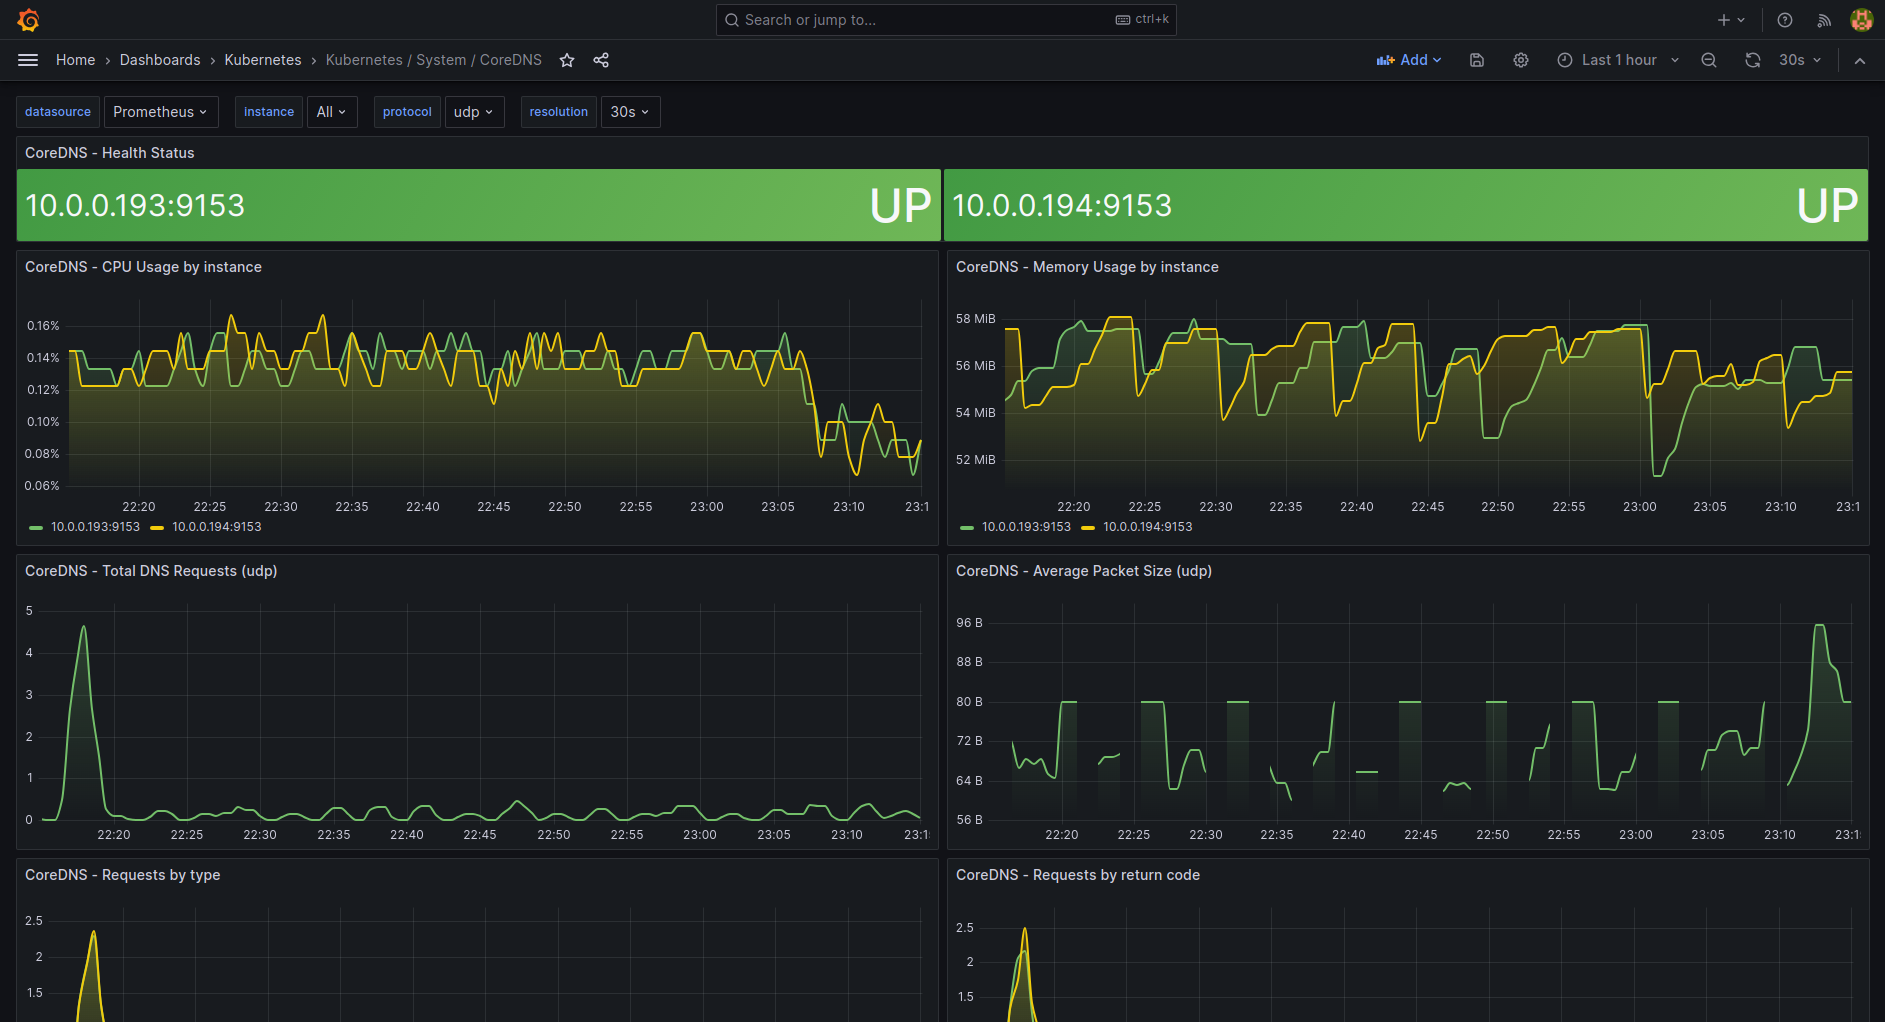
| k8s-system-coredns.json | Show information on the CoreDNS Kubernetes component. | LINK |
| k8s-views-global.json | Global level view dashboard for Kubernetes. |
LINK |
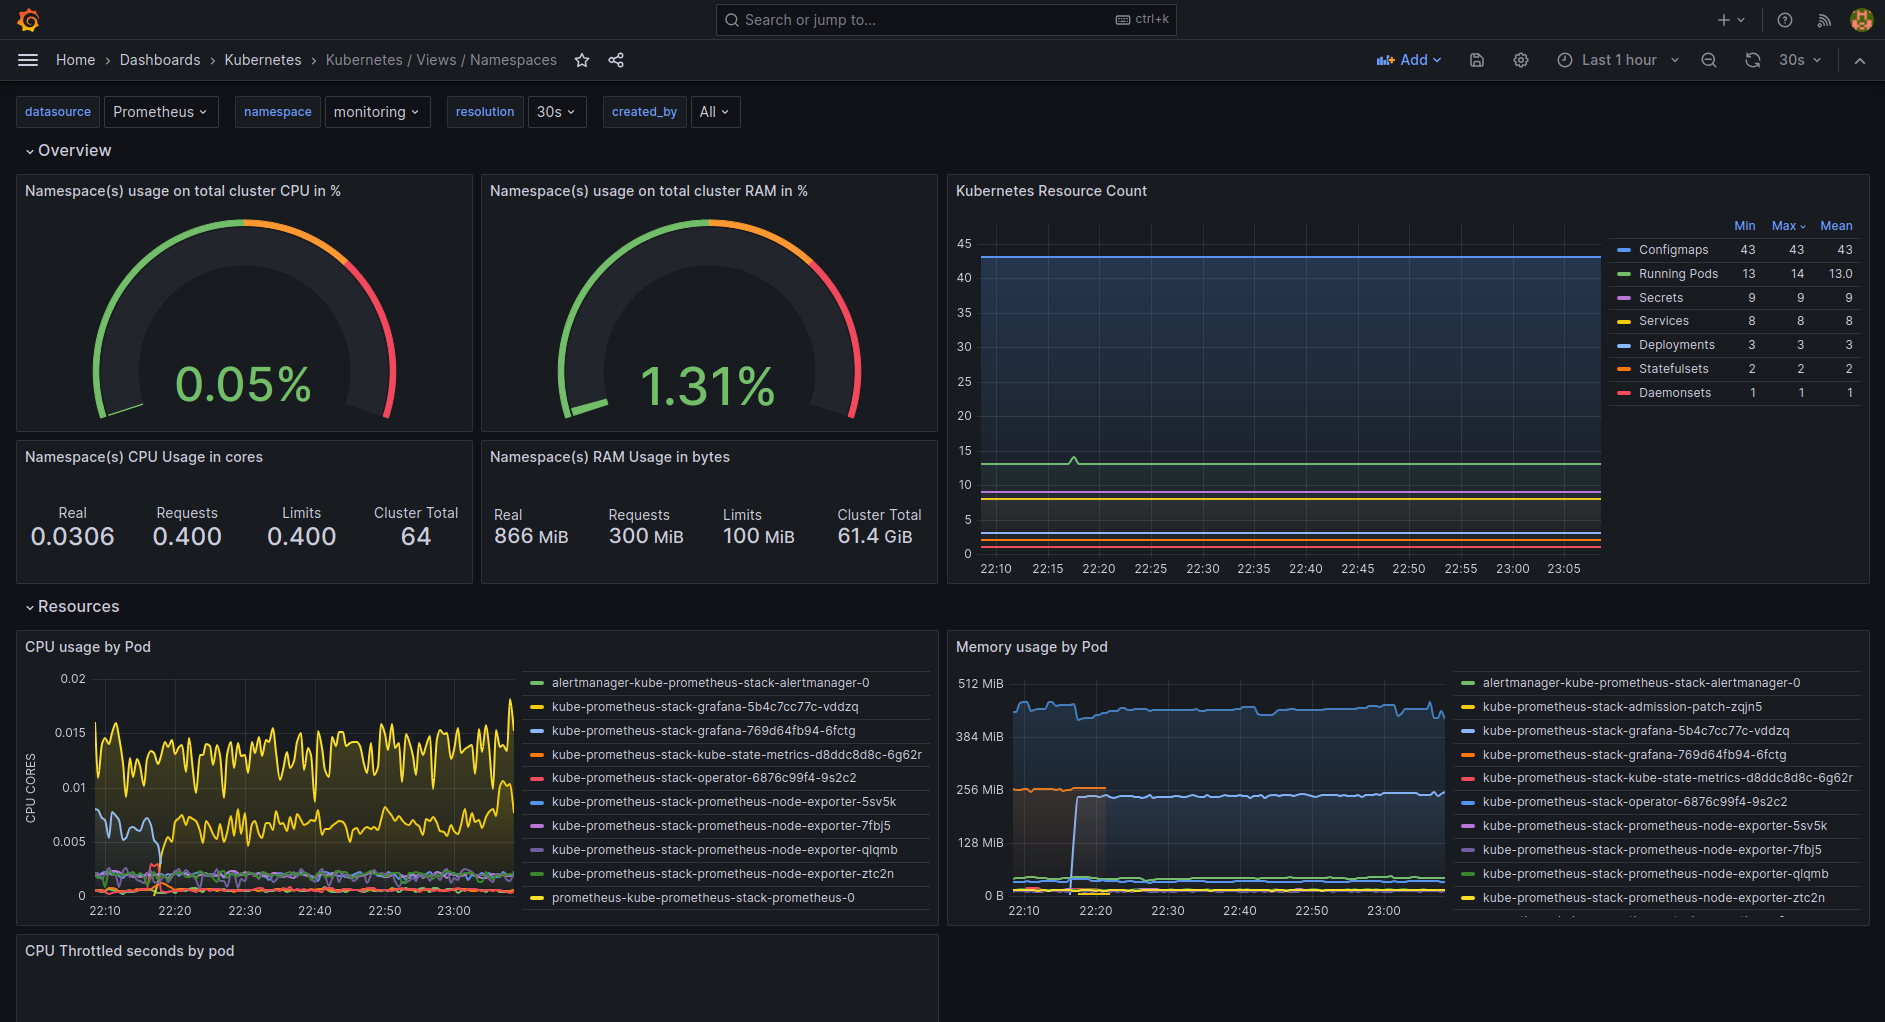
| k8s-views-namespaces.json | Namespaces level view dashboard for Kubernetes. |
LINK |
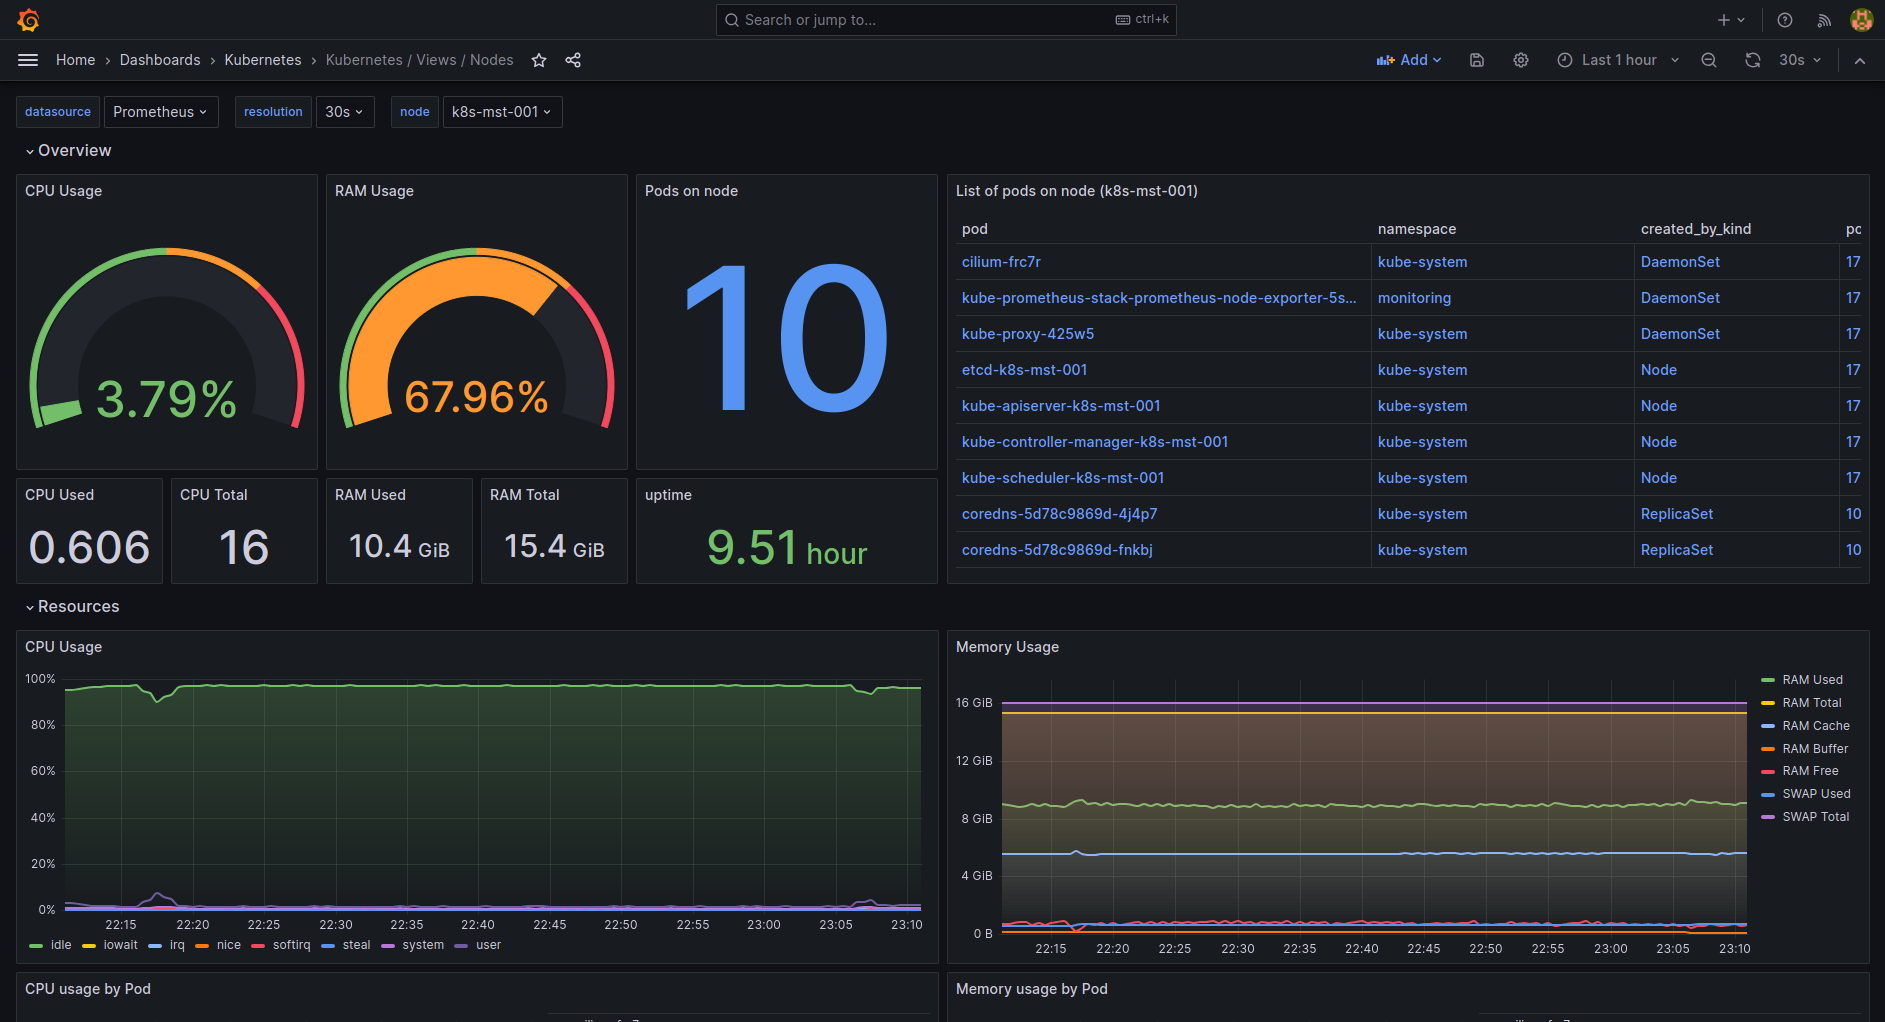
| k8s-views-nodes.json | Nodes level view dashboard for Kubernetes. |
LINK |
| k8s-views-pods.json | Pods level view dashboard for Kubernetes. |
LINK |
Feel free to contribute to this project:
- Create an Issue to make a feature request, report a bug or share an idea.
- Create a Pull Request if you want to share code or anything useful to this project.
