The Network Diagram extension uses the d3.js library to draw a network of nodes from a Qlik data set of edges. It also showcases some of the interactive capabilities that are possible with Qlik extensions.
This extension uses 2 dimensions and 1 measure. The first dimension is the source node of a link, and the second dimension is the target node. The measure is a weight on the link. For this implementation, the weights on the links are summed for each node and used to size the nodes. For example, if a weight of "1" is used for all links, then each node will be sized based on the number of links that are connected to it. For this particular implementation to work, the data set provided in QlikView must have both directions of the link provided. That is, if a link A->B exists in the Qlik data, then B->A must also exist for the link to be rendered properly.
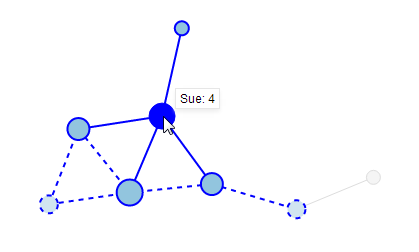
Hovering over a node will highlight all of the nodes direct neighbors in solid blue. It will also highlight it's secondary neighbors (as in, neighbors of neighbors), in dashed blue.
An example qvf file with the extension implemented is provided in the examples folder.