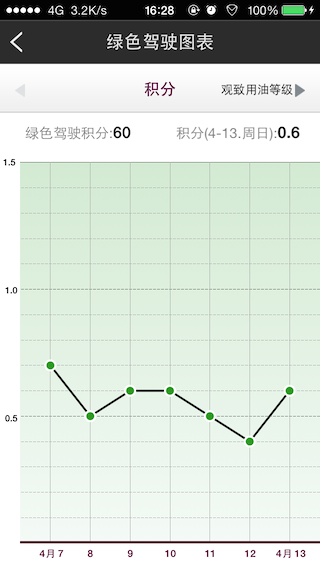
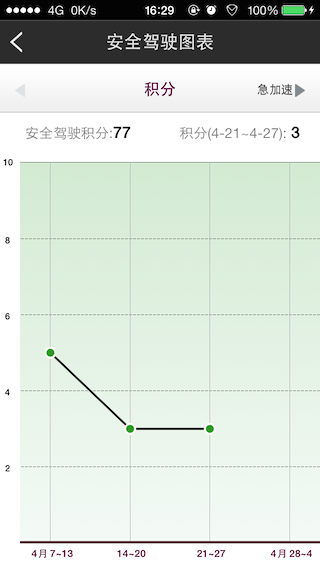
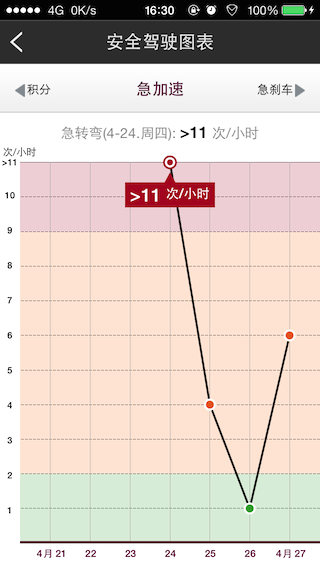
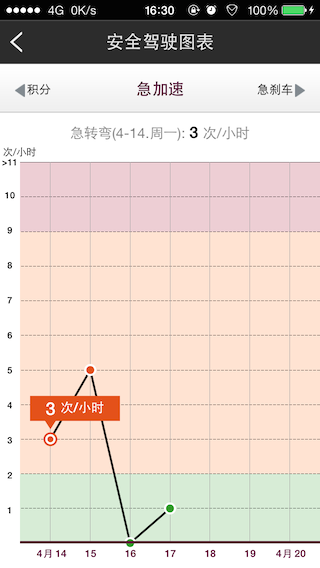
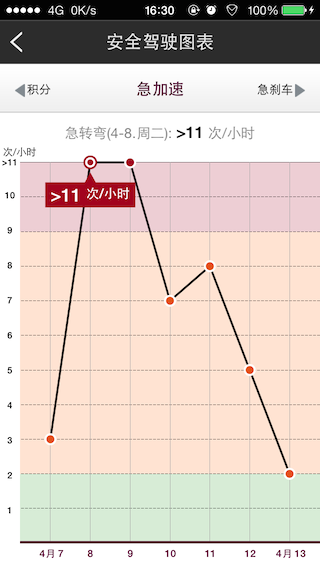
     self.chartsView = [[CSChartsView alloc] initWithFrame:CGRectMake(0, 64, 320, 320)];
[self.view addSubview:self.chartsView];
    self.chartsView.yAxisMax = 100;
    self.chartsView.yAxisMin = 0;
    self.chartsView.yAxisSignAmount = 15;
self.chartsView.yAxisSignFormat = @"%0.0f";
self.chartsView.detailRectUnitString = @"times/h";
//self.chartsView.detailRectSize = CGSizeMake(180, 125);


   self.chartsView.xAxisSignArray = [NSArray arrayWithObjects:@"1",@"2",@"3",@"4",@"5",@"6",@"7",@"8",@"9",@"10",@"11",@"12",@"13",@"14",@"15",@"16",@"17",@"18",@"19",@"20",@"21",@"22",@"23",@"24",@"25",@"26",@"27", nil];


CSChartsPoint *point0 = CSChartsPointMake(1, 10);
point0.pointStyle = CSChartsPointStyleSolidWhite;
point0.color = [UIColor colorWithRed:228 / 255.0 green:81 / 255.0 blue:26 / 255.0 alpha:1];

CSChartsPoint *point1 = CSChartsPointMake(2, 2);
point1.pointStyle = CSChartsPointStyleSolidWhite;
point1.color = [UIColor colorWithRed:228 / 255.0 green:81 / 255.0 blue:26 / 255.0 alpha:1];

CSChartsPoint *point2 = CSChartsPointMake(3, 0);
point2.pointStyle = CSChartsPointStyleSolidWhite;
point2.color = [UIColor colorWithRed:228 / 255.0 green:81 / 255.0 blue:26 / 255.0 alpha:1];

CSChartsPoint *point3 = CSChartsPointMake(4, -2);
point3.pointStyle = CSChartsPointStyleSolidWhite;
point3.color = [UIColor colorWithRed:228 / 255.0 green:81 / 255.0 blue:26 / 255.0 alpha:1];

CSChartsPoint *point4 = CSChartsPointMake(5, 6);
point4.pointStyle = CSChartsPointStyleSolidWhite;
point4.color = [UIColor colorWithRed:228 / 255.0 green:81 / 255.0 blue:26 / 255.0 alpha:1];

CSChartsPoint *point5 = CSChartsPointMake(6, 6);
point5.pointStyle = CSChartsPointStyleSolidWhite;
point5.color = [UIColor colorWithRed:228 / 255.0 green:81 / 255.0 blue:26 / 255.0 alpha:1];

CSChartsPoint *point6 = CSChartsPointMake(7, 6);
point6.pointStyle = CSChartsPointStyleSolidWhite;
point6.color = [UIColor colorWithRed:228 / 255.0 green:81 / 255.0 blue:26 / 255.0 alpha:1];

CSChartsPoint *point7 = CSChartsPointMake(8, 10);
point7.pointStyle = CSChartsPointStyleSolidWhite;
point7.color = [UIColor colorWithRed:228 / 255.0 green:81 / 255.0 blue:26 / 255.0 alpha:1];

CSChartsPoint *point8 = CSChartsPointMake(9, 6);
point8.pointStyle = CSChartsPointStyleSolidWhite;
point8.color = [UIColor colorWithRed:228 / 255.0 green:81 / 255.0 blue:26 / 255.0 alpha:1];

CSChartsPoint *point9 = CSChartsPointMake(10, 6);
point9.pointStyle = CSChartsPointStyleSolidWhite;
point9.color = [UIColor colorWithRed:228 / 255.0 green:81 / 255.0 blue:26 / 255.0 alpha:1];

CSChartsPoint *point10 = CSChartsPointMake(11, 0);
point10.pointStyle = CSChartsPointStyleSolidWhite;
point10.color = [UIColor colorWithRed:228 / 255.0 green:81 / 255.0 blue:26 / 255.0 alpha:1];

CSChartsPoint *point11 = CSChartsPointMake(12, 2);
point11.pointStyle = CSChartsPointStyleSolidWhite;
point11.color = [UIColor colorWithRed:228 / 255.0 green:81 / 255.0 blue:26 / 255.0 alpha:1];

CSChartsPoint *point12 = CSChartsPointMake(13, 6);
point12.pointStyle = CSChartsPointStyleSolidWhite;
point12.color = [UIColor colorWithRed:228 / 255.0 green:81 / 255.0 blue:26 / 255.0 alpha:1];

CSChartsPoint *point13 = CSChartsPointMake(14, 0);
point13.pointStyle = CSChartsPointStyleSolidWhite;
point13.color = [UIColor colorWithRed:228 / 255.0 green:81 / 255.0 blue:26 / 255.0 alpha:1];

CSChartsPoint *point14 = CSChartsPointMake(15, -2);
point14.pointStyle = CSChartsPointStyleSolidWhite;
point14.color = [UIColor colorWithRed:228 / 255.0 green:81 / 255.0 blue:26 / 255.0 alpha:1];

CSChartsPoint *point15 = CSChartsPointMake(16, 6);
point15.pointStyle = CSChartsPointStyleSolidWhite;
point15.color = [UIColor colorWithRed:228 / 255.0 green:81 / 255.0 blue:26 / 255.0 alpha:1];

CSChartsPoint *point16 = CSChartsPointMake(17, 0);
point16.pointStyle = CSChartsPointStyleSolidWhite;
point16.color = [UIColor colorWithRed:228 / 255.0 green:81 / 255.0 blue:26 / 255.0 alpha:1];

CSChartsPoint *point17 = CSChartsPointMake(18, 6);
point17.pointStyle = CSChartsPointStyleSolidWhite;
point17.color = [UIColor colorWithRed:228 / 255.0 green:81 / 255.0 blue:26 / 255.0 alpha:1];

CSChartsPoint *point18 = CSChartsPointMake(19, 2);
point18.pointStyle = CSChartsPointStyleSolidWhite;
point18.color = [UIColor colorWithRed:228 / 255.0 green:81 / 255.0 blue:26 / 255.0 alpha:1];

CSChartsPoint *point19 = CSChartsPointMake(20, 6);
point19.pointStyle = CSChartsPointStyleSolidWhite;
point19.color = [UIColor colorWithRed:228 / 255.0 green:81 / 255.0 blue:26 / 255.0 alpha:1];

CSChartsPoint *point20 = CSChartsPointMake(21, 6);
point20.pointStyle = CSChartsPointStyleSolidWhite;
point20.color = [UIColor colorWithRed:228 / 255.0 green:81 / 255.0 blue:26 / 255.0 alpha:1];

CSChartsPoint *point21 = CSChartsPointMake(22, 2);
point21.pointStyle = CSChartsPointStyleSolidWhite;
point21.color = [UIColor colorWithRed:228 / 255.0 green:81 / 255.0 blue:26 / 255.0 alpha:1];

CSChartsPoint *point22 = CSChartsPointMake(23, 2);
point22.pointStyle = CSChartsPointStyleSolidWhite;
point22.color = [UIColor colorWithRed:228 / 255.0 green:81 / 255.0 blue:26 / 255.0 alpha:1];

CSChartsPoint *point23 = CSChartsPointMake(24, 0);
point23.pointStyle = CSChartsPointStyleSolidWhite;
point23.color = [UIColor colorWithRed:228 / 255.0 green:81 / 255.0 blue:26 / 255.0 alpha:1];

CSChartsPoint *point24 = CSChartsPointMake(25, 0);
point24.pointStyle = CSChartsPointStyleSolidWhite;
point24.color = [UIColor colorWithRed:228 / 255.0 green:81 / 255.0 blue:26 / 255.0 alpha:1];

CSChartsPoint *point25 = CSChartsPointMake(26, 6);
point25.pointStyle = CSChartsPointStyleSolidWhite;
point25.color = [UIColor colorWithRed:228 / 255.0 green:81 / 255.0 blue:26 / 255.0 alpha:1];

CSChartsPoint *point26 = CSChartsPointMake(27, -2);
point26.pointStyle = CSChartsPointStyleSolidWhite;
point26.color = [UIColor colorWithRed:228 / 255.0 green:81 / 255.0 blue:26 / 255.0 alpha:1];


self.chartsView.mainLinePointArray = [NSArray arrayWithObjects:point0,point1,point2,point3,point4,point5,point6,point7,point8,point9,point10,point11,point12,point13,point14,point15,point16,point17,point18,point19,point20,point21,point22,point23,point24,point25,point26, nil];


self.chartsView.detailRectTextFormat = @"%0.f ";
self.chartsView.isRegionSeparated = NO;
self.chartsView.colorRegionArray = [NSArray arrayWithObjects:CSChartsColorRegionMake([UIColor colorWithRed:211 / 255.0 green:234 / 255.0 blue:210 / 255.0 alpha:1], 40),CSChartsColorRegionMake([UIColor colorWithRed:244 / 255.0 green:250 / 255.0 blue:246 / 255.0 alpha:1], 40),nil];

