Coder Social home page Coder Social logo

sgratzl / chartjs-chart-pcp Goto Github PK

View Code? Open in Web Editor NEW
20.0 3.0 2.0 14.99 MB

Chart.js Parallel Coordinates Plot

Home Page: https://www.sgratzl.com/chartjs-chart-pcp/

License: MIT License

JavaScript 11.87% TypeScript 88.13%
chartjs chartjs-plugin parallel-coordinates parallel-coordinates-plot javascript

chartjs-chart-pcp's Introduction

Chart.js Parallel Coordinate Plots

NPM Package Github Actions

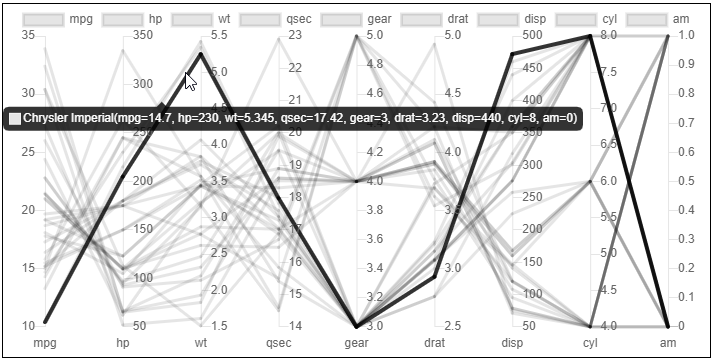
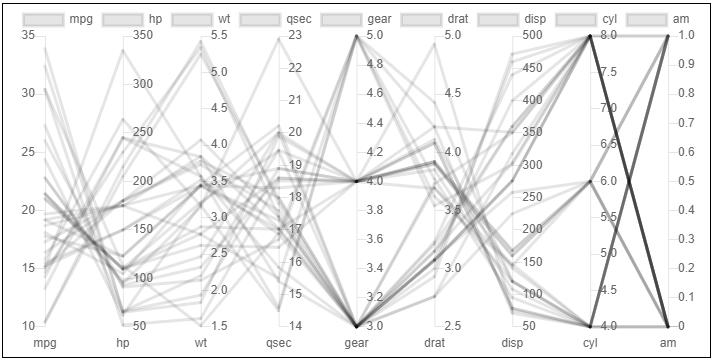
Chart.js module for charting parallel coordinate plots (PCPs). Adding new chart type: pcp.

MTCars

Open in CodePen

MTCars Tooltip

MTCars Tension

Open in CodePen

Related Plugins

Check out also my other chart.js plugins:

Install

npm install --save chart.js chartjs-chart-pcp

Usage

see Examples

Open in CodePen

PCP

Data Structure

the data items are the regular data items along with their labels. For each attribute there is a dataset. e.g., in the following example there are three items (A, B, C) with three axes / features (f1, f2, f3).

const objs = [
  { label: 'A', f1: 5, f2: 3, f4: 3 },
  { label: 'B', f1: 2, f2: 1, f4: 8 },
  { label: 'C', f1: 10, f2: 6, f4: 2 },
];
const attrs = ['f1', 'f2', 'f3'];
const config = {
  type: 'pcp',
  data: {
    labels: objs.map((obj) => obj.label),
    datasets: attrs.map((attr) => ({
      label: attr,
      data: objs.map((obj) => obj[attr]),
    })),
  },
  options: {},
};

Styling of elements

Two new elements were added: lineSegment as a subclass of line for a line segment between two axes and linearAxis for representing the vertical axis as a wrapper around a linear scale.

see https://github.com/sgratzl/chartjs-chart-pcp/blob/develop/src/elements/lineSegment.ts#L3-L9

see https://github.com/sgratzl/chartjs-chart-pcp/blob/develop/src/elements/axis.ts#L13-L21

Scaling

The Parallel Coordinates controller pcp uses a linear scale. There is also the logarithmicPcp that uses a logarithmic scale. Using chart.js hybrid charts, one can specify the type per dataset. e.g.,

const config = {
  type: 'pcp',
  data: {
    labels: ['1', '2', '3'],
    datasets: [
      {
        label: 'A',
        data: [1, 2, 3]
      },
      {
        type: 'logarithmicPcp',
        label: 'B',
        data: [1, 2, 10000]
      }
    })),
  },
  options: {},
};

ESM and Tree Shaking

The ESM build of the library supports tree shaking thus having no side effects. As a consequence the chart.js library won't be automatically manipulated nor new controllers automatically registered. One has to manually import and register them.

Variant A:

import Chart from 'chart.js';
import { ParallelCoordinatesController, LinearAxis, LineSegment, PCPScale } from 'chartjs-chart-pcp';

Chart.register(ParallelCoordinatesController, PCPScale, LineSegment);
Chart.registry.addElements(LinearAxis);
...

new Chart(ctx, {
  type: ParallelCoordinatesController.id,
  data: [...],
});

Variant B:

import { ParallelCoordinatesChart } from 'chartjs-chart-pcp';

new ParallelCoordinatesChart(ctx, {
  data: [...],
});

Development Environment

npm i -g yarn
yarn install
yarn sdks vscode

Common commands

yarn compile
yarn test
yarn lint
yarn fix
yarn build
yarn docs
chartjs-chart-pcp's People

Contributors

dependabot[bot] avatar sgratzl avatar

Stargazers

 avatar  avatar  avatar  avatar  avatar  avatar  avatar  avatar  avatar  avatar  avatar  avatar  avatar  avatar  avatar  avatar  avatar  avatar  avatar  avatar

Watchers

 avatar  avatar  avatar

chartjs-chart-pcp's Issues

Cannot run npm install

When running npm install I get the following error

D:\Temp\node_modules\chartjs-chart-pcp>npm install

[email protected] prepare D:\Temp\node_modules\chartjs-chart-pcp
npm run build:dev

[email protected] build:dev D:\Temp\node_modules\chartjs-chart-pcp
rollup -c -i src/index.js

[!] Error: Could not resolve entry module (rollup.config.js).
Error: Could not resolve entry module (rollup.config.js).
    at error (D:\Temp\node_modules\chartjs-chart-pcp\node_modules\rollup\dist\shared\rollup.js:161:30)
    at ModuleLoader.loadEntryModule (D:\Temp\node_modules\chartjs-chart-pcp\node_modules\rollup\dist\shared\rollup.js:17598:16)
    at process._tickCallback (internal/process/next_tick.js:68:7)
    at Function.Module.runMain (internal/modules/cjs/loader.js:834:11)
    at startup (internal/bootstrap/node.js:283:19)
    at bootstrapNodeJSCore (internal/bootstrap/node.js:622:3)

npm ERR! code ELIFECYCLE
npm ERR! errno 1
npm ERR! [email protected] build:dev: `rollup -c -i src/index.js`
npm ERR! Exit status 1

How do you set min/max values on the linearAxis/is there a way to customise each y axis scale?

How do you set min/max values on the linearAxis and is there a way to customise each of the y axis scales (for example y axis 1 round ticks to 3dp, y axis 5 round ticks to whole numbers)?

  • Version: Current version
  • Browser: Chrome

I tried this but nothing seems to change with the scales when I add min/max values
elements: { linearAxis: { axisWidth: 10, border: { color: "grey" }, grid: { display: false }, ticks: { color: "grey", includeBounds: true, }, offset: true, min: 0, max: 1 }, },

Recommend Projects

  • React photo React

    A declarative, efficient, and flexible JavaScript library for building user interfaces.

  • Vue.js photo Vue.js

    ๐Ÿ–– Vue.js is a progressive, incrementally-adoptable JavaScript framework for building UI on the web.

  • Typescript photo Typescript

    TypeScript is a superset of JavaScript that compiles to clean JavaScript output.

  • TensorFlow photo TensorFlow

    An Open Source Machine Learning Framework for Everyone

  • Django photo Django

    The Web framework for perfectionists with deadlines.

  • D3 photo D3

    Bring data to life with SVG, Canvas and HTML. ๐Ÿ“Š๐Ÿ“ˆ๐ŸŽ‰

Recommend Topics

  • javascript

    JavaScript (JS) is a lightweight interpreted programming language with first-class functions.

  • web

    Some thing interesting about web. New door for the world.

  • server

    A server is a program made to process requests and deliver data to clients.

  • Machine learning

    Machine learning is a way of modeling and interpreting data that allows a piece of software to respond intelligently.

  • Game

    Some thing interesting about game, make everyone happy.

Recommend Org

  • Facebook photo Facebook

    We are working to build community through open source technology. NB: members must have two-factor auth.

  • Microsoft photo Microsoft

    Open source projects and samples from Microsoft.

  • Google photo Google

    Google โค๏ธ Open Source for everyone.

  • D3 photo D3

    Data-Driven Documents codes.