List of enhancements
Reprex for enhancements
Enhancement 1
links <- data.frame(
  source = c(0, 0, 0, 1, 2),
  target = c(1, 2, 3, 4, 4)
)

sankeyD3plus::sankeyNetwork(
  Links = links,
  Source = "source",
  Target = "target",
  fontSize = 30,
  nodePadding = 30,
  xAxisDomain = c("One", "Two", "Three")
)
Created on 2023-08-03 with reprex v2.0.2
Enhancement 2
links <- data.frame(
  source = c(0, 0, 1, 2),
  target = c(1, 2, 3, 3),
  value = c(10, 20, 10, 20)
)

nodes <- data.frame(
  label = c("I am using \n in this string",
            "I am using \r in this string",
            "I am using <br> in this string",
            "I am using
            in this string")
)

sankeyD3plus::sankeyNetwork(
  Links = links,
  Nodes = nodes,
  Source = "source",
  Target = "target",
  Value  = "value",
  NodeID = "label",
  xAxisDomain = c("Hello\nWorld", "Hello
                  World", "Hello<br>World")
)
Created on 2023-08-03 with reprex v2.0.2
Enhancement 3
URL <- paste0(
  "https://cdn.rawgit.com/christophergandrud/networkD3/",
  "master/JSONdata/energy.json")
Energy <- jsonlite::fromJSON(URL)
networkD3::sankeyNetwork(Links = Energy$links, Nodes = Energy$nodes, Source = "source",
                         Target = "target", Value = "value", NodeID = "name",
                         units = "TWh", fontSize = 12, nodeWidth = 30,
                         sinksRight = TRUE)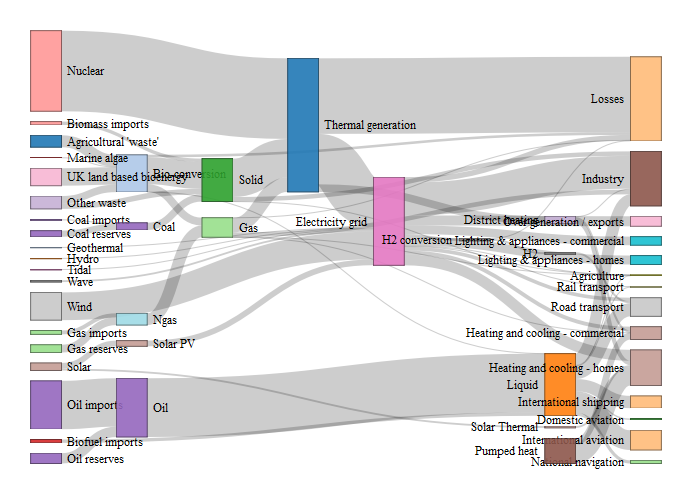
sankeyD3plus::sankeyNetwork(Links = Energy$links, Nodes = Energy$nodes, Source = "source",
              Target = "target", Value = "value", NodeID = "name",
              units = "TWh", fontSize = 12, nodeWidth = 30,
              NodeGroup = "name")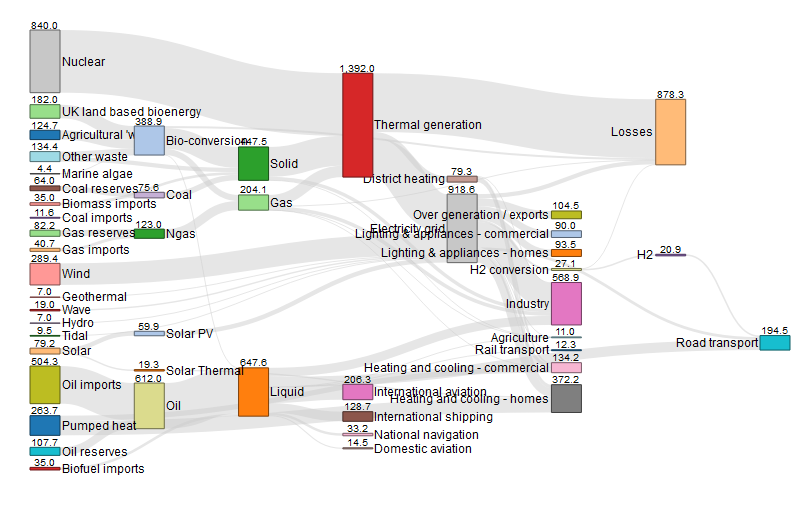
Created on 2023-08-03 with reprex v2.0.2


