Comments (11)
 sbslee
commented on June 5, 2024
sbslee
commented on June 5, 2024
@ketkijoshi278,
Thanks for reporting the issue. I'm not sure which fuc version you are using, but this can occur if your VCF file contains one or more records (rows) where the AF subfield (or other subfields such as AD and DP for that matter) is not present in the FORMAT column. When I first wrote the pyvcf.VcfFrame.plot_hist method, the assumption was that either all or none of the rows would have the AF subfield, but since then I realized that there are many VCF files where only a fraction of the rows have it.
That's why starting the 0.21.0 version, the method will simply drop those rows without the AF subfield and plot only remaining rows. For example, the current version of fuc you are using will give the same error when you run below, but the 0.21.0 version produces a plot without any issues:
from fuc import pyvcf
data = {
'CHROM': ['chr1', 'chr1', 'chr1'],
'POS': [100, 101, 102],
'ID': ['.', '.', '.'],
'REF': ['G', 'T', 'T'],
'ALT': ['A', 'C', 'A'],
'QUAL': ['.', '.', '.'],
'FILTER': ['.', '.', '.'],
'INFO': ['.', '.', '.'],
'FORMAT': ['GT:AF', 'GT:AF', 'GT'],
'A': ['0/1:0.5', '0/1:0.1', '0/1'],
'B': ['0/1:0.9', '0/1:0.2', '0/1'],
}
vf = pyvcf.VcfFrame.from_dict([], data)
# print(vf.df)
# CHROM POS ID REF ALT QUAL FILTER INFO FORMAT A B
# 0 chr1 100 . G A . . . GT:AF 0/1:0.5 0/1:0.9
# 1 chr1 101 . T C . . . GT:AF 0/1:0.1 0/1:0.2
# 2 chr1 102 . T A . . . GT 0/1 0/1 <<< AF is missing
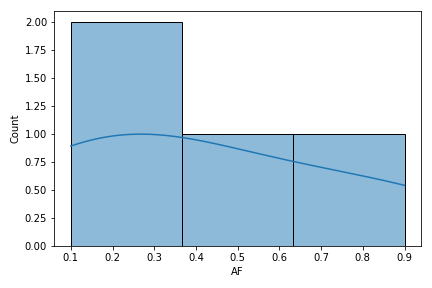
vf.plot_hist('AF')
Please note that the 0.21.0 version is still in development under the 0.21.0-dev branch. The official version will be released this weekend (I'm currently aiming to release a new version weekly or biweekly). In the meantime, you can access the 0.21.0 version in the following way:
# Create a new environment and install fuc and all of its dependencies
$ conda create -n fuc-0.21.0-dev fuc=0.20.0

# Activate the new environment
$ conda activate fuc-0.21.0-dev

# Download the GitHub repository for fuc
$ git clone https://github.com/sbslee/fuc

# Checkout the 0.21.0-dev branch
$ cd fuc
$ git checkout 0.21.0-dev

# Uninstall the current version and install 0.21.0
$ pip install .
I hope this helps! Please let me know if you have further questions.
from fuc.
sbslee
commented on June 5, 2024
Oh, one more thing. You don't need
from fuc import common
common.load_dataset('pyvcf')
in your command if you already have your own VCF file. That's for loading example datasets.
from fuc.
oh okay.
from fuc.
Hey, I have one doubt.
I am writing this code:
#!/bin/python
from fuc import common
vcf_file = 'GEUVADIS.chr22.genotype.vcf'
vf = VcfFrame.from_file(vcf_file)
vf.plot_hist('AF')
But its showing error:
Traceback (most recent call last):
  File "/scratch/kxj190026/TWAS/data_download/vcf/file.python", line 4, in <module>
    vf = VcfFrame.from_file(vcf_file)
NameError: name 'VcfFrame' is not defined
from fuc.
Hi ,
I modify the earlier script
#!/bin/python
from fuc import common
vcf_file = 'GEUVADIS.chr22.genotype.vcf'
vf = common.VcfFrame.from_file(vcf_file)
vf.plot_hist('AF')
But I am getting this error:
Traceback (most recent call last):
  File "file.python", line 4, in <module>
    vf = common.VcfFrame.from_file(vcf_file)
AttributeError: module 'fuc.api.common' has no attribute 'VcfFrame'
from fuc.
sbslee
commented on June 5, 2024
@ketkijoshi278,
The correct syntax for reading a VCF file into a VcfFrame object is:
from fuc import pyvcf
vcf_file = 'GEUVADIS.chr22.genotype.vcf'
vf = pyvcf.VcfFrame.from_file(vcf_file)
vf.plot_hist('AF')
Let me know if you need further help.
from fuc.
Hey, I run the code.
I got this warning.
/scratch/kxj190026/TWAS/data_download/vcf/file.python:4: DtypeWarning: Columns (5) have mixed types.Specify dtype option on import or set low_memory=False.
  vf = pyvcf.VcfFrame.from_file(vcf_file)
Apart from this warning there is no error.
But in my case the plot doesn't show up. I mean I am not getting an output png file or any plot
from fuc.
sbslee
commented on June 5, 2024
@ketkijoshi278,
I think your VCF file may be incorrectly formatted. Can you send me your VCF file so I can take a look ([email protected])?
from fuc.
I send the file to your email id.
thank you.
from fuc.
sbslee
commented on June 5, 2024
As you can see below, the VCF file you sent me does not have the AF subfield in the FORMAT column, which is necessary for the pyvcf.VcfFrame.plot_hist method:
##fileformat=VCFv4.1
##INFO=<ID=LDAF,Number=1,Type=Float,Description="MLE Allele Frequency Accounting for LD">
##INFO=<ID=AVGPOST,Number=1,Type=Float,Description="Average posterior probability from MaCH/Thunder">
##INFO=<ID=RSQ,Number=1,Type=Float,Description="Genotype imputation quality from MaCH/Thunder">
##INFO=<ID=ERATE,Number=1,Type=Float,Description="Per-marker Mutation rate from MaCH/Thunder">
##INFO=<ID=THETA,Number=1,Type=Float,Description="Per-marker Transition rate from MaCH/Thunder">
##INFO=<ID=CIEND,Number=2,Type=Integer,Description="Confidence interval around END for imprecise variants">
##INFO=<ID=CIPOS,Number=2,Type=Integer,Description="Confidence interval around POS for imprecise variants">
##INFO=<ID=END,Number=1,Type=Integer,Description="End position of the variant described in this record">
##INFO=<ID=HOMLEN,Number=.,Type=Integer,Description="Length of base pair identical micro-homology at event breakpoints">
##INFO=<ID=HOMSEQ,Number=.,Type=String,Description="Sequence of base pair identical micro-homology at event breakpoints">
##INFO=<ID=SVLEN,Number=1,Type=Integer,Description="Difference in length between REF and ALT alleles">
##INFO=<ID=SVTYPE,Number=1,Type=String,Description="Type of structural variant">
##INFO=<ID=AC,Number=.,Type=Integer,Description="Alternate Allele Count">
##INFO=<ID=AN,Number=1,Type=Integer,Description="Total Allele Count">
##ALT=<ID=DEL,Description="Deletion">
##FORMAT=<ID=GT,Number=1,Type=String,Description="Genotype">
##FORMAT=<ID=DS,Number=1,Type=Float,Description="Genotype dosage from MaCH/Thunder">
##FORMAT=<ID=GL,Number=.,Type=Float,Description="Genotype Likelihoods">
##INFO=<ID=AA,Number=1,Type=String,Description="Ancestral Allele, ftp://ftp.1000genomes.ebi.ac.uk/vol1/ftp/pilot_data/technical/reference/ancestral_alignments/README">
##INFO=<ID=AF,Number=1,Type=Float,Description="Global Allele Frequency based on AC/AN">
##INFO=<ID=AMR_AF,Number=1,Type=Float,Description="Allele Frequency for samples from AMR based on AC/AN">
##INFO=<ID=ASN_AF,Number=1,Type=Float,Description="Allele Frequency for samples from ASN based on AC/AN">
##INFO=<ID=AFR_AF,Number=1,Type=Float,Description="Allele Frequency for samples from AFR based on AC/AN">
##INFO=<ID=EUR_AF,Number=1,Type=Float,Description="Allele Frequency for samples from EUR based on AC/AN">
##INFO=<ID=VT,Number=1,Type=String,Description="indicates what type of variant the line represents">
##INFO=<ID=SNPSOURCE,Number=.,Type=String,Description="indicates if a snp was called when analysing the low coverage or exome alignment data">
##reference=GRCh37
##INFO=<ID=CSQ,Number=.,Type=String,Description="Consequence type as predicted by VEP. Format: Allele|Gene|Feature|Feature_type|Consequence|cDNA_position|CDS_position|Protein_position|Amino_acids|Codons|Existing_variation|PolyPhen|SIFT|MOTIF_NAME|MOTIF_POS|HIGH_INF_POS|MOTIF_SCORE_CHANGE">
##INFO=<ID=A_A_CHANGE,Number=.,Type=String,Description="Geuvadis custom annotation array, amino acid change">
##INFO=<ID=A_A_LENGTH,Number=.,Type=Integer,Description="Geuvadis custom annotation array, number of amino acids in the peptide">
##INFO=<ID=A_A_POS,Number=.,Type=Integer,Description="Geuvadis custom annotation array, amino acid position in peptide">
##INFO=<ID=ANNOTATION_CLASS,Number=.,Type=String,Description="Geuvadis custom annotation array, annotation class">
##INFO=<ID=CELL,Number=.,Type=String,Description="Geuvadis custom annotation array, regulatory annotation cell type">
##INFO=<ID=CHROM_STATE,Number=.,Type=String,Description="Geuvadis custom annotation array, Encode ChromHMM">
##INFO=<ID=EXON_NUMBER,Number=.,Type=String,Description="Geuvadis custom annotation array, exon number/total exons">
##INFO=<ID=GENE_ID,Number=.,Type=String,Description="Geuvadis custom annotation array, Ensembl gene ID">
##INFO=<ID=GENE_NAME,Number=.,Type=String,Description="Geuvadis custom annotation array, gene name">
##INFO=<ID=HGVS,Number=.,Type=String,Description="Geuvadis custom annotation array, HGVS identifier for the variant">
##INFO=<ID=INTRON_NUMBER,Number=.,Type=String,Description="Geuvadis custom annotation array, intron number/total introns">
##INFO=<ID=MIRNA_MATURE_ID,Number=.,Type=String,Description="Geuvadis custom annotation array, miRBase mature miRNA ID">
##INFO=<ID=MIRNA_MATURE_NAME,Number=.,Type=String,Description="Geuvadis custom annotation array, miRBase miRNA mature name">
##INFO=<ID=MIRNA_PRECURSOR_ID,Number=.,Type=String,Description="Geuvadis custom annotation array, miRBase miRNA precursor ID">
##INFO=<ID=MIRNA_PRECURSOR_NAME,Number=.,Type=String,Description="Geuvadis custom annotation array, miRBase miRNA precursor name">
##INFO=<ID=MIRNA_STRAND,Number=.,Type=String,Description="Geuvadis custom annotation array, miRBase miRNA strand">
##INFO=<ID=MIRNA_TARGET,Number=.,Type=String,Description="Geuvadis custom annotation array, miRNA ID of miRNA target sites">
##INFO=<ID=MIRNA_TARGET_STRAND,Number=.,Type=String,Description="Geuvadis custom annotation array, strand of miRNA target site">
##INFO=<ID=POLYPHEN,Number=.,Type=String,Description="Geuvadis custom annotation array, polyphen category and score for the amino acid change">
##INFO=<ID=REG_ANNOTATION,Number=.,Type=String,Description="Geuvadis custom annotation array, Ensembl Regulatory Build AnnotatedFeature">
##INFO=<ID=SIFT,Number=.,Type=String,Description="Geuvadis custom annotation array, sift category and score for the amino acid change">
##INFO=<ID=TF_MAT,Number=.,Type=String,Description="Geuvadis custom annotation array, transcription factor matrix">
##INFO=<ID=TF_PWM_DELTA,Number=.,Type=String,Description="Geuvadis custom annotation array, transcription factor pwm change">
##INFO=<ID=TF_PWM_INFORM,Number=.,Type=String,Description="Geuvadis custom annotation array, transcription factor pwm information content">
##INFO=<ID=TF_PWM_POS,Number=.,Type=String,Description="Geuvadis custom annotation array, transcription factor pwm position">
##INFO=<ID=TRANSFAC,Number=.,Type=String,Description="Geuvadis custom annotation array, transcription factor name">
##INFO=<ID=TR_BIOTYPE,Number=.,Type=String,Description="Geuvadis custom annotation array, biotype of the transcript">
##INFO=<ID=TR_ID,Number=.,Type=String,Description="Geuvadis custom annotation array, transcript ID">
##INFO=<ID=TR_LENGTH,Number=.,Type=String,Description="Geuvadis custom annotation array, transcript length">
##INFO=<ID=TR_POS,Number=.,Type=String,Description="Geuvadis custom annotation array, position of variant in transcript">
##INFO=<ID=TR_STRAND,Number=.,Type=String,Description="Geuvadis custom annotation array, transcript strand">
##INFO=<ID=BP_TO_EXON,Number=.,Type=String,Description="Geuvadis custom annotation array, distance to exon boundary">
##INFO=<ID=EXON_NUMBER_NEAREST,Number=.,Type=String,Description="Geuvadis custom annotation array, Number of the nearest exon">
##INFO=<ID=A_A_TO_STOP,Number=.,Type=Integer,Description="Geuvadis custom annotation array, Number of peptides until next downstream stop">
##INFO=<ID=A_A_TO_START,Number=.,Type=Integer,Description="Geuvadis custom annotation array, next start codon">
##INFO=<ID=NMD,Number=.,Type=String,Description="Geuvadis custom annotation array, If the transcript is predicted to undergo NMD">
##INFO=<ID=MAINTAIN_FRAME,Number=.,Type=String,Description="Geuvadis custom annotation array, If exon skipping maintains frame">
##INFO=<ID=A_A_LENGTH_OLD_NEW,Number=.,Type=String,Description="Geuvadis custom annotation array, Original peptide length _ new peptide length">
##INFO=<ID=ANNOTATION_SUBCLASS,Number=.,Type=String,Description="Geuvadis custom annotation array, Annotation subtype">
##INFO=<ID=SEVERE_IMPACT,Number=.,Type=String,Description="Geuvadis custom annotation, the most severe annotation class">
##INFO=<ID=SEVERE_GENE,Number=.,Type=String,Description="Geuvadis custom annotation, gene of the most severe annotation">
##INFO=<ID=GENE_TRCOUNT_TOTAL,Number=.,Type=String,Description="Geuvadis custom annotation, number of transcripts in gene of the most severe annotation class">
##INFO=<ID=GENE_TRCOUNT_AFFECTED,Number=.,Type=String,Description="Geuvadis custom annotation, number of transcripts in gene that are affected by the most severe annotation class">
##INFO=<ID=LOF,Number=.,Type=String,Description="Geuvadis custom annotation, HC|LC for low/high confidence of the LOF call (high confidence if there are no lof_flags">
##INFO=<ID=LOF_FLAG,Number=.,Type=String,Description="Geuvadis custom annotation, LOF warning flags">
##INFO=<ID=TR_AFFECTED,Number=.,Type=String,Description="Geuvadis custom annotation, FULL if GENE_TRCOUNT_AFFECTED = GENE_TRCOUNT_TOTAL">
##INFO=<ID=ALLELE,Number=.,Type=String,Description="Geuvadis custom annotation, the annotated allele">
##INFO=<ID=DAF_GLOBAL,Number=.,Type=String,Description="Geuvadis custom annotation, global derived allele frequency in 1000g Phase1 data">
##INFO=<ID=GERP,Number=.,Type=String,Description="Geuvadis custom annotation, mammalian GERP score">
Instead, the VCF file contains the AF subfield in the INFO column:
##INFO=<ID=AF,Number=1,Type=Float,Description="Global Allele Frequency based on AC/AN">
However, this is different from the AF subfield in the FORMAT column, which often looks like this:
##FORMAT=<ID=AF,Number=A,Type=Float,Description="Allele fractions of alternate alleles in the tumor">
Are you sure you are not confused between the two? Basically, AF in INFO gives the allele frequency across all the samples for the given variant (single value per variant), while AF in FORMAT gives the allele fraction of ALT allele for each sample for each variant (single value per variant per sample). Let me know which is what you're truly after.
from fuc.
sbslee
commented on June 5, 2024
@ketkijoshi278,
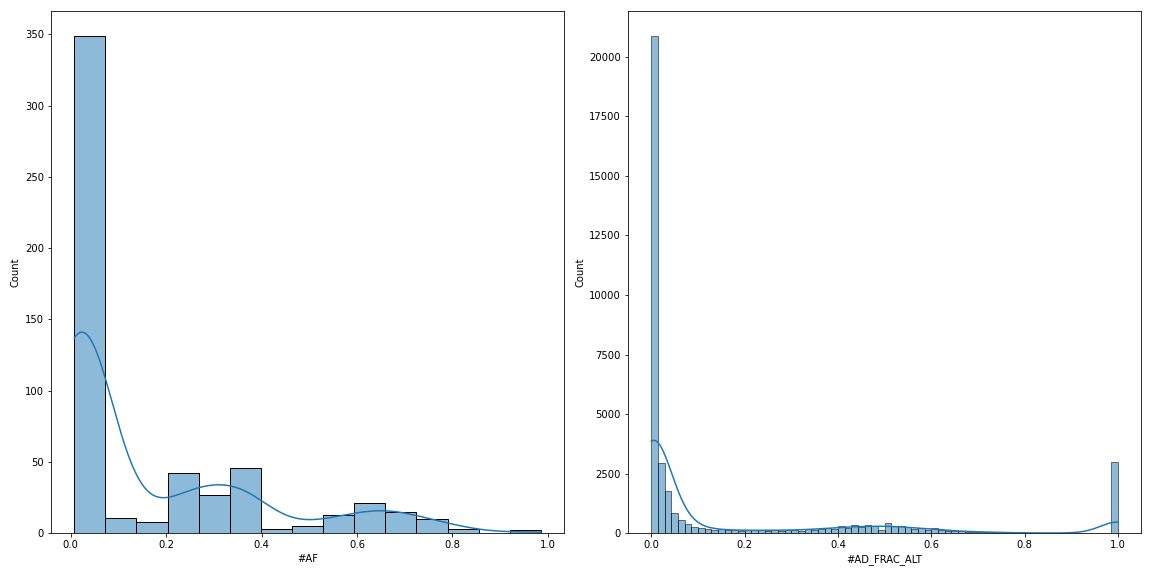
I just updated the 0.21.0-dev branch to include pyvcf.VcfFrame.plot_hist_info method, which will plot the distribution of AF across all the variants in the VCF file (left panel). I also renamed the pyvcf.VcfFrame.plot_hist method to pyvcf.VcfFrame.plot_hist_format to distinguish it from pyvcf.VcfFrame.plot_hist_info. As I wrote previously, the pyvcf.VcfFrame.plot_hist_format method will plot the distribution of ALT allele fraction across all the variants AND all the samples (right panel). Hope this helps. Let me know if you need further help.
Documentations:
pyvcf.VcfFrame.plot_hist_info
pyvcf.VcfFrame.plot_hist_format
import matplotlib.pyplot as plt
from fuc import common, pyvcf
common.load_dataset('pyvcf')
vcf_file = '~/fuc-data/pyvcf/getrm-cyp2d6-vdr.vcf'
vf = pyvcf.VcfFrame.from_file(vcf_file)
fig, [ax1, ax2] = plt.subplots(1, 2, figsize=(16, 8))
vf.plot_hist_info('#AF', ax=ax1)
vf.plot_hist_format('#AD_FRAC_ALT', ax=ax2)
plt.tight_layout()
plt.savefig('example.png')
from fuc.
Related Issues (20)
- [MAF/VCF] Add function to create rainfall plots HOT 1
- [VCF] Add function to convert missing genotypes (./.) to REF homozygous (0/0)
- [BAM] Add function to plot uniformity in read depth
- [VCF] Add function to plot summary statistics HOT 1
- [VCF] Add function to convert 23andMe data to VCF
- [VCF] How to remove all rows with the same variant in VCF file using `pyvcf` HOT 10
- [VCF] Add function to create a scatter plot of allele frequency for two datasets HOT 1
- [General] Error during installation fuc via conda HOT 2
- [VCF] Add function to compute AC/AN/AF in the INFO column HOT 1
- [VCF] Add function to remove samples with high missingness
- [General] Error while importing pyvcf HOT 2
- [VCF] Update `pyvcf.VcfFrame.filter_sampnum` to be more robust HOT 1
- [MAF] maf-oncoplt Index Error HOT 3
- [MAF/VCF] `pymaf.MafFrame.from_vcf` assumes CSQ is the first field in the INFO record HOT 3
- [VCF] Issue reading vcf from mutect2, strelka2 HOT 2
- [VCF] Question on usage HOT 7
- [MAF] Variant color coding mismatch HOT 3
- [MAF] Update Ensembl VEP consequences mapping HOT 3
- Tutorial to read in 10 vcfs and calculate allele frequency?
Recommend Projects
-
 React
React
A declarative, efficient, and flexible JavaScript library for building user interfaces.
-
Vue.js
🖖 Vue.js is a progressive, incrementally-adoptable JavaScript framework for building UI on the web.
-
 Typescript
TypeScript is a superset of JavaScript that compiles to clean JavaScript output.
-
TensorFlow
An Open Source Machine Learning Framework for Everyone
-
Django
The Web framework for perfectionists with deadlines.
-
 Laravel
A PHP framework for web artisans
-
D3
Bring data to life with SVG, Canvas and HTML. 📊📈🎉
-
Recommend Topics
-
javascript
JavaScript (JS) is a lightweight interpreted programming language with first-class functions.
-
web
Some thing interesting about web. New door for the world.
-
server
A server is a program made to process requests and deliver data to clients.
-
Machine learning
Machine learning is a way of modeling and interpreting data that allows a piece of software to respond intelligently.
-
Visualization
Some thing interesting about visualization, use data art
-
Game
Some thing interesting about game, make everyone happy.
Recommend Org
-
Facebook
We are working to build community through open source technology. NB: members must have two-factor auth.
-
Microsoft
Open source projects and samples from Microsoft.
-
Google
Google ❤️ Open Source for everyone.
-
Alibaba
Alibaba Open Source for everyone
-
D3
Data-Driven Documents codes.
-
Tencent
China tencent open source team.
from fuc.