
- Diagnosing COVID-19 using AI-based medical Image Analyses
- Introduction
- Model Training
- Evaluation metrics being used
- Model Interpretability(Grad - CAM Gradient-weighted Class Activation Mapping)
- Model Deployment
- Links
conda env create -f environment.yml
git clone https://github.com/ieee8023/covid-chestxray-dataset.git


kaggle competitions download -c rsna-pneumonia-detection-challenge
mkdir rsna

unzip rsna-pneumonia-detection-challenge.zip -d rsna/
jupyter-lab --ip=0.0.0.0
In the last few months, the novel COVID19 pandemic has spread all over the world. Effective screening of infected patients is a critical step in the fight against COVID-19. Due to its easy transmission, developing techniques to accurately and easily identify the presence of COVID19 and distinguish it from other forms of flu and pneumonia is crucial. One of the key screening approaches is radiological imaging using chest radiography. Recent research has shown that the chest X-rays of patients suffering from COVID19 depicts certain abnormalities in the radiography.
Chest X-ray is the most common imaging study for patients with respiratory complaints. In the early stages of COVID-19, a chest X-ray may be read as normal. But in patients with severe disease, their X-ray readings may resemble pneumonia or acute respiratory distress syndrome.
CT scan of the chest is a specialized type of imaging study which uses X-rays to create 3D images of the chest. Chest CT is more effective than chest X-ray in the detection of early COVID-19 disease. 50% of patients may have a normal chest CT within the first two days after the onset of symptoms. Suspicious findings on chest CT are a valuable clue that a patient may have COVID-19.
The severity of COVID-19 varies significantly from person to person. Chest CT may also be used as an initial tool to assess disease severity, as well as to monitor for progression or resolution of disease

For any model, be it deep learning or machine learning model, sufficient amount of correctly labelled data is required. Balanced amount of data needs to be used for training the model, otherwise it will introduce unwanted bias in the model. That is, the amount of data for all types of labeled data should be in proper proportion such that it does not introduce a bias for a class. As in this problem statement, getting enough labeled data for the chest x-rays is difficult so we will be combining the datasets from multiple sources (as per the availability)
- https://github.com/ieee8023/covid-chestxray-dataset
- https://www.kaggle.com/c/rsna-pneumonia-detection-challenge (which came from: https://nihcc.app.box.com/v/ChestXray-NIHCC)
As data will be coming from multiple sources, the format of data may differ, hence we will be transforming all the data using some preprocessing and augmentation so that model will get a generalized format for further feature extraction. The context of this problem statement is Medical Imaging so some of the data can be in DICOM(Digital Imaging and Communications in Medicine) format or any other image file format (for eg: jpg). Following is the idea for preprocessing the available data:
- Take only required labeled images and their respective metadata. As all types of data is available like COVID-19, SARS, Bacterial Pneumonia, MERS, etc.
- Convert the DICOM data into jpg format using the Pydicom library.
- We can clean the x-ray images to remove any textual information printed on them.
- Resize the image as required by the input layer of Neural Network (for eg 224 X 224).
Another way to mitigate data deficiency is data augmentation: from the limited training data, creating new image-label pairs and adding the synthesized pairs into the training set. Color Jitter, Scaling, Flip, Rotations and other affine transformations are typical. This makes the neural network exposed to a wide variety of variations and less likely to recognize unwanted characteristics in the data-set.
Data set preparation
| COVID19 | Normal | Pneumonia | TOTAL | |
| Train | 114 | 405 | 423 | 942 |
| Validation | 13 | 45 | 47 | 105 |
To train a binary classification model for predicting whether an X-ray image is COVID or non-COVID, we collect 405 X Ray that are negative for COVID means Normal patient X-ray and 114 which are positive for covid19 and 423 pneumonia patient X-ray. We split the dataset into a train, validation,.
Table summarizes the number of COVID and Normal images in each set. All images are resized to 224x224. The hyperparameters are tuned on the validation set. The weight parameters in the networks were optimized using Adam. We evaluate our method using five metrics: (1) Accuracy; (2) Precision; (3) Recall; (4) F1 score; (5) Area under ROC curve (AUC).
Our dataset is an imbalance dataset, meaning the number of x-ray images in the training dataset for each class label is not balanced. Imbalanced classification refers to a classification predictive modeling problem where the number of examples in the training dataset for each class label is not balanced. That is, where the class distribution is not equal or close to equal, and is instead biased or skewed.
We are using the ResNet-50 architecture based image recognition system. We loaded the pre-trained imagenet weights with a classifier with 1000 classes and then changed the classifier layers to 3 classes (Normal, Covid19, Pneumonia). It's usually called Transfer Learning.
Transfer learning is a machine learning technique where a model trained on one task is re-purposed on a second related task.
Train the model against our dataset for 1000 epoch using Adam Optimizer with 0.003 learning rate.

I'll discuss common metrics used to evaluate models.
Classification metrics
When performing classification predictions, there's four types of outcomes that could occur.
True positives are when you predict an observation belongs to a class and it actually does belong to that class.
True negatives are when you predict an observation does not belong to a class and it actually does not belong to that class.
False positives occur when you predict an observation belongs to a class when in reality it does not.
**False negatives **occur when you predict an observation does not belong to a class when in fact it does.
These four outcomes are often plotted on a confusion matrix.

The three main metrics used to evaluate a classification model are accuracy, precision, and recall.

ROC stands for receiver operating characteristic and the graph is plotted against True Positive Rate (TPR) and False Positive Rate (FPR) for various threshold values. As TPR increases FPR also increases.

Why to stop at what the prediction is when we can actually get to know why it is predicted so.
Grad-CAM visualizes the regions of input that are "important" for predictions from the CNN models. This is a generalization of CAM - Class activation Mapping approach which uses the feature maps preceding the softmax layer of the neural network. So it is applicable to only the CNN architectures that perform global average pooling over convolutional maps immediately before prediction (i.e conv feature maps → global average pooling → softmax layer). To overcome this limitation a generalized approach is proposed i.e Grad-CAM Gradient weighted class activation mapping which uses the class-specific gradient information flowing into the final convolutional layer of a CNN to produce a coarse localization map of the important regions in the image. It thus understands each neuron for a decision of interest and hence is applicable for any kind of neural network architecture. Using model Interpretability we will be able to figure out why the predictions went wrong.

Following is the example where the image is colored for highlighting the regions which made the neural network to classify into its predicted class

We can have two modes of deployment viz.
- Online mode
- Offline Mode
Once model trained then we are going to deploy it into a server with Python based Flask web framework. Flask is a Python library that makes it easy to set up Python functions that can be invoked via the web. It uses annotations to provide metadata about which functions to set up at which endpoints.
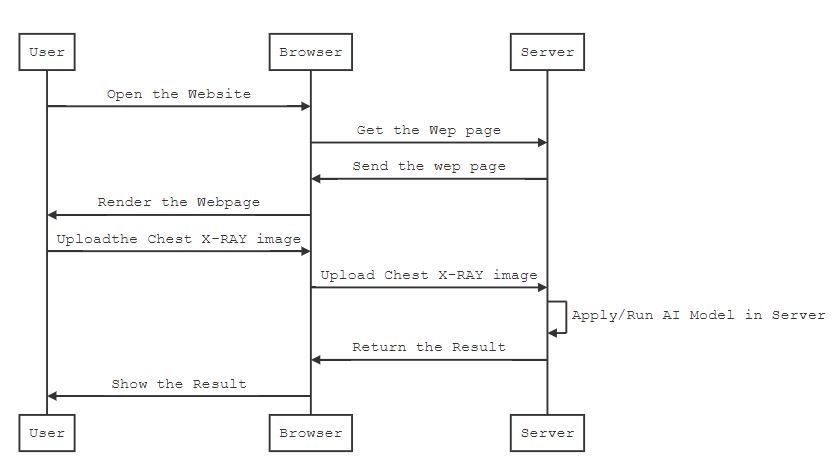
Once the user submits the chest x-ray image via browser, it's sent back to Flask REST endpoint running on the server. Server classifies the image and sends a response back to the client.
Here a single server handles all clients' queries. So It should have high end GPU based machine
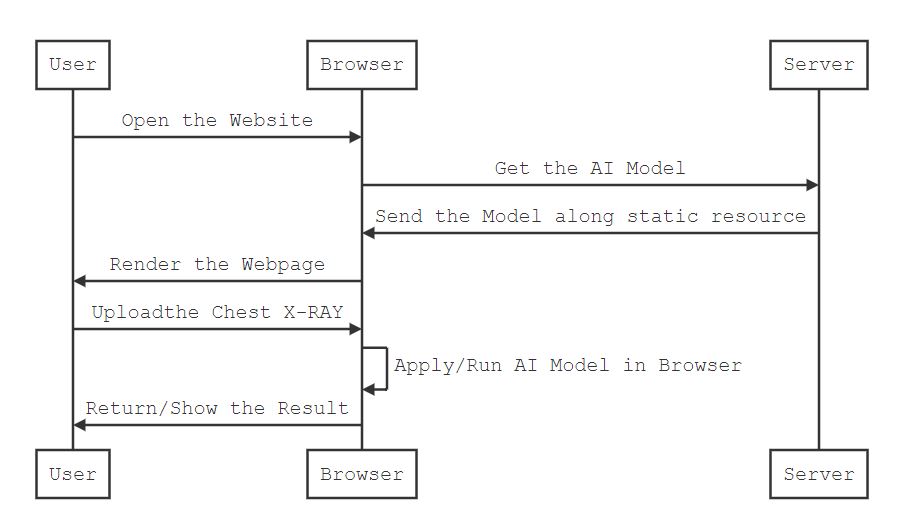
Another way is more privacy oriented to move the model from server to client itself. So We need to convert the python based model to a JavaScript based ONNX model.
In December 2017, Amazon, Facebook and Microsoft announced the collaborative initiative of making Open Neural Network Exchange (ONNX) format production ready. ONNX is available now to support many top frameworks and runtimes including Caffe2, MATLAB, Microsoft’s Cognitive Toolkit, Apache MXNet, PyTorch and NVIDIA’s TensorRT. There is also an early-stage converter from Tensor Flow and CoreML to ONNX that can be used today.
In November 2018, ONNX.js was released. ONNX.js is an open source JavaScript library for running ONNX models on browsers and on Node.js. You can use it to score pre-trained ONNX models directly on the browser. ONNX.js is also the first solution to utilize multi-threading in a JavaScript-based AI inference engine (via Web Workers), which offers significant performance improvements over any existing solution on CPU.
Convert our Python DL model to ONNX model and deploy into the browser. Now all queries are inferred in the browser itself. Server not playing any role other than serve html pages to client
Advantages for Offline mode : -
Privacy : If the ML/DL model is dealing with sensitive and private data and you do not want to send the data to a server for inference.
Low Latency : Having the model directly on the client side reduces the client-server communication overhead.
**Cross-Platform : **It doesn’t matter what operating system you are using because it will work on the browser. There is also no need to install any libraries.
We wrap the entire browser based JavaScript code into a Progressive Web Apps (PWA) app.
Progressive Web Apps (PWA) are hybrid web pages which can be downloaded to your device just like a native App and are designed to mimic native App user experiences.
Once a user installs or adds to their Home Page, PWA’s behave just like APPs. Slow connections are an everyday problem for many and result in frustrating user experiences. PWA’s are a great solution thanks to faster loading speeds and since they can even work while offline.

