Coder Social home page Coder Social logo

romainquidet / openmaptiles Goto Github PK

View Code? Open in Web Editor NEW

This project forked from openmaptiles/openmaptiles

11.0 2.0 4.0 16.05 MB

Contours vector tiles generation thanks to OpenMapTiles toolchain

Home Page: http://openmaptiles.org

License: Other

Makefile 6.22% SQLPL 0.99% PLpgSQL 75.49% Shell 13.94% Python 2.39% TSQL 0.97%
mapbox-vector-tile vector-tiles elevation phyghtmap osm topography topo

openmaptiles's Introduction

OpenContourMapTiles

OpenContourMapTiles is a small fork of openmaptiles.org to generate in one command line elevation contours vector tiles thanks to phyghtmap tool.

Read the OpenMapTiles doc to get used about their toolchain, how to install, use it etc.

Develop

To create contours tiles you need Docker.

I work with OSX, I have no issues with it. Linux user will also feel good.

If you are here you already know git and have cloned this repo!

Register

You'll need to register to https://ers.cr.usgs.gov/register/ in order to allow phyghtmap to download elevation data. It's free.

Once you have your user and login, create a file named .earthexplorerCredentials in the root directory of the repo with the content:

USER=your_user_name
PASSWORD=your_password

Build

Build the tileset in one command line

First you can edit the .env file to change the zoom levels that will be created. 0-14 is the max.

Then use the quickstart script helper

./quickstart.sh france

This will generate a new elevation mbtiles set of all France area... Quite long!

Try first with a small area.

Results

You'll end up if everything works with a file tiles.mbtiles in data directory.

This file contains all vectors tiles with contour layer over your selected area.

Contours lines step is configured to 10m.

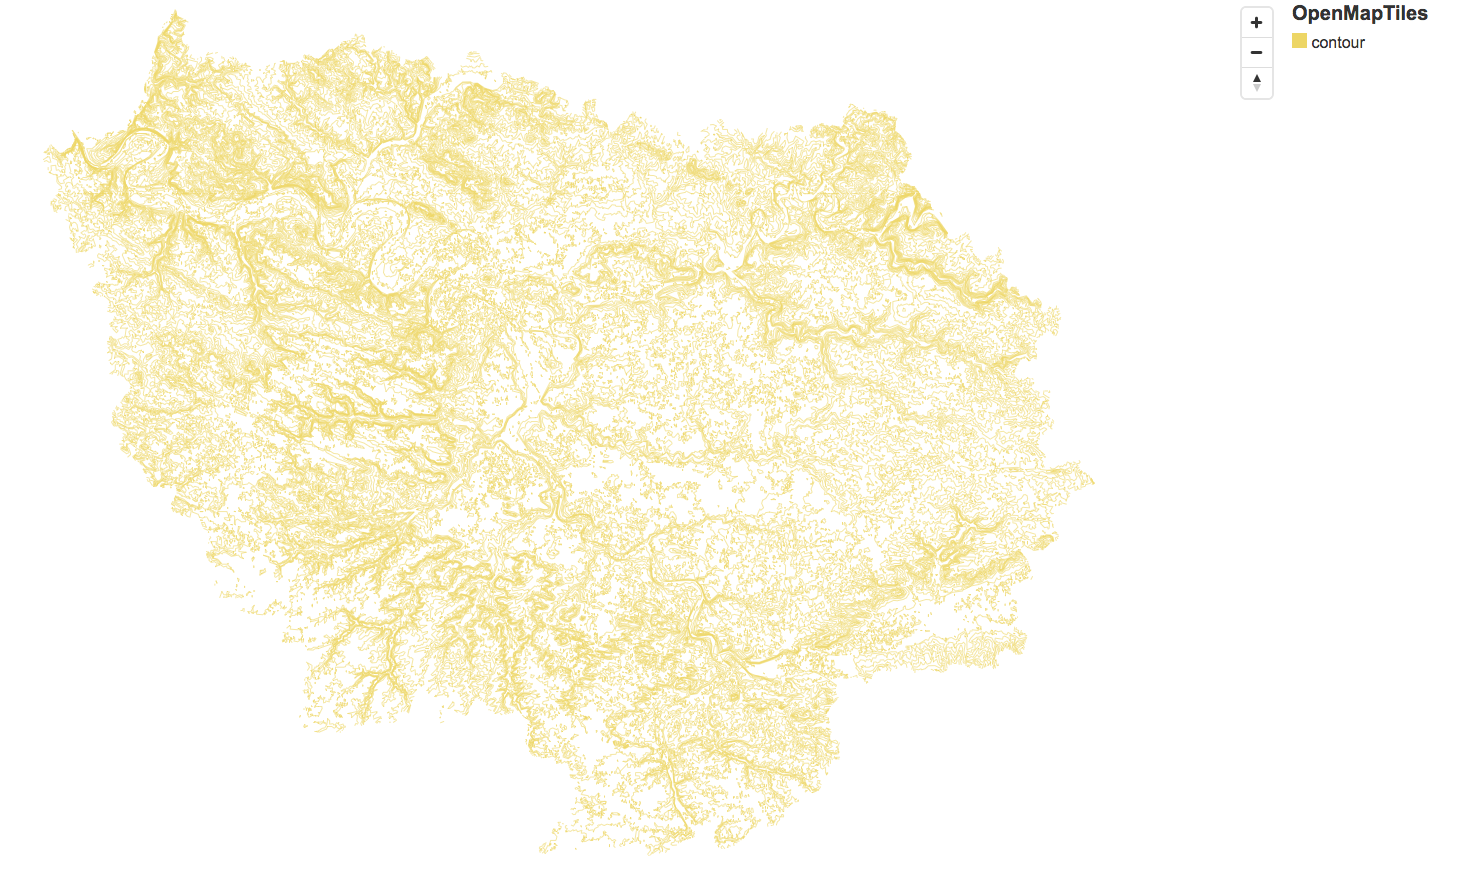
Ex: I ran it with "ile-de-france", the area around Paris, France.

Launch a tile server locally to test your data

make start-tileserver

and check at http://127.0.0.1:8080/ the raw result (click on inspect link on DATA section)

Result: alt text

Ile-de-france build took around 5 min, while French Alps area required around 40 min on my old 2013 iMac.

TODO

Once you've got your tiles, you'll need to create a mapbox sytle to serve them from a mapbox tile server.

The content of the tiles is quite simple:

  • Only line strings id "contour"

  • One key "ele" for the elevation in meters

I'll try to create a nice style json to be ready to use.

License

All code in this repository is under the BSD license and the cartography decisions encoded in the schema and SQL are licensed under CC-BY.

For a browsable electronic map based on OpenMapTiles and OpenStreetMap data, the credit should appear in the corner of the map. For example:

© OpenMapTiles © OpenStreetMap contributors

For printed and static maps a similar attribution should be made in a textual description near the image, in the same fashion as if you cite a photograph.

openmaptiles's People

Contributors

lukasmartinelli avatar jirik avatar imresamu avatar stirringhalo avatar martinmikita avatar romainquidet avatar smellman avatar antoine-de avatar klokan avatar edpop avatar batisteo avatar muesliq avatar hfu avatar claustres avatar mathieudebrito avatar pnorman avatar laidig avatar lincomatic avatar nlehuby avatar

Stargazers

 avatar cavok avatar Chu avatar Hugo Heneault avatar Timothy G. avatar Ludovic Delauné avatar Thomas J. Fox avatar Maxime B avatar  avatar Skylar Ittner avatar Sharptooth avatar

Watchers

James Cloos avatar  avatar

Recommend Projects

  • React photo React

    A declarative, efficient, and flexible JavaScript library for building user interfaces.

  • Vue.js photo Vue.js

    🖖 Vue.js is a progressive, incrementally-adoptable JavaScript framework for building UI on the web.

  • Typescript photo Typescript

    TypeScript is a superset of JavaScript that compiles to clean JavaScript output.

  • TensorFlow photo TensorFlow

    An Open Source Machine Learning Framework for Everyone

  • Django photo Django

    The Web framework for perfectionists with deadlines.

  • D3 photo D3

    Bring data to life with SVG, Canvas and HTML. 📊📈🎉

Recommend Topics

  • javascript

    JavaScript (JS) is a lightweight interpreted programming language with first-class functions.

  • web

    Some thing interesting about web. New door for the world.

  • server

    A server is a program made to process requests and deliver data to clients.

  • Machine learning

    Machine learning is a way of modeling and interpreting data that allows a piece of software to respond intelligently.

  • Game

    Some thing interesting about game, make everyone happy.

Recommend Org

  • Facebook photo Facebook

    We are working to build community through open source technology. NB: members must have two-factor auth.

  • Microsoft photo Microsoft

    Open source projects and samples from Microsoft.

  • Google photo Google

    Google ❤️ Open Source for everyone.

  • D3 photo D3

    Data-Driven Documents codes.