
- Jayavarapu Surya Abhinai
- Sushree Shivani Sethi
- Aakarsh Bansal
- Raajan
- Tejas S
- Shriya Sheri
The project aims to build yolo architecture to detect objects
- Numpy
- Pandas
- Pytorch
- Matplotlib
- OpenCv
Yolo is a state-of-the-art, object detection algorithm. It was developed by Joseph Redmon. The biggest advantage over other architectures is that speed without much compramising in accuracy. The Yolo model family models are really fast, much faster than R-CNN and others.In this article we will go through the third version of yolo yolov3 its architecture, how it works and its implementation in pytorch.

For network input (416, 416),
For 82nd layer the stride is 32 and the output size is 52x52 and it is responsible to detect large objects
For 94th layer the stride is 16 and the output size is 26x26 and it is responsible to detect medium objects
For 106th layer the stride is 8 and the output size is 13x13 and it is responsible to detect small objects
This is the reason why the network input must be divisible by 32, because if it is divisible by 32 then it is also divisible by 16 and 8 as well.
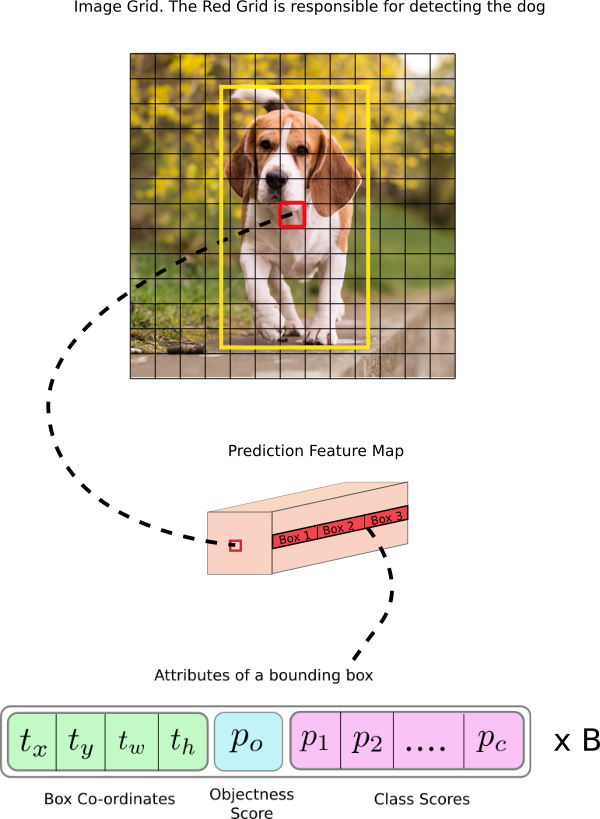
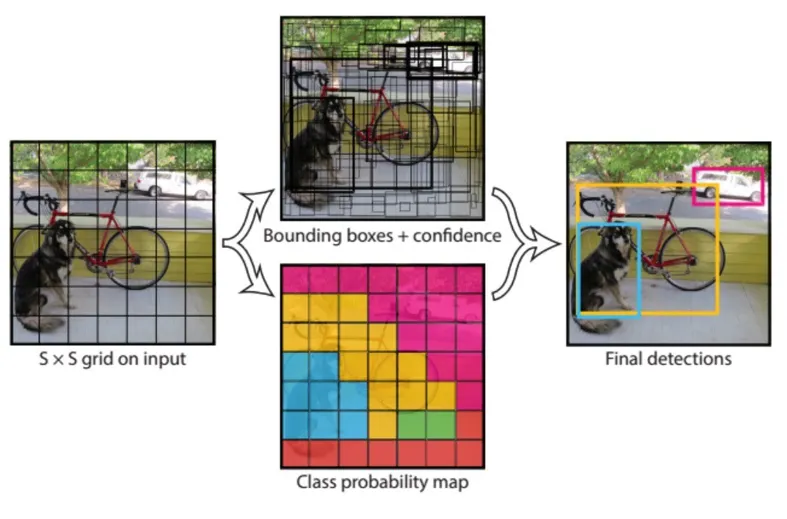
The YOLO (You Only Look Once) object detection algorithm does not use the sliding window approach, as it splits the image into a grid of cells of a certain size. Each cell is responsible for predicting different aspects of an object, such as its class label and the coordinates of its bounding box.
Unlike other object detectors, YOLO uses a convolutional layer with 1x1 convolutions to make these predictions. The output is a feature map, where each cell predicts a set of values, including the probability of an object being present and the coordinates of its bounding box. If there is no object in a cell, the confidence value should be low.
For the COCO dataset, which contains 80 classes, each cell predicts 85 values. YOLO also uses anchor boxes to predict bounding boxes, which are pre-defined shapes associated with two predictions. K-means clustering is used to calculate anchors on the COCO dataset.
In YOLOv3, three bounding boxes are predicted for each cell, with each bounding box having 5 + C attributes, including its center coordinates, dimensions, bounding box probability score, and class probability for each bounding box. Therefore, there are (B x (5 + C)) entries in the feature map, where B represents the number of bounding boxes per cell.
While it might seem logical to predict the width and height of bounding boxes, this can result in unstable gradients during training. To avoid this, modern object detectors often predict log-space transforms or offsets to pre-defined default bounding boxes, known as anchors.
These transforms are applied to the anchor boxes to obtain the final prediction. In YOLO v3, there are three anchors, which means that three bounding boxes are predicted per cell. The width and height of anchors,
For, Scale 1: (116x90), (156x198), (373x326)
Scale 2: (30x61), (62x45), (59x119)
Scale 3: (10x13), (16x30), (33x23)
The reason why the center coordinate prediction in YOLO is passed through a sigmoid function is to constrain the output to a range between 0 and 1. This is necessary because YOLO predicts the offsets relative to the top left corner of the grid cell that is detecting the object. The actual center coordinate of the object can then be calculated by adding these offsets to the coordinates of the top left corner of the cell.
For example, consider the case of our dog image. If the prediction for center is (0.4, 0.7), then this means that the center lies at (6.4, 6.7) on the 13 x 13 feature map. (Since the top-left co-ordinates of the red cell are (6,6)).But wait, what happens if the predicted x,y co-ordinates are greater than one, say (1.2, 0.7). This means center lies at (7.2, 6.7). Notice the center now lies in cell just right to our red cell, or the 8th cell in the 7th row. This breaks theory behind YOLO because if we postulate that the red box is responsible for predicting the dog, the center of the dog must lie in the red cell, and not in the one beside it.
Without the sigmoid function, the predicted center coordinates could fall outside the range of the cell, which would be contrary to the concept of YOLO. By using the sigmoid function, the center coordinate predictions are forced to lie within the range of the cell.
Similarly, the dimensions of the bounding box are predicted by applying a log space transform to the output and multiplying it by an anchor. The resulting predictions are then normalized by the height and width of the anchors. This ensures that the predicted dimensions are scaled relative to the size of the anchor and can be used to accurately define the size of the bounding box.
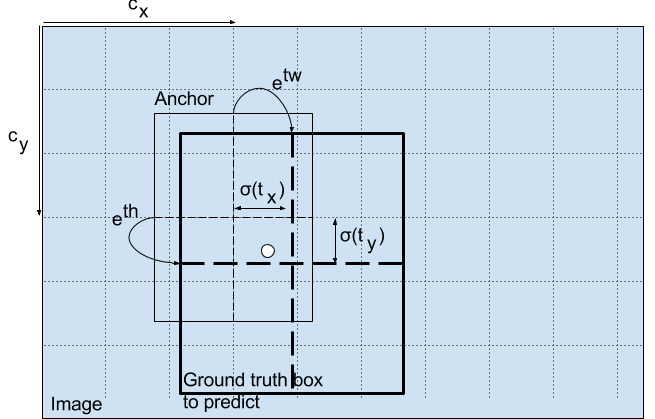
The resultant predictions, bw and bh, are normalised by the height and width of the image. (Training labels are chosen this way). So, if the predictions bx and by for the box containing the dog are (0.3, 0.8), then the actual width and height on 13 x 13 feature map is (13 x 0.3, 13 x 0.8).
Object score represents the probability that an object is contained inside a bounding box. It should be nearly 1 for the red and the neighboring grids, whereas almost 0 for, say, the grid at the corners.
The objectness score is also passed through a sigmoid, as it is to be interpreted as a probability.
n YOLO v3, class confidences are represented by probabilities of the detected object belonging to a particular class, such as dog, cat, banana, car, etc. Unlike earlier versions, which used softmax to calculate the class scores, YOLO v3 uses a sigmoid activation function instead.
The reason for this change is that softmax assumes that the classes are mutually exclusive, meaning that an object can only belong to one class and cannot belong to another. However, in some cases, such as when distinguishing between "women" and "person," this assumption may not hold true.
By using a sigmoid activation function, YOLO v3 allows for the possibility that an object may belong to multiple classes simultaneously, which can be useful in some cases. Overall, this change in the design of the class confidence predictions helps to improve the accuracy and flexibility of the YOLO v3 object detection system.
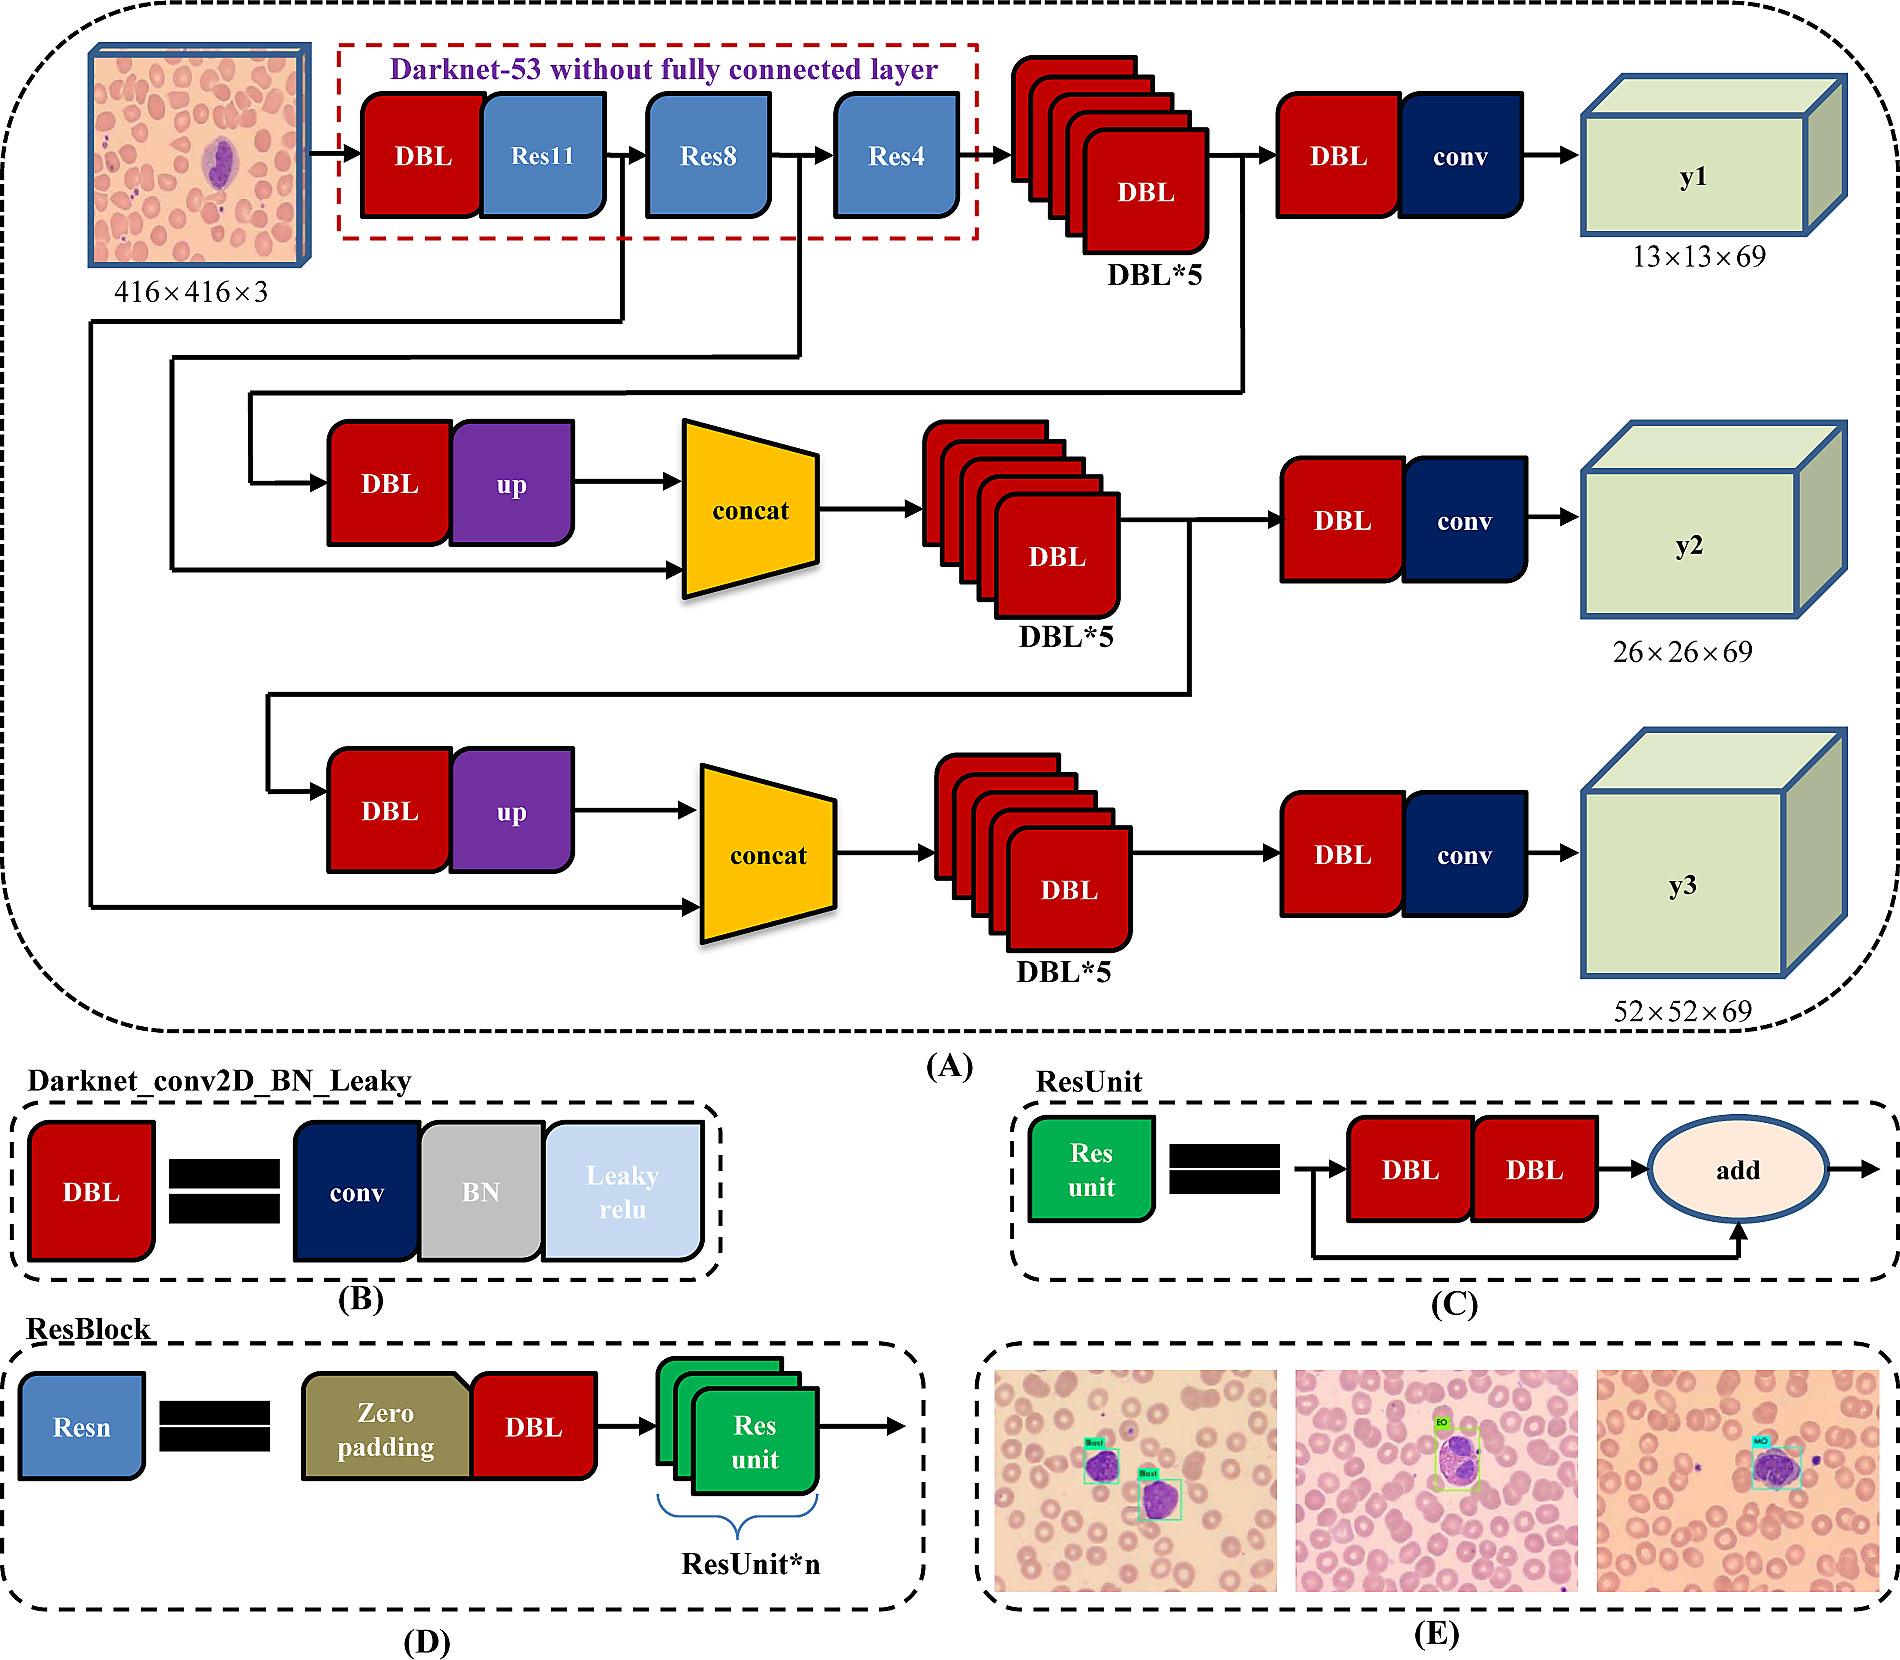
In one pass we can go from an input image to the output tensor which corresponds to the detections for the image. Also, it is worth mentioning that YOLOv3 predicts boxes at 3 different scales.In the above figure it is represented by y1,y2 and y3.
Using the COCO dataset, YOLOv3 predicts 80 different classes. YOLO outputs bounding boxes and class prediction as well. If we split an image into a 13 x 13 grid of cells and use 3 anchors box, the total output prediction is 13 x 13 x 3 or 169 x 3. However, YOLOv3 uses 3 different prediction scales which splits an image into (13 x 13), (26 x 26) and (52 x 52) grid of cells and with 3 anchors for each scale. So, the total output prediction will be((52 x 52) + (26 x 26) + 13 x 13)) x 3 = 10647 bounding boxes.
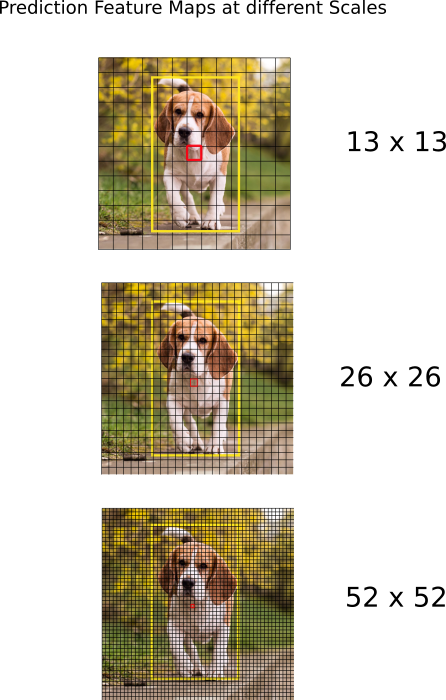
At each scale, each cell predicts 3 bounding boxes using 3 anchors, making the total number of anchors used 9. (The anchors are different for different scales)
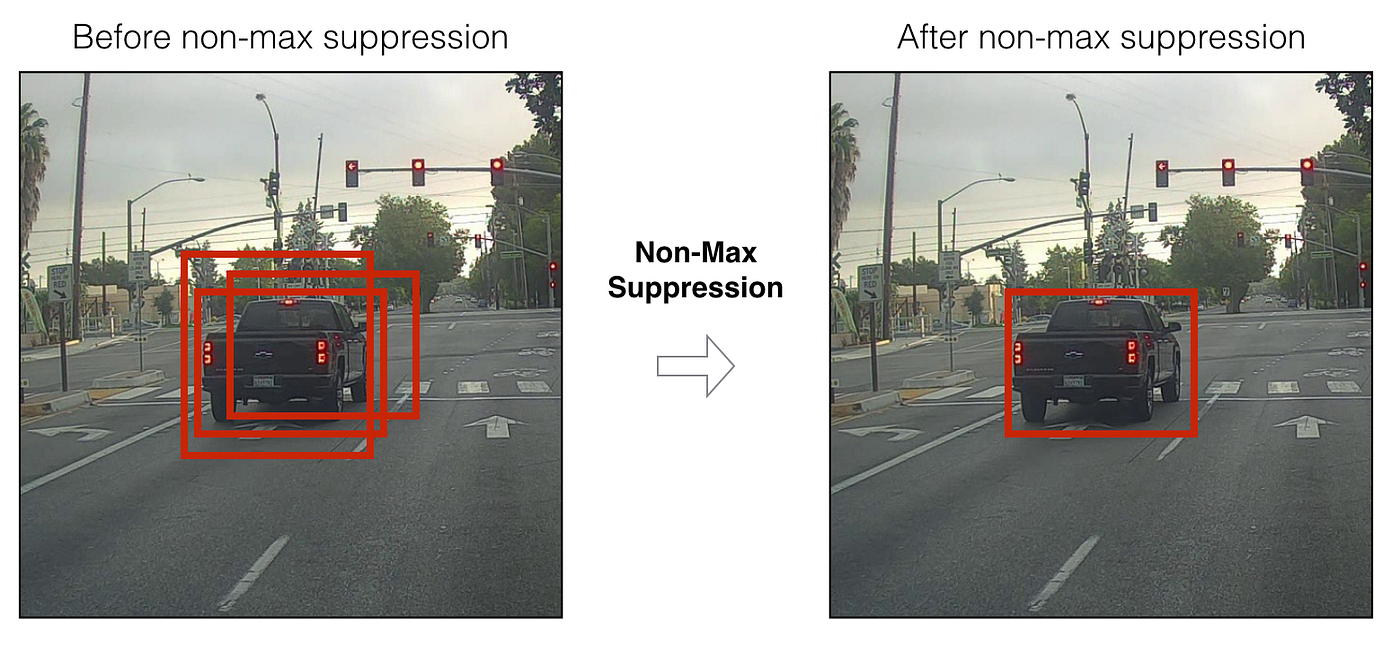
First, we filter boxes based on their objectness score. Generally, boxes having scores below a threshold are ignored.
Suppose N is the threshold and we have two lists A and B.Then for each class detected in image,
- Select the proposal with highest confidence score, remove it from A and add it to the final proposal list B. (Initially B is empty).
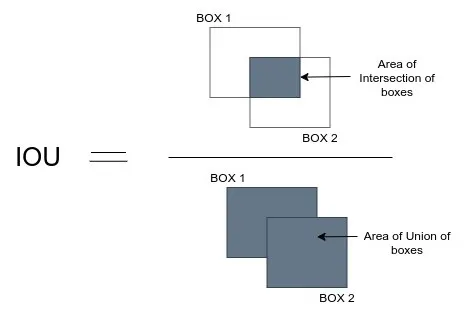
- Now compare this proposal with all the proposals by calculating the IOU (Intersection over Union) of this proposal with every other proposal. If the IOU is greater than the threshold N, remove that proposal from A.
- Again take the proposal with the highest confidence from the remaining proposals in A and remove it from A and add it to B.
- Once again calculate the IOU of this proposal with all the proposals in A and eliminate the boxes which have high IOU than threshold.
- This process is repeated until there are no more proposals left in A.
YOLO can only detect objects belonging to the classes present in the dataset used to train the network. We will be using the official weight file for our detector. These weights have been obtained by training the network on COCO dataset, and therefore we can detect 80 object categories.
https://github.com/ayooshkathuria/pytorch-yolo-v3/blob/master/util.py
https://www.ijeat.org/wp-content/uploads/papers/v8i3S/C11240283S19.pdf
http://dspace.srmist.edu.in/jspui/bitstream/123456789/34874/1/P9689.pdf


