![]()
The aleatory (/ˈeɪliətəri/) Python library provides functionality for simulating and visualising
stochastic processes. More precisely, it introduces objects representing a number of continuous-time
stochastic processes
- generate realizations/trajectories from each process —over discrete time sets
- create visualisations to illustrate the processes properties and behaviour
Currently, aleatory supports the following processes:
- Brownian Motion
- Brownian Bridge
- Brownian Excursion
- Brownian Meander
- Geometric Brownian Motion
- Ornstein–Uhlenbeck
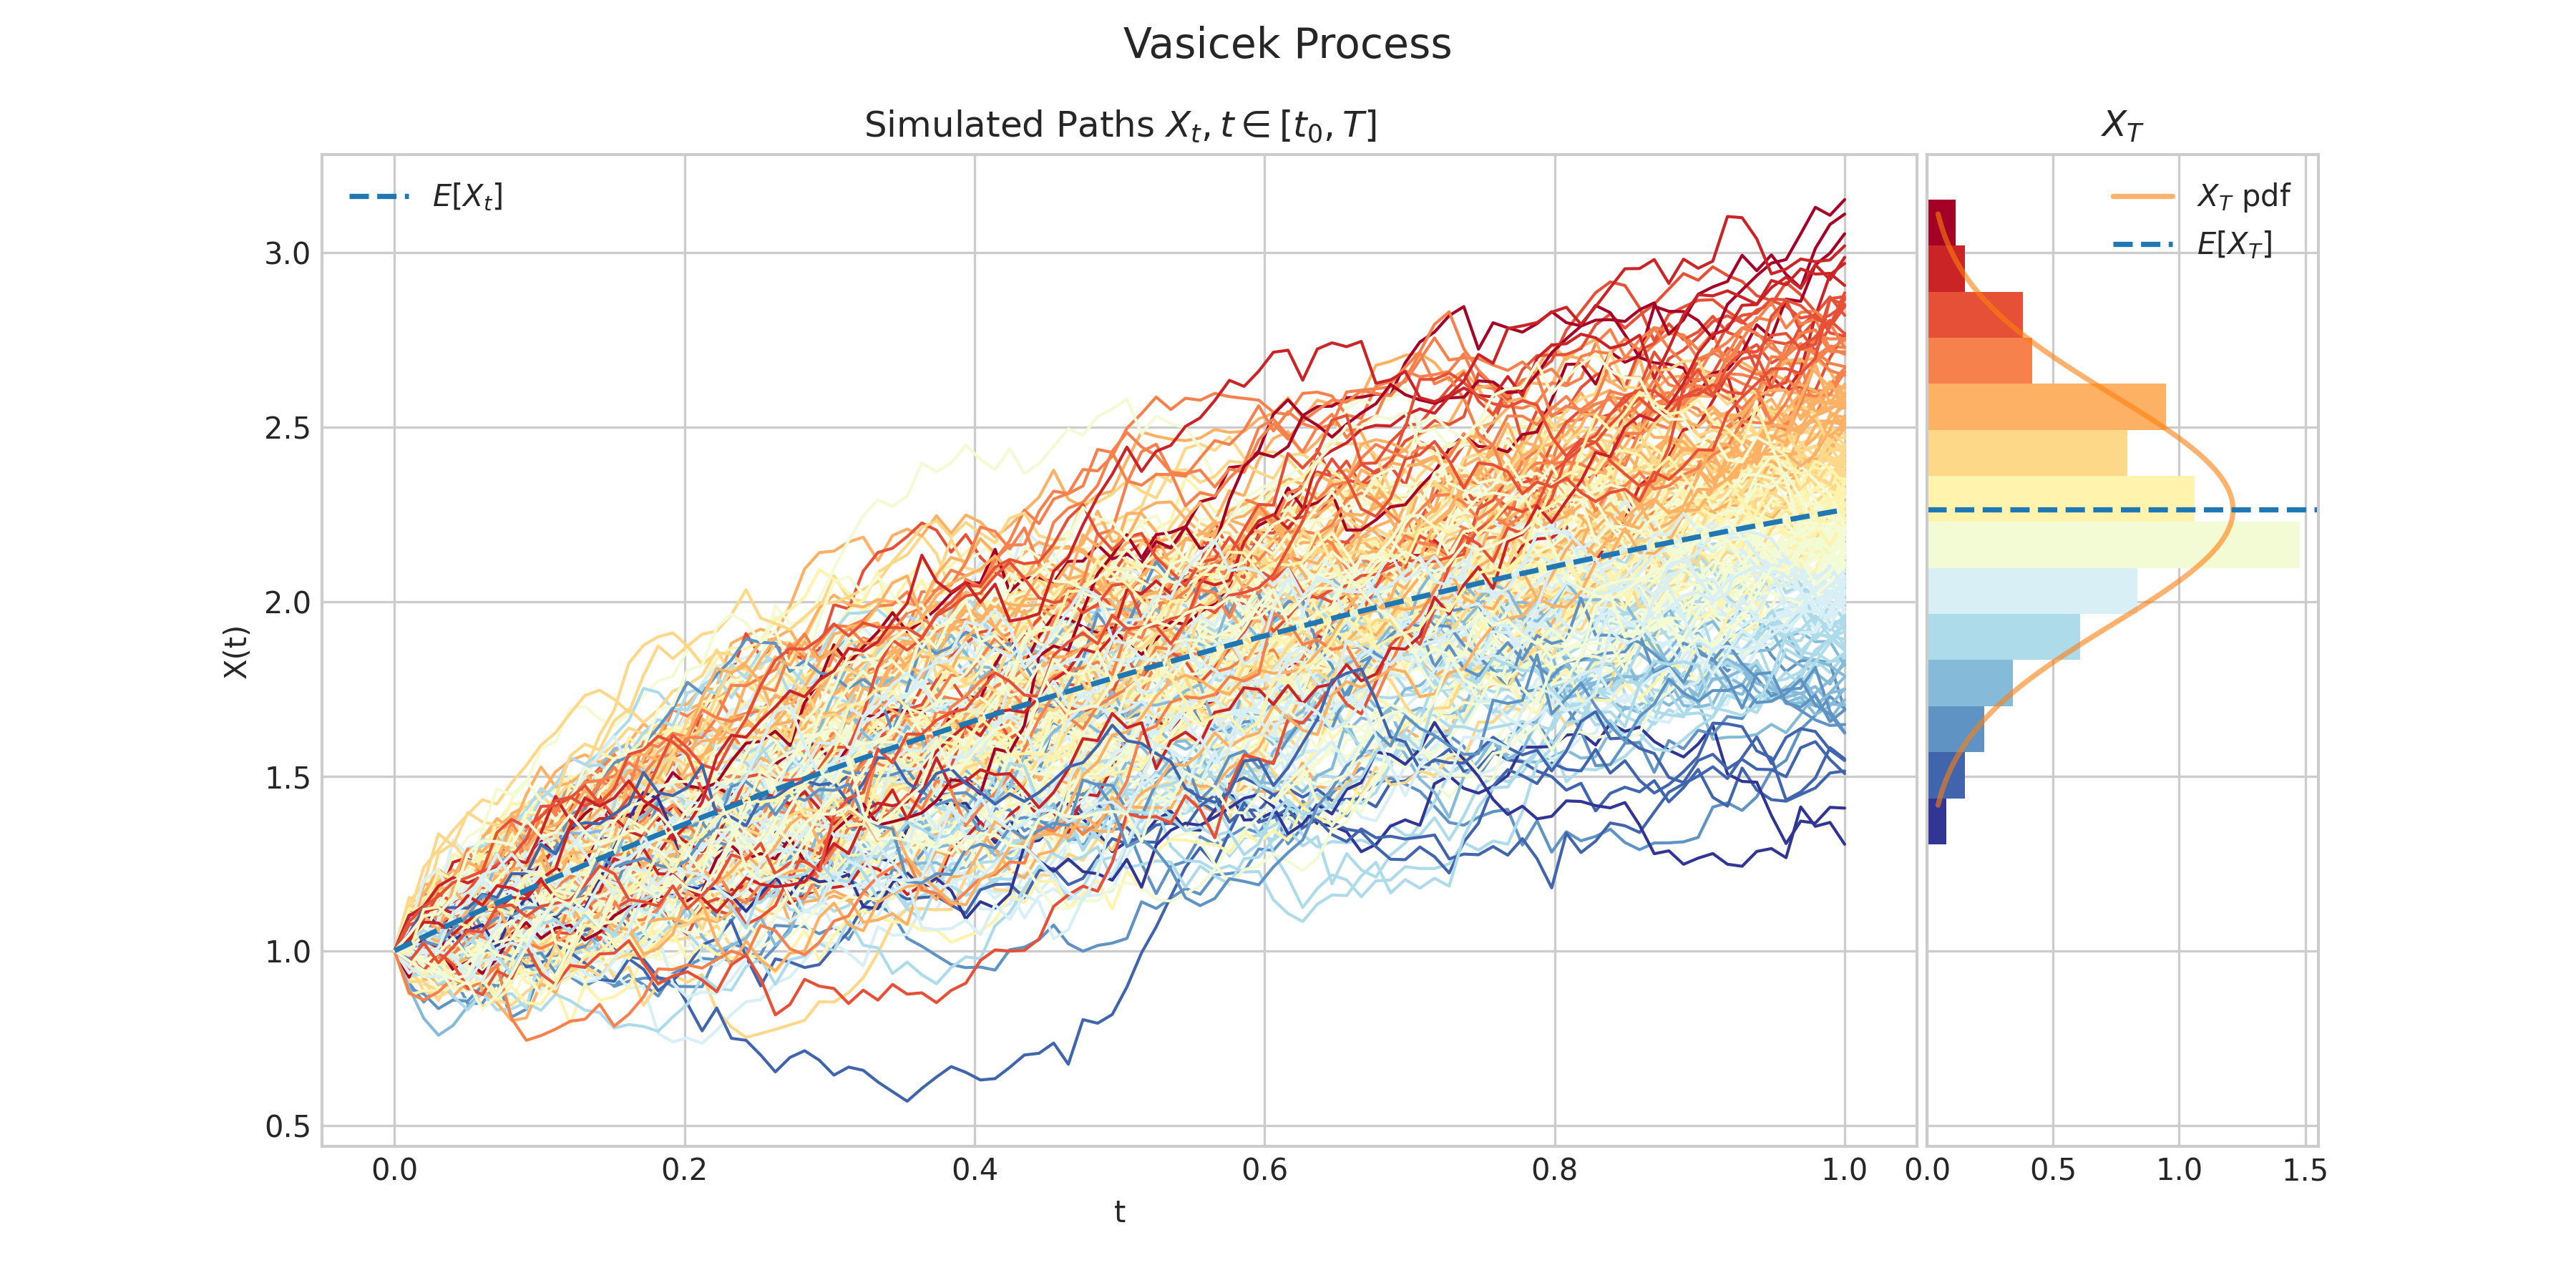
- Vasicek
- Cox–Ingersoll–Ross
- Constant Elasticity
- Bessel Process
- Squared Bessel Processs
Aleatory is available on pypi and can be installed as follows
pip install aleatory
Aleatory relies heavily on
numpyfor random number generationscipyandstatsmodelsfor support for a number of one-dimensional distributions.matplotlibfor creating visualisations
Aleatory is tested on Python versions 3.8, 3.9, 3.10, and 3.11
Aleatory allows you to create fancy visualisations from different stochastic processes in an easy and concise way.
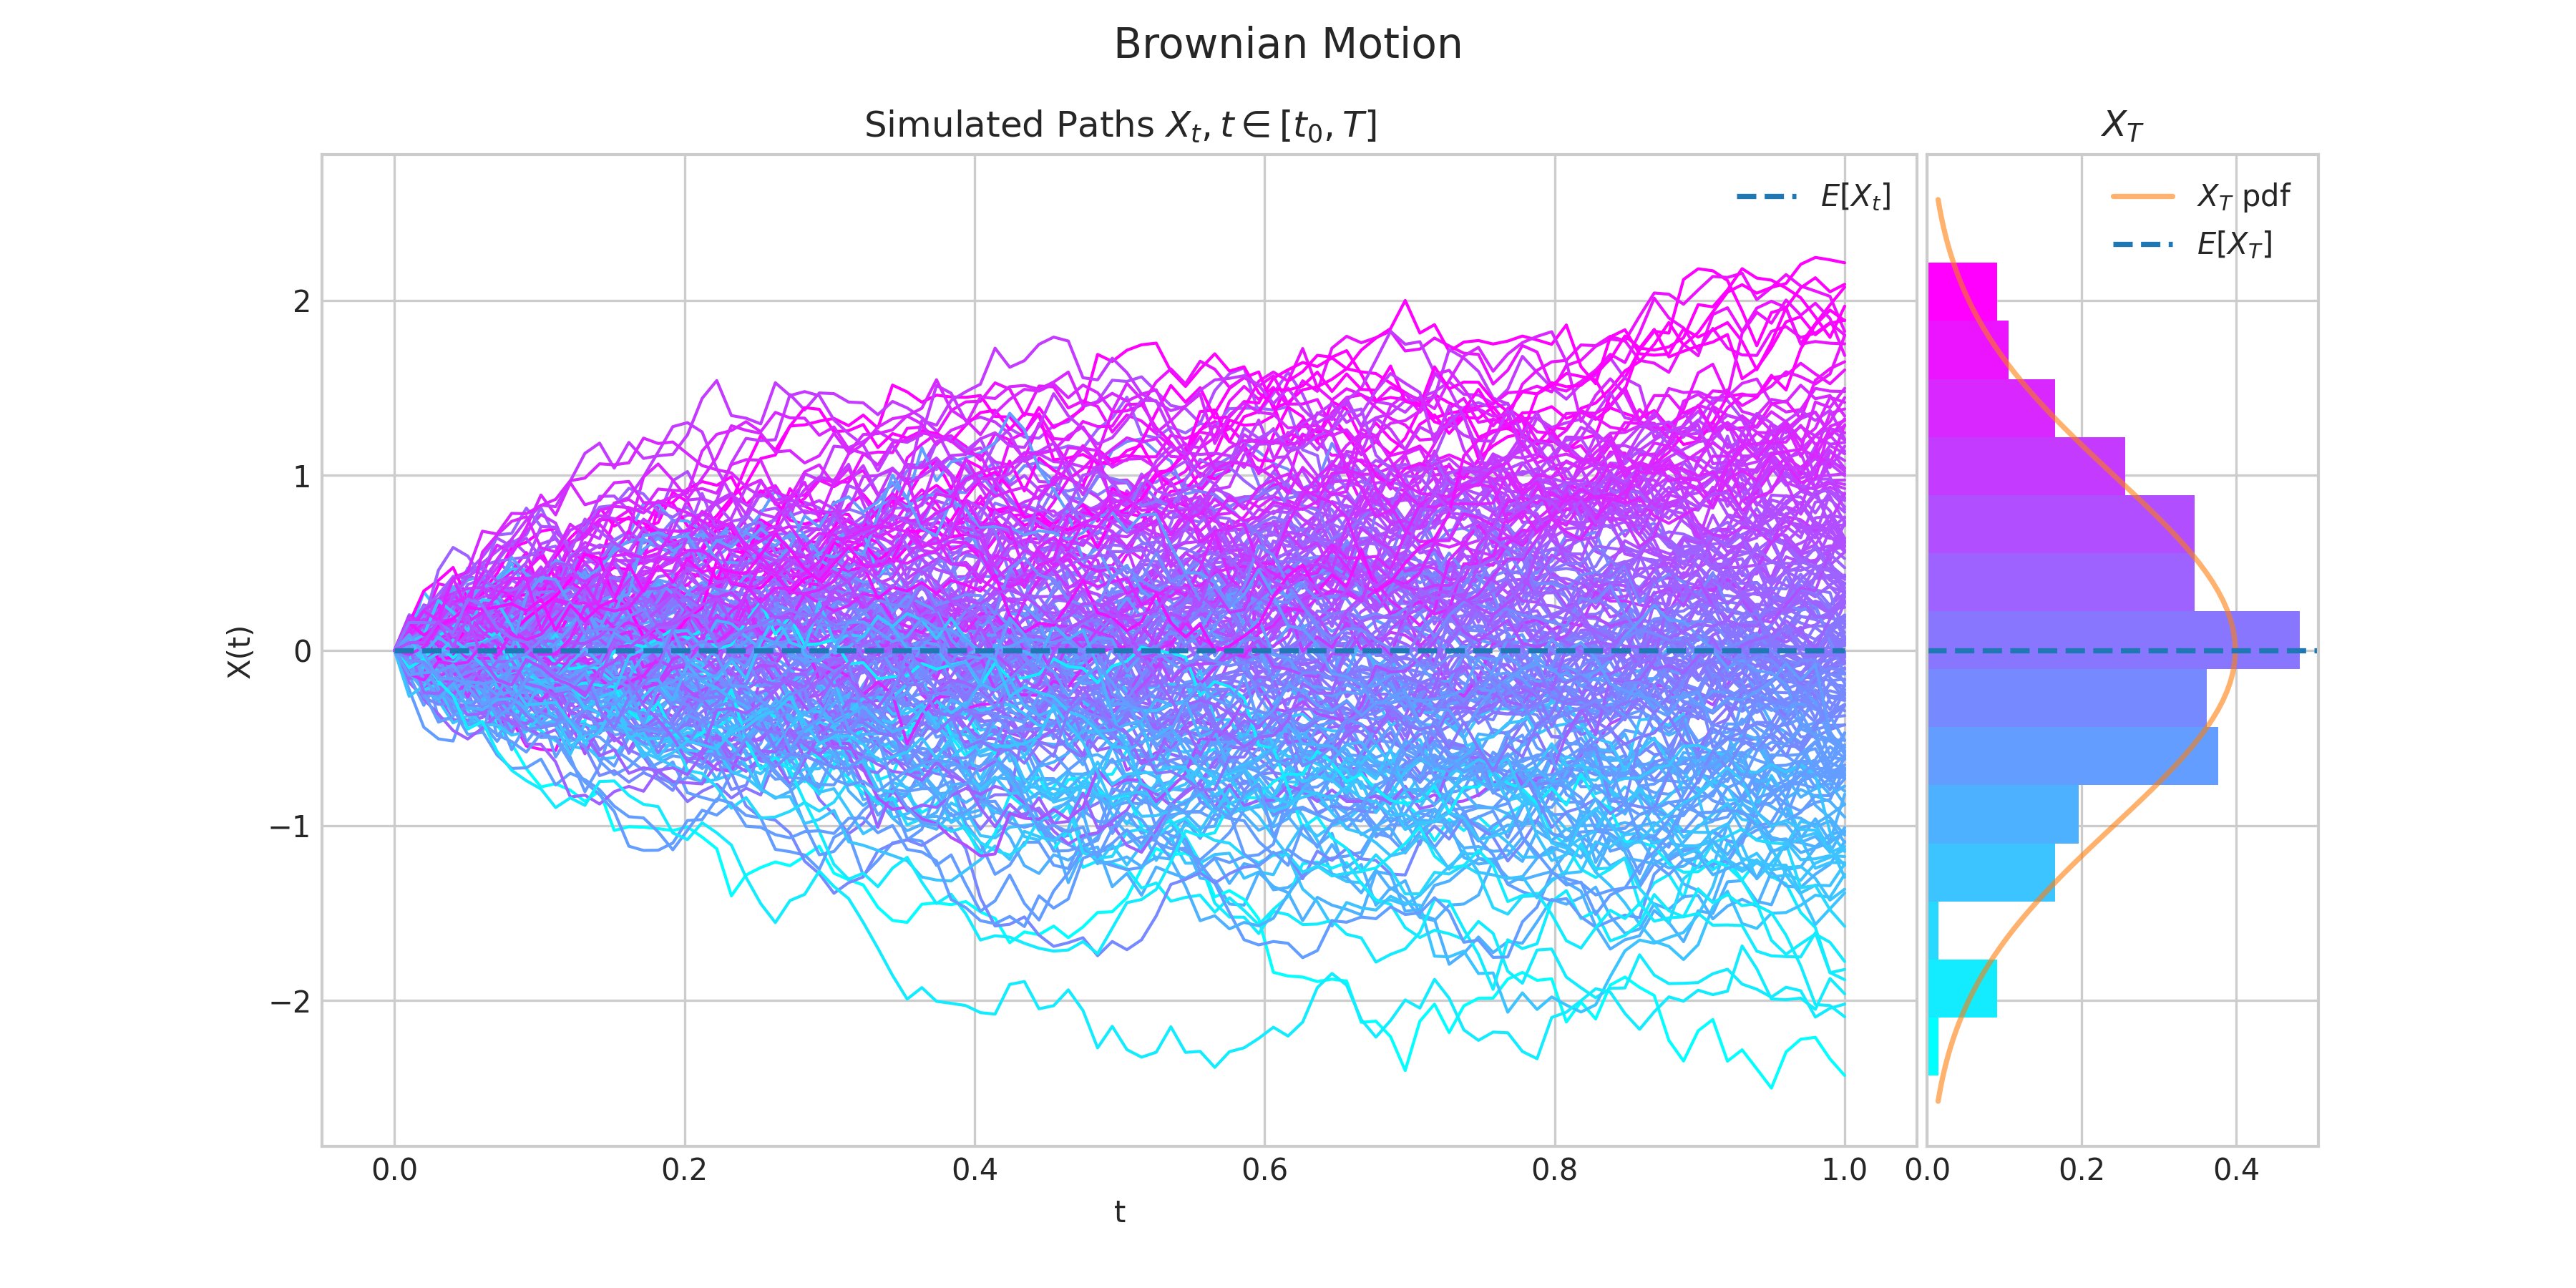
For example, the following code
from aleatory.processes import BrownianMotion

brownian = BrownianMotion()
brownian.draw(n=100, N=100, colormap="cool", figsize=(12,9))
generates a chart like this:
For more examples visit the Quick-Start Guide.
If you like this project, please give it a star! ⭐️
Connect with me via:
- 👾 Personal Website