Coder Social home page Coder Social logo

prateekkumarsingh / graphical Goto Github PK

View Code? Open in Web Editor NEW
340.0 28.0 34.0 13.83 MB

Open-Source, Platform independent module that consumes data points as input and plots them on a 2D graph ๐Ÿ“ˆ๐Ÿ“Š๐Ÿ’น [Scatter / Bar / Line] on the PowerShell Console/Terminal

License: MIT License

PowerShell 100.00%
powershell core linux windows terminal terminal-graphics ascii-art

graphical's Introduction

Powershell Console/Terminal Graph

Consumes data points as input and plots them on a 2D graph in the Powershell console

Type of Graphs Available -

  1. Scatter

  2. Bar

  3. Line

Installation

PowerShell v5 and Later

You can install the Graphical module directly from the PowerShell Gallery

  • [Recommended] Install to your personal PowerShell Modules folder
    Install-Module Graphical -scope CurrentUser
  • [Requires Elevation] Install for Everyone (computer PowerShell Modules folder)
    Install-Module Graphical

PowerShell v4 and Earlier

To install to your personal modules folder run:

iex (new-object System.Net.WebClient).DownloadString('https://raw.githubusercontent.com/PrateekKumarSingh/Graphical/master/Install.ps1')

Features

  • Color-coded output depending upon the Value of data point
  • Colors codes can be customized by passing a color-map hash table
  • Custom X an Y-Axis labels
  • Graph in console is independent and fully customizable, not like Task Manager (Performance Tab)
  • Could be incorporated in Powershell scripts
  • Can consume data points generated during script run or Pre stored data like in a file or database.
  • Independent of PowerShell version, and Works on PowerShell Core (Windows\Linux)

Use Cases

  1. The function Show-Graph takes data points as input and plot them on a 2D graph

    You can also customize the labels on X and Y-Axis and provide a graph title

    The function Show-Graph can consume data points, generated during script execution or from a file or database like in the above example.

  2. Plotting Audio Peak Levels in your PowerShell Console (Don't forget to play some audio! :P)

    Install-Module AudioDeviceCmdlets, Graphical
    Import-Module AudioDeviceCmdlets, Graphical -Verbose
    $Device = Get-AudioDevice -Playback
    [int[]]$datapoints =@(0)*50
    do {
        $PeakValue = $Device.Device.AudioMeterInformation.MasterPeakValue*100
        $datapoints += [int]$PeakValue
        $datapoints = $datapoints | Select-Object -last 50
        Clear-Host
        Show-Graph -datapoints $datapoints -GraphTitle AudioLevels
        Show-Graph -datapoints $datapoints -GraphTitle AudioLevels -Type Line
        Show-Graph -datapoints $datapoints -GraphTitle AudioLevels -Type Scatter
        Start-Sleep -Milliseconds 1000
    } while ($true)
  3. Visualizing Azure Monitor Metrics like CPU %age on a Virtual machine in #PowerShell

```PowerShell
$ResourceID = '/subscriptions/<subscription>/resourceGroups/demo-resource-group/providers/Microsoft.Compute/virtualMachines/SimpleWinVM'
$Data = Get-AzMetric -ResourceId $ResourceID  -WarningAction SilentlyContinue | Select-Object unit, data
$Datpoints = $data.data.average.foreach({[int]$_})

Import-Module Graphical
Show-Graph -Datapoints $Datpoints -GraphTitle 'CPU (% age)'

```

graphical's People

Contributors

cdhunt avatar lazywinadmin avatar prateekkumarsingh avatar

Stargazers

 avatar  avatar  avatar  avatar  avatar  avatar  avatar  avatar  avatar  avatar  avatar  avatar  avatar  avatar  avatar  avatar  avatar  avatar  avatar  avatar  avatar  avatar  avatar  avatar  avatar  avatar  avatar  avatar  avatar  avatar  avatar  avatar  avatar  avatar  avatar  avatar  avatar  avatar  avatar  avatar  avatar  avatar  avatar  avatar  avatar  avatar  avatar  avatar  avatar  avatar  avatar  avatar  avatar  avatar  avatar  avatar  avatar  avatar  avatar  avatar  avatar  avatar  avatar  avatar  avatar  avatar  avatar  avatar  avatar  avatar  avatar  avatar  avatar  avatar  avatar  avatar  avatar  avatar  avatar  avatar  avatar  avatar  avatar  avatar  avatar  avatar  avatar  avatar  avatar  avatar  avatar  avatar  avatar  avatar  avatar  avatar  avatar  avatar  avatar  avatar

Watchers

 avatar  avatar  avatar  avatar  avatar  avatar  avatar  avatar  avatar  avatar  avatar  avatar  avatar  avatar  avatar  avatar  avatar  avatar  avatar  avatar  avatar  avatar  avatar  avatar  avatar  avatar  avatar  avatar

graphical's Issues

Useful Pull Requests Waiting

Hi @PrateekKumarSingh,

First, I want to say thank you for this useful project. I find it very useful when exploring a new API and want to quickly see what the data looks like.

However, I have run into several issues while using this module and I notice that they are all fixed in the queue of waiting Pull Requests. Could you merge them, please? I've gone through all of the outstanding submissions and they're all useful and short, so they shouldn't cause conflicts or be time consuming for you to review.

Cheers,
Damian.

Non steady datapoints

Hey @PrateekKumarSingh ,

The graph is already great, if the data is in the correct range and the values are steady.

The problem

However in my case for example I hat to do a time complexity analysis for an algorithm.
Varying the value linear is not really an option because this takes very long, so I multiplied by 4 each time.

I have the following data:

2 8 32 128 512
1287.7 838.5 1057.2 1027.2 1243.3

The time in the second row is the real data I would like to visualize, but doing this directly would not be really good, because the curve is much easier to interpret when the x value of the graph is proportional to the represented value.

The next problem was that the graph doesn't scale to fit the window vertically as well as horizontally.

My quick solution

My fast solution is to transform the data before visualizing.
I did this by setting a fixed width and dividing my x axis into segments with equal width.
I then check for each segment if a datapoint is in it. I set the new datapoint to the old one if its in the segment, otherwise I set it to 0. (Alternatively the datapoint could be interpolated)

I also scaled the new datapoints in the y axis so that the maximum hits the height.

My solution works quite well. The only problem is that the labels are not correct then.

I could think of many scenarios, where some kind of linearization and scaling could be useful.
I am not sure how exactly this feature should be implemented, but it would be really awesome.

I can share some code on demand or maybe some day I am motivated and implement the feature myself. ๐Ÿ˜…

Thanks for this great module!

Streamed datapoints?

Currently I am using Clear-Host and draw the graph again with an additional data point when I want to display live data. It works quite well, but it flickers a bit. What would be really awesome is if I could pipe a stream of data points into Show-Graph and it would add data points to the graph as they come in.

Box character misplaced if graph doesn't end on an interval step

E.g. if the X axis step is the default 10, and the amount of data points is not dividable by 10, the last | box boundary character will be misplaced:

Datapoints: 67, 68, 33, 62, 38, 68, 55
โ”Œ go_goroutines โ”
โ”‚               โ”‚
โ”‚   70โ”คโ–ˆโ–ˆ โ–ˆ โ–ˆโ–  โ”‚
โ”‚   60โ”ค โ–โ–โ–โ–โ–โ–ˆ  โ”‚
โ”‚   50โ”ค โ–โ–โ–โ– โ–  โ”‚
โ”‚   40โ”ค  โ–ˆ โ–ˆ โ–  โ”‚
โ”‚     โ””โ”€โ”€โ”€โ”€โ”€โ”€โ”€  โ”‚
โ”‚        โ”‚
โ””โ”€โ”€โ”€โ”€โ”€โ”€โ”€โ”€โ”€โ”€โ”€โ”€โ”€โ”€โ”€โ”˜
Datapoints: 67, 68, 33, 62, 38, 68, 55, 68
โ”Œ go_goroutines โ”€โ”
โ”‚                โ”‚
โ”‚   70โ”คโ–ˆโ–ˆ โ–ˆ โ–ˆ โ–ˆ  โ”‚
โ”‚   60โ”ค โ–โ–โ–โ–โ–โ–ˆโ–  โ”‚
โ”‚   50โ”ค โ–โ–โ–โ–  โ–  โ”‚
โ”‚   40โ”ค  โ–ˆ โ–ˆ  โ–  โ”‚
โ”‚     โ””โ”€โ”€โ”€โ”€โ”€โ”€โ”€โ”€  โ”‚
โ”‚        โ”‚
โ””โ”€โ”€โ”€โ”€โ”€โ”€โ”€โ”€โ”€โ”€โ”€โ”€โ”€โ”€โ”€โ”€โ”˜
Datapoints: 67, 68, 33, 62, 38, 68, 55, 68, 60
โ”Œ go_goroutines โ”€โ”€โ”
โ”‚                 โ”‚
โ”‚   70โ”คโ–ˆโ–ˆ โ–ˆ โ–ˆ โ–ˆโ–  โ”‚
โ”‚   60โ”ค โ–โ–โ–โ–โ–โ–ˆโ–โ–ˆ  โ”‚
โ”‚   50โ”ค โ–โ–โ–โ–   โ–  โ”‚
โ”‚   40โ”ค  โ–ˆ โ–ˆ   โ–  โ”‚
โ”‚     โ””โ”€โ”€โ”€โ”€โ”€โ”€โ”€โ”€โ”€  โ”‚
โ”‚        โ”‚
โ””โ”€โ”€โ”€โ”€โ”€โ”€โ”€โ”€โ”€โ”€โ”€โ”€โ”€โ”€โ”€โ”€โ”€โ”˜
Datapoints: 67, 68, 33, 62, 38, 68, 55, 68, 60, 60
โ”Œ go_goroutines โ”€โ”€โ”€โ”
โ”‚                  โ”‚
โ”‚   70โ”คโ–ˆโ–ˆ โ–ˆ โ–ˆ โ–ˆ โ–  โ”‚
โ”‚   60โ”ค โ–โ–โ–โ–โ–โ–ˆโ–โ–ˆโ–ˆ  โ”‚
โ”‚   50โ”ค โ–โ–โ–โ–    โ–  โ”‚
โ”‚   40โ”ค  โ–ˆ โ–ˆ    โ–  โ”‚
โ”‚     โ””โ”€โ”€โ”€โ”€โ”€โ”€โ”€โ”€โ”€โ”ฌ  โ”‚
โ”‚              10  โ”‚
โ””โ”€โ”€โ”€โ”€โ”€โ”€โ”€โ”€โ”€โ”€โ”€โ”€โ”€โ”€โ”€โ”€โ”€โ”€โ”˜
Datapoints: 67, 68, 33, 62, 38, 68, 55, 68, 60, 60, 72
โ”Œ go_goroutines โ”€โ”€โ”€โ”€โ”
โ”‚                   โ”‚
โ”‚   80โ”ค          โ–ˆ  โ”‚
โ”‚   70โ”คโ–ˆโ–ˆ โ–ˆ โ–ˆ โ–ˆ โ–โ–  โ”‚
โ”‚   60โ”ค โ–โ–โ–โ–โ–โ–ˆโ–โ–ˆโ–ˆโ–  โ”‚
โ”‚   50โ”ค โ–โ–โ–โ–     โ–  โ”‚
โ”‚   40โ”ค  โ–ˆ โ–ˆ     โ–  โ”‚
โ”‚     โ””โ”€โ”€โ”€โ”€โ”€โ”€โ”€โ”€โ”€โ”ฌโ”€  โ”‚
โ”‚              10  โ”‚
โ””โ”€โ”€โ”€โ”€โ”€โ”€โ”€โ”€โ”€โ”€โ”€โ”€โ”€โ”€โ”€โ”€โ”€โ”€โ”€โ”˜
Datapoints: 67, 68, 33, 62, 38, 68, 55, 68, 60, 60, 72, 54
โ”Œ go_goroutines โ”€โ”€โ”€โ”€โ”€โ”
โ”‚                    โ”‚
โ”‚   80โ”ค          โ–ˆโ–  โ”‚
โ”‚   70โ”คโ–ˆโ–ˆ โ–ˆ โ–ˆ โ–ˆ โ–โ–โ–  โ”‚
โ”‚   60โ”ค โ–โ–โ–โ–โ–โ–ˆโ–โ–ˆโ–ˆ โ–ˆ  โ”‚
โ”‚   50โ”ค โ–โ–โ–โ–      โ–  โ”‚
โ”‚   40โ”ค  โ–ˆ โ–ˆ      โ–  โ”‚
โ”‚     โ””โ”€โ”€โ”€โ”€โ”€โ”€โ”€โ”€โ”€โ”ฌโ”€โ”€  โ”‚
โ”‚              10  โ”‚
โ””โ”€โ”€โ”€โ”€โ”€โ”€โ”€โ”€โ”€โ”€โ”€โ”€โ”€โ”€โ”€โ”€โ”€โ”€โ”€โ”€โ”˜
Datapoints: 67, 68, 33, 62, 38, 68, 55, 68, 60, 60, 72, 54, 44
โ”Œ go_goroutines โ”€โ”€โ”€โ”€โ”€โ”€โ”
โ”‚                     โ”‚
โ”‚   80โ”ค          โ–ˆ โ–  โ”‚
โ”‚   70โ”คโ–ˆโ–ˆ โ–ˆ โ–ˆ โ–ˆ โ–โ– โ–  โ”‚
โ”‚   60โ”ค โ–โ–โ–โ–โ–โ–ˆโ–โ–ˆโ–ˆ โ–ˆ   โ”‚
โ”‚   50โ”ค โ–โ–โ–โ–      โ–โ–ˆ  โ”‚
โ”‚   40โ”ค  โ–ˆ โ–ˆ       โ–  โ”‚
โ”‚     โ””โ”€โ”€โ”€โ”€โ”€โ”€โ”€โ”€โ”€โ”ฌโ”€โ”€โ”€  โ”‚
โ”‚              10  โ”‚
โ””โ”€โ”€โ”€โ”€โ”€โ”€โ”€โ”€โ”€โ”€โ”€โ”€โ”€โ”€โ”€โ”€โ”€โ”€โ”€โ”€โ”€โ”˜
Datapoints: 67, 68, 33, 62, 38, 68, 55, 68, 60, 60, 72, 54, 44, 73
โ”Œ go_goroutines โ”€โ”€โ”€โ”€โ”€โ”€โ”€โ”
โ”‚                      โ”‚
โ”‚   80โ”ค          โ–ˆ  โ–ˆ  โ”‚
โ”‚   70โ”คโ–ˆโ–ˆ โ–ˆ โ–ˆ โ–ˆ โ–โ– โ–โ–  โ”‚
โ”‚   60โ”ค โ–โ–โ–โ–โ–โ–ˆโ–โ–ˆโ–ˆ โ–ˆโ–โ–  โ”‚
โ”‚   50โ”ค โ–โ–โ–โ–      โ–โ–ˆโ–  โ”‚
โ”‚   40โ”ค  โ–ˆ โ–ˆ        โ–  โ”‚
โ”‚     โ””โ”€โ”€โ”€โ”€โ”€โ”€โ”€โ”€โ”€โ”ฌโ”€โ”€โ”€โ”€  โ”‚
โ”‚              10  โ”‚
โ””โ”€โ”€โ”€โ”€โ”€โ”€โ”€โ”€โ”€โ”€โ”€โ”€โ”€โ”€โ”€โ”€โ”€โ”€โ”€โ”€โ”€โ”€โ”˜
Datapoints: 67, 68, 33, 62, 38, 68, 55, 68, 60, 60, 72, 54, 44, 73, 62
โ”Œ go_goroutines โ”€โ”€โ”€โ”€โ”€โ”€โ”€โ”€โ”
โ”‚                       โ”‚
โ”‚   80โ”ค          โ–ˆ  โ–ˆโ–  โ”‚
โ”‚   70โ”คโ–ˆโ–ˆ โ–ˆ โ–ˆ โ–ˆ โ–โ– โ–โ–โ–ˆ  โ”‚
โ”‚   60โ”ค โ–โ–โ–โ–โ–โ–ˆโ–โ–ˆโ–ˆ โ–ˆโ– โ–  โ”‚
โ”‚   50โ”ค โ–โ–โ–โ–      โ–โ–ˆ โ–  โ”‚
โ”‚   40โ”ค  โ–ˆ โ–ˆ         โ–  โ”‚
โ”‚     โ””โ”€โ”€โ”€โ”€โ”€โ”€โ”€โ”€โ”€โ”ฌโ”€โ”€โ”€โ”€โ”€  โ”‚
โ”‚              10  โ”‚
โ””โ”€โ”€โ”€โ”€โ”€โ”€โ”€โ”€โ”€โ”€โ”€โ”€โ”€โ”€โ”€โ”€โ”€โ”€โ”€โ”€โ”€โ”€โ”€โ”˜
Datapoints: 67, 68, 33, 62, 38, 68, 55, 68, 60, 60, 72, 54, 44, 73, 62, 75
โ”Œ go_goroutines โ”€โ”€โ”€โ”€โ”€โ”€โ”€โ”€โ”€โ”
โ”‚                        โ”‚
โ”‚   80โ”ค          โ–ˆ  โ–ˆ โ–ˆ  โ”‚
โ”‚   70โ”คโ–ˆโ–ˆ โ–ˆ โ–ˆ โ–ˆ โ–โ– โ–โ–โ–ˆโ–  โ”‚
โ”‚   60โ”ค โ–โ–โ–โ–โ–โ–ˆโ–โ–ˆโ–ˆ โ–ˆโ–  โ–  โ”‚
โ”‚   50โ”ค โ–โ–โ–โ–      โ–โ–ˆ  โ–  โ”‚
โ”‚   40โ”ค  โ–ˆ โ–ˆ          โ–  โ”‚
โ”‚     โ””โ”€โ”€โ”€โ”€โ”€โ”€โ”€โ”€โ”€โ”ฌโ”€โ”€โ”€โ”€โ”€โ”€  โ”‚
โ”‚              10  โ”‚
โ””โ”€โ”€โ”€โ”€โ”€โ”€โ”€โ”€โ”€โ”€โ”€โ”€โ”€โ”€โ”€โ”€โ”€โ”€โ”€โ”€โ”€โ”€โ”€โ”€โ”˜
Datapoints: 67, 68, 33, 62, 38, 68, 55, 68, 60, 60, 72, 54, 44, 73, 62, 75, 61
โ”Œ go_goroutines โ”€โ”€โ”€โ”€โ”€โ”€โ”€โ”€โ”€โ”€โ”
โ”‚                         โ”‚
โ”‚   80โ”ค          โ–ˆ  โ–ˆ โ–ˆโ–  โ”‚
โ”‚   70โ”คโ–ˆโ–ˆ โ–ˆ โ–ˆ โ–ˆ โ–โ– โ–โ–โ–ˆโ–โ–ˆ  โ”‚
โ”‚   60โ”ค โ–โ–โ–โ–โ–โ–ˆโ–โ–ˆโ–ˆ โ–ˆโ–   โ–  โ”‚
โ”‚   50โ”ค โ–โ–โ–โ–      โ–โ–ˆ   โ–  โ”‚
โ”‚   40โ”ค  โ–ˆ โ–ˆ           โ–  โ”‚
โ”‚     โ””โ”€โ”€โ”€โ”€โ”€โ”€โ”€โ”€โ”€โ”ฌโ”€โ”€โ”€โ”€โ”€โ”€โ”€  โ”‚
โ”‚              10  โ”‚
โ””โ”€โ”€โ”€โ”€โ”€โ”€โ”€โ”€โ”€โ”€โ”€โ”€โ”€โ”€โ”€โ”€โ”€โ”€โ”€โ”€โ”€โ”€โ”€โ”€โ”€โ”˜
Datapoints: 67, 68, 33, 62, 38, 68, 55, 68, 60, 60, 72, 54, 44, 73, 62, 75, 61, 53
โ”Œ go_goroutines โ”€โ”€โ”€โ”€โ”€โ”€โ”€โ”€โ”€โ”€โ”€โ”
โ”‚                          โ”‚
โ”‚   80โ”ค          โ–ˆ  โ–ˆ โ–ˆ โ–  โ”‚
โ”‚   70โ”คโ–ˆโ–ˆ โ–ˆ โ–ˆ โ–ˆ โ–โ– โ–โ–โ–ˆโ–โ–ˆโ–  โ”‚
โ”‚   60โ”ค โ–โ–โ–โ–โ–โ–ˆโ–โ–ˆโ–ˆ โ–ˆโ–   โ–โ–ˆ  โ”‚
โ”‚   50โ”ค โ–โ–โ–โ–      โ–โ–ˆ    โ–  โ”‚
โ”‚   40โ”ค  โ–ˆ โ–ˆ            โ–  โ”‚
โ”‚     โ””โ”€โ”€โ”€โ”€โ”€โ”€โ”€โ”€โ”€โ”ฌโ”€โ”€โ”€โ”€โ”€โ”€โ”€โ”€  โ”‚
โ”‚              10  โ”‚
โ””โ”€โ”€โ”€โ”€โ”€โ”€โ”€โ”€โ”€โ”€โ”€โ”€โ”€โ”€โ”€โ”€โ”€โ”€โ”€โ”€โ”€โ”€โ”€โ”€โ”€โ”€โ”˜
Datapoints: 67, 68, 33, 62, 38, 68, 55, 68, 60, 60, 72, 54, 44, 73, 62, 75, 61, 53, 34
โ”Œ go_goroutines โ”€โ”€โ”€โ”€โ”€โ”€โ”€โ”€โ”€โ”€โ”€โ”€โ”
โ”‚                           โ”‚
โ”‚   80โ”ค          โ–ˆ  โ–ˆ โ–ˆ  โ–  โ”‚
โ”‚   70โ”คโ–ˆโ–ˆ โ–ˆ โ–ˆ โ–ˆ โ–โ– โ–โ–โ–ˆโ–โ–ˆ โ–  โ”‚
โ”‚   60โ”ค โ–โ–โ–โ–โ–โ–ˆโ–โ–ˆโ–ˆ โ–ˆโ–   โ–โ–ˆ   โ”‚
โ”‚   50โ”ค โ–โ–โ–โ–      โ–โ–ˆ    โ–   โ”‚
โ”‚   40โ”ค  โ–ˆ โ–ˆ             โ–ˆ  โ”‚
โ”‚     โ””โ”€โ”€โ”€โ”€โ”€โ”€โ”€โ”€โ”€โ”ฌโ”€โ”€โ”€โ”€โ”€โ”€โ”€โ”€โ”€  โ”‚
โ”‚              10  โ”‚
โ””โ”€โ”€โ”€โ”€โ”€โ”€โ”€โ”€โ”€โ”€โ”€โ”€โ”€โ”€โ”€โ”€โ”€โ”€โ”€โ”€โ”€โ”€โ”€โ”€โ”€โ”€โ”€โ”˜
Datapoints: 67, 68, 33, 62, 38, 68, 55, 68, 60, 60, 72, 54, 44, 73, 62, 75, 61, 53, 34, 56
โ”Œ go_goroutines โ”€โ”€โ”€โ”€โ”€โ”€โ”€โ”€โ”€โ”€โ”€โ”€โ”€โ”
โ”‚                            โ”‚
โ”‚   80โ”ค          โ–ˆ  โ–ˆ โ–ˆ   โ–  โ”‚
โ”‚   70โ”คโ–ˆโ–ˆ โ–ˆ โ–ˆ โ–ˆ โ–โ– โ–โ–โ–ˆโ–โ–ˆ  โ–  โ”‚
โ”‚   60โ”ค โ–โ–โ–โ–โ–โ–ˆโ–โ–ˆโ–ˆ โ–ˆโ–   โ–โ–ˆ โ–ˆ  โ”‚
โ”‚   50โ”ค โ–โ–โ–โ–      โ–โ–ˆ    โ–โ–โ–  โ”‚
โ”‚   40โ”ค  โ–ˆ โ–ˆ             โ–ˆโ–  โ”‚
โ”‚     โ””โ”€โ”€โ”€โ”€โ”€โ”€โ”€โ”€โ”€โ”ฌโ”€โ”€โ”€โ”€โ”€โ”€โ”€โ”€โ”€โ”ฌ  โ”‚
โ”‚              10        20  โ”‚
โ””โ”€โ”€โ”€โ”€โ”€โ”€โ”€โ”€โ”€โ”€โ”€โ”€โ”€โ”€โ”€โ”€โ”€โ”€โ”€โ”€โ”€โ”€โ”€โ”€โ”€โ”€โ”€โ”€โ”˜
Datapoints: 67, 68, 33, 62, 38, 68, 55, 68, 60, 60, 72, 54, 44, 73, 62, 75, 61, 53, 34, 56, 74
โ”Œ go_goroutines โ”€โ”€โ”€โ”€โ”€โ”€โ”€โ”€โ”€โ”€โ”€โ”€โ”€โ”€โ”
โ”‚                             โ”‚
โ”‚   80โ”ค          โ–ˆ  โ–ˆ โ–ˆ    โ–ˆ  โ”‚
โ”‚   70โ”คโ–ˆโ–ˆ โ–ˆ โ–ˆ โ–ˆ โ–โ– โ–โ–โ–ˆโ–โ–ˆ  โ–โ–  โ”‚
โ”‚   60โ”ค โ–โ–โ–โ–โ–โ–ˆโ–โ–ˆโ–ˆ โ–ˆโ–   โ–โ–ˆ โ–ˆโ–  โ”‚
โ”‚   50โ”ค โ–โ–โ–โ–      โ–โ–ˆ    โ–โ– โ–  โ”‚
โ”‚   40โ”ค  โ–ˆ โ–ˆ             โ–ˆ โ–  โ”‚
โ”‚     โ””โ”€โ”€โ”€โ”€โ”€โ”€โ”€โ”€โ”€โ”ฌโ”€โ”€โ”€โ”€โ”€โ”€โ”€โ”€โ”€โ”ฌโ”€  โ”‚
โ”‚              10        20  โ”‚
โ””โ”€โ”€โ”€โ”€โ”€โ”€โ”€โ”€โ”€โ”€โ”€โ”€โ”€โ”€โ”€โ”€โ”€โ”€โ”€โ”€โ”€โ”€โ”€โ”€โ”€โ”€โ”€โ”€โ”€โ”˜
Datapoints: 67, 68, 33, 62, 38, 68, 55, 68, 60, 60, 72, 54, 44, 73, 62, 75, 61, 53, 34, 56, 74, 41
โ”Œ go_goroutines โ”€โ”€โ”€โ”€โ”€โ”€โ”€โ”€โ”€โ”€โ”€โ”€โ”€โ”€โ”€โ”
โ”‚                              โ”‚
โ”‚   80โ”ค          โ–ˆ  โ–ˆ โ–ˆ    โ–ˆโ–  โ”‚
โ”‚   70โ”คโ–ˆโ–ˆ โ–ˆ โ–ˆ โ–ˆ โ–โ– โ–โ–โ–ˆโ–โ–ˆ  โ–โ–โ–  โ”‚
โ”‚   60โ”ค โ–โ–โ–โ–โ–โ–ˆโ–โ–ˆโ–ˆ โ–ˆโ–   โ–โ–ˆ โ–ˆโ–   โ”‚
โ”‚   50โ”ค โ–โ–โ–โ–      โ–โ–ˆ    โ–โ–  โ–ˆ  โ”‚
โ”‚   40โ”ค  โ–ˆ โ–ˆ             โ–ˆ  โ–  โ”‚
โ”‚     โ””โ”€โ”€โ”€โ”€โ”€โ”€โ”€โ”€โ”€โ”ฌโ”€โ”€โ”€โ”€โ”€โ”€โ”€โ”€โ”€โ”ฌโ”€โ”€  โ”‚
โ”‚              10        20  โ”‚
โ””โ”€โ”€โ”€โ”€โ”€โ”€โ”€โ”€โ”€โ”€โ”€โ”€โ”€โ”€โ”€โ”€โ”€โ”€โ”€โ”€โ”€โ”€โ”€โ”€โ”€โ”€โ”€โ”€โ”€โ”€โ”˜
Datapoints: 67, 68, 33, 62, 38, 68, 55, 68, 60, 60, 72, 54, 44, 73, 62, 75, 61, 53, 34, 56, 74, 41, 33
โ”Œ go_goroutines โ”€โ”€โ”€โ”€โ”€โ”€โ”€โ”€โ”€โ”€โ”€โ”€โ”€โ”€โ”€โ”€โ”
โ”‚                               โ”‚
โ”‚   80โ”ค          โ–ˆ  โ–ˆ โ–ˆ    โ–ˆ โ–  โ”‚
โ”‚   70โ”คโ–ˆโ–ˆ โ–ˆ โ–ˆ โ–ˆ โ–โ– โ–โ–โ–ˆโ–โ–ˆ  โ–โ– โ–  โ”‚
โ”‚   60โ”ค โ–โ–โ–โ–โ–โ–ˆโ–โ–ˆโ–ˆ โ–ˆโ–   โ–โ–ˆ โ–ˆโ–    โ”‚
โ”‚   50โ”ค โ–โ–โ–โ–      โ–โ–ˆ    โ–โ–  โ–ˆ   โ”‚
โ”‚   40โ”ค  โ–ˆ โ–ˆ             โ–ˆ  โ–โ–ˆ  โ”‚
โ”‚     โ””โ”€โ”€โ”€โ”€โ”€โ”€โ”€โ”€โ”€โ”ฌโ”€โ”€โ”€โ”€โ”€โ”€โ”€โ”€โ”€โ”ฌโ”€โ”€โ”€  โ”‚
โ”‚              10        20  โ”‚
โ””โ”€โ”€โ”€โ”€โ”€โ”€โ”€โ”€โ”€โ”€โ”€โ”€โ”€โ”€โ”€โ”€โ”€โ”€โ”€โ”€โ”€โ”€โ”€โ”€โ”€โ”€โ”€โ”€โ”€โ”€โ”€โ”˜

2018-08-09 18 54 10

Specify values for X axis

I would like to show a graph for data with explicit X values, e.g. where the X axis represents time. Maybe Datapoints could accept a hash table where the key is the X value?

Ideally, the key could then be an int, float or DateTime object

Manually specify axis bounds

When repeatedly drawing a graph with different data, I would like to manually set the axis bounds so the axis are "stable". For example, I would like to specify that the Y axis should always start at 0, not the lowest value in the data set.

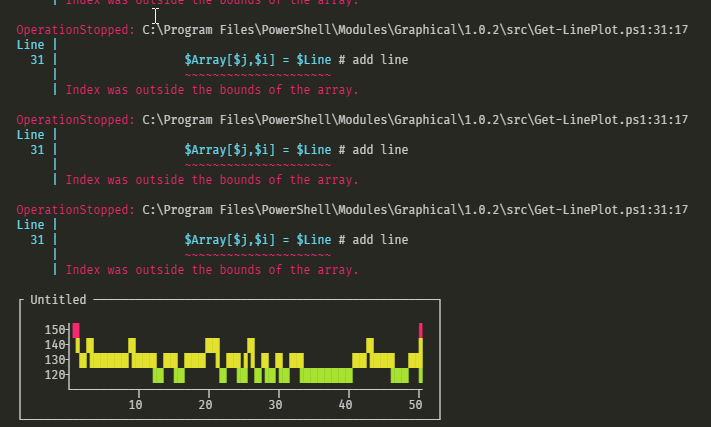
Index out of bounds error with certain dataset in Line graph

Steps to reproduce

run the following script:

ipmo Graphical
$TestData = @(
    146.2869, 125.8676, 131.6403, 126.1095, 125.2327, 129.3879, 121.1957, 121.1715, 133.5654, 123.1936, 121.2738, 128.1564, 115.8329, 120.6185, 129.975
    119.184, 127.2515, 121.1354, 127.3241, 130.5228, 139.8449, 119.9533, 127.9957, 121.745, 120.0916, 134.3705, 117.8509, 128.0231, 119.3807, 129.5753
    117.3724, 122.7834, 126.122, 120.2665, 120.1368, 119.297, 114.8186, 117.6453, 120.0503, 117.5853, 123.487, 122.6258, 130.8383, 123.5863, 120.5457
    130.3574, 119.6901, 120.0723, 130.4798, 122.0327
)

Show-Graph -Datapoints $TestData -Type Bar
Show-Graph -Datapoints $TestData -Type Scatter
Show-Graph -Datapoints $TestData -Type Line

Expected result

it should show all three types of graphs without errors

Actual result

all three graph types are shown, but there are some errors for the Line graph
image

Additional information

Bar and Scatter graphs are shown without errors for the exact same dataset

VersionInfo

Graphical Module:

1.0.2

Powershell

PSVersion 7.0.2
PSEdition Core
GitCommitId 7.0.2
OS Microsoft Windows 10.0.18363
Platform Win32NT
PSCompatibleVersions {1.0, 2.0, 3.0, 4.0โ€ฆ}
PSRemotingProtocolVersion 2.3
SerializationVersion 1.1.0.1
WSManStackVersion 3.0

OS

Windows 10 Pro
Version 1909

All graph types do not show the lowest value in the dataset

When plotting data with any of the three chart types, the lowest value in the dataset is never drawn. This is perhaps most obviously demonstrated with a bar plot.

For example, If I create an array called "test" and add values from 1-10, like this:
image

You get a chart that looks like this:
image
You can see that the y-axis starts at 2 and not 1, and the first value is completely missing.

The result should look like this:
image

After doing some debugging, I believe the reason for this is because of two issues in Show-Graph.ps1.

On line 148 the below code never processes the last value in the set:
For($i=$NumOfRows;$i -gt 0;$i--)

Simply changing the -gt comparison operator to -ge ensures the for-loop processes all the data points:
For($i=$NumOfRows;$i -ge 0;$i--)

That alone does not resolve the issue though. The second section of code that needed changing is at line 221:
elseif($RangePercent -le 40 -and $RangePercent -ge 1)

A similar issue to the above, the code is not processed when $i is equal to 0:
$RangePercent = $i/$NumOfRows * 100
elseif($RangePercent -le 40 -and $RangePercent -ge 1)

Simply changing line 221 to elseif($RangePercent -le 40 -and $RangePercent -ge 0) allows the chart to be plotted correctly.

I hope this is useful.

Specify Maximum Y Axis Value

Would like to be able to specify a maximum Y Axis value as sometimes the maximum datapoint value is not necessarily the highest needed. Green, Yellow and Red values can also be more useful if you can specify a maximum Y value.

Can be done by adding a new parameter and changing a line in the Show-Graph.ps1

[int] $YMAX = 100,
If($PSBoundParameters.ContainsKey("YMAX")) {
$Metric.Maximum = $YMAX
}

Error when drawing graph with less than 3 data points

Drawing a graph with less than 3 data points throws an error.

> Show-Graph -Type line -Datapoints 1
Specified argument was out of the range of valid values.
Parameter name: times
At /Users/felix/.local/share/powershell/Modules/Graphical/1.0.1/src/Show-Graph.ps1:144 char:53
+ ... t," ",$GraphTitle," ",$([string]$TopEdge * $TopBoundaryLength),$TopRi ...
+                             ~~~~~~~~~~~~~~~~~~~~~~~~~~~~~~~~~~~~~
+ CategoryInfo          : OperationStopped: (:) [], ArgumentOutOfRangeException
+ FullyQualifiedErrorId : System.ArgumentOutOfRangeException

โ”Œ Untitled โ”
โ”‚        โ”‚
โ”‚  10โ”คโ–ˆ  โ”‚
โ”‚    โ””โ”€  โ”‚
โ”‚       โ”‚
โ””โ”€โ”€โ”€โ”€โ”€โ”€โ”€โ”€โ”˜
โœ” ~
> Show-Graph -Type line -Datapoints 1,2
Specified argument was out of the range of valid values.
Parameter name: times
At /Users/felix/.local/share/powershell/Modules/Graphical/1.0.1/src/Show-Graph.ps1:144 char:53
+ ... t," ",$GraphTitle," ",$([string]$TopEdge * $TopBoundaryLength),$TopRi ...
+                             ~~~~~~~~~~~~~~~~~~~~~~~~~~~~~~~~~~~~~
+ CategoryInfo          : OperationStopped: (:) [], ArgumentOutOfRangeException
+ FullyQualifiedErrorId : System.ArgumentOutOfRangeException

โ”Œ Untitled โ”
โ”‚         โ”‚
โ”‚  10โ”คโ–ˆโ–ˆ  โ”‚
โ”‚    โ””โ”€โ”€  โ”‚
โ”‚       โ”‚
โ””โ”€โ”€โ”€โ”€โ”€โ”€โ”€โ”€โ”€โ”˜
โœ” ~
> Show-Graph -Type line -Datapoints 1,2,3
โ”Œ Untitled โ”
โ”‚          โ”‚
โ”‚  10โ”คโ–ˆโ–ˆโ–ˆ  โ”‚
โ”‚    โ””โ”€โ”€โ”€  โ”‚
โ”‚       โ”‚
โ””โ”€โ”€โ”€โ”€โ”€โ”€โ”€โ”€โ”€โ”€โ”˜
โœ” ~
>

I am live-plotting a graph with the X axis being time, so on every poll I add one more data point, so the first 2 graphs always throw an error:

2018-08-09 18 48 01

Recommend Projects

  • React photo React

    A declarative, efficient, and flexible JavaScript library for building user interfaces.

  • Vue.js photo Vue.js

    ๐Ÿ–– Vue.js is a progressive, incrementally-adoptable JavaScript framework for building UI on the web.

  • Typescript photo Typescript

    TypeScript is a superset of JavaScript that compiles to clean JavaScript output.

  • TensorFlow photo TensorFlow

    An Open Source Machine Learning Framework for Everyone

  • Django photo Django

    The Web framework for perfectionists with deadlines.

  • D3 photo D3

    Bring data to life with SVG, Canvas and HTML. ๐Ÿ“Š๐Ÿ“ˆ๐ŸŽ‰

Recommend Topics

  • javascript

    JavaScript (JS) is a lightweight interpreted programming language with first-class functions.

  • web

    Some thing interesting about web. New door for the world.

  • server

    A server is a program made to process requests and deliver data to clients.

  • Machine learning

    Machine learning is a way of modeling and interpreting data that allows a piece of software to respond intelligently.

  • Game

    Some thing interesting about game, make everyone happy.

Recommend Org

  • Facebook photo Facebook

    We are working to build community through open source technology. NB: members must have two-factor auth.

  • Microsoft photo Microsoft

    Open source projects and samples from Microsoft.

  • Google photo Google

    Google โค๏ธ Open Source for everyone.

  • D3 photo D3

    Data-Driven Documents codes.