MIP, CP, SAT, MIP-LNS models corresponding to the declarative node placement discussed in the paper. The CP model can be directly evaluated using any of the solvers supporting MiniZinc, including the G12 CPX constraint programming solver. The MIP model can be evaluated using G12 MIP, CPLEX, or any other supporting solver. The SAT model can be evaluated using the BumbleBEE solver. The MIP-LNS model can be evaluated using CPLEX.
We include these to highlight how little "code" is required to reproduce the layouts in the paper using modern constraint programming languages.
The CP model (HqUcGl-cp.mzn) accepts input in minizinc data format (.dzn) The MIP model (HqUcGl-mip.mod) accepts input in .dat data files.
The SAT model accepts input in .mod data files, which can be translated from a .mzn file using the mznout2mod.py
the .mzn file is pretty simple to generate with the following format:
#modules=
1: [1]
2: [2]
3: [3]
4: [1,2]
#edges=
(1,2)
(3,4)
Then the gridlay2dense.py takes the .mod file as input and produces a .dense file as output,
Then the dense2bee.py takes the .dense file as input and produces a .bee file as output,
then the .bee file is solved using the BumbleBEE solver.
The MIP model (opt_center_complete.mod) accepts input in .dat data files. However, in contrast to the regular MIP model, this one has parameters for ordering constraints and edge length constraints between nodes. These values are gathered from the layout generated by Force-Directed Grid-Snap using WebCola. (https://github.com/tgdwyer/WebCola)
The following are examples of graph layouts produced by the models:
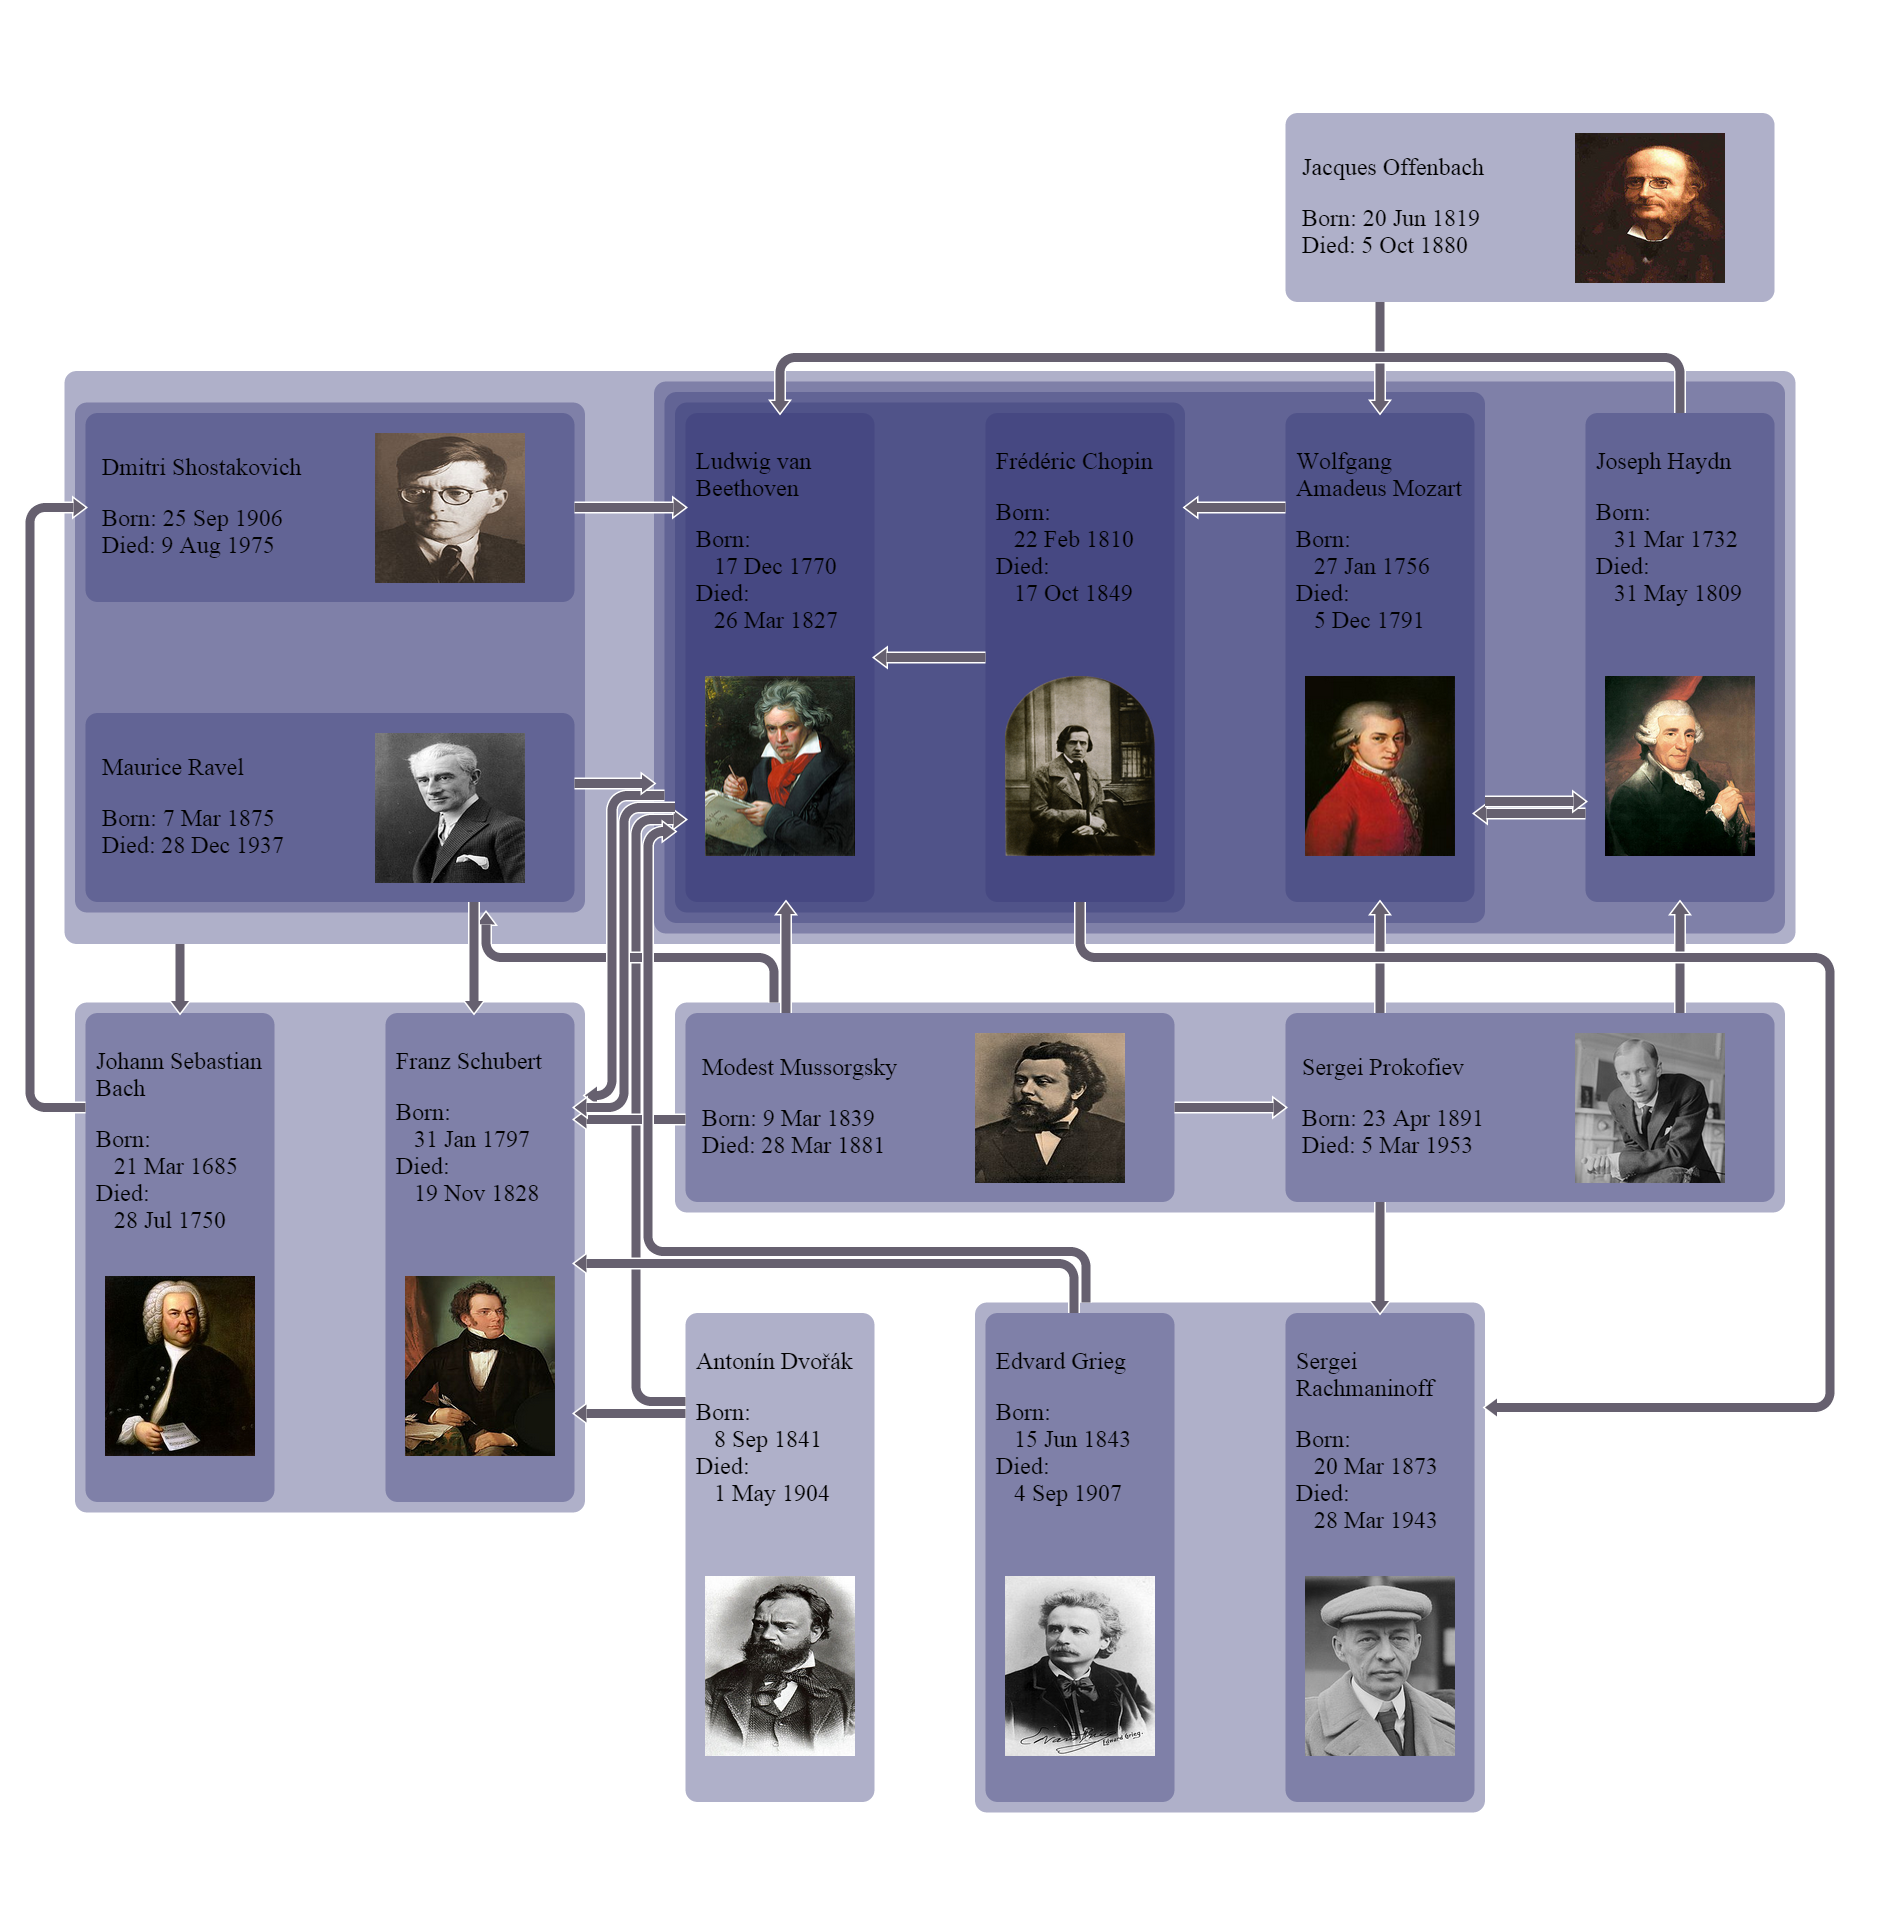 "links between major composers, arranged with our model with the solver choosing the best orientation (vertical / horizontal) for nodes. Layout took 37.422 seconds using the SAT solver - disjunctions due to variable node orientation expand the search space."
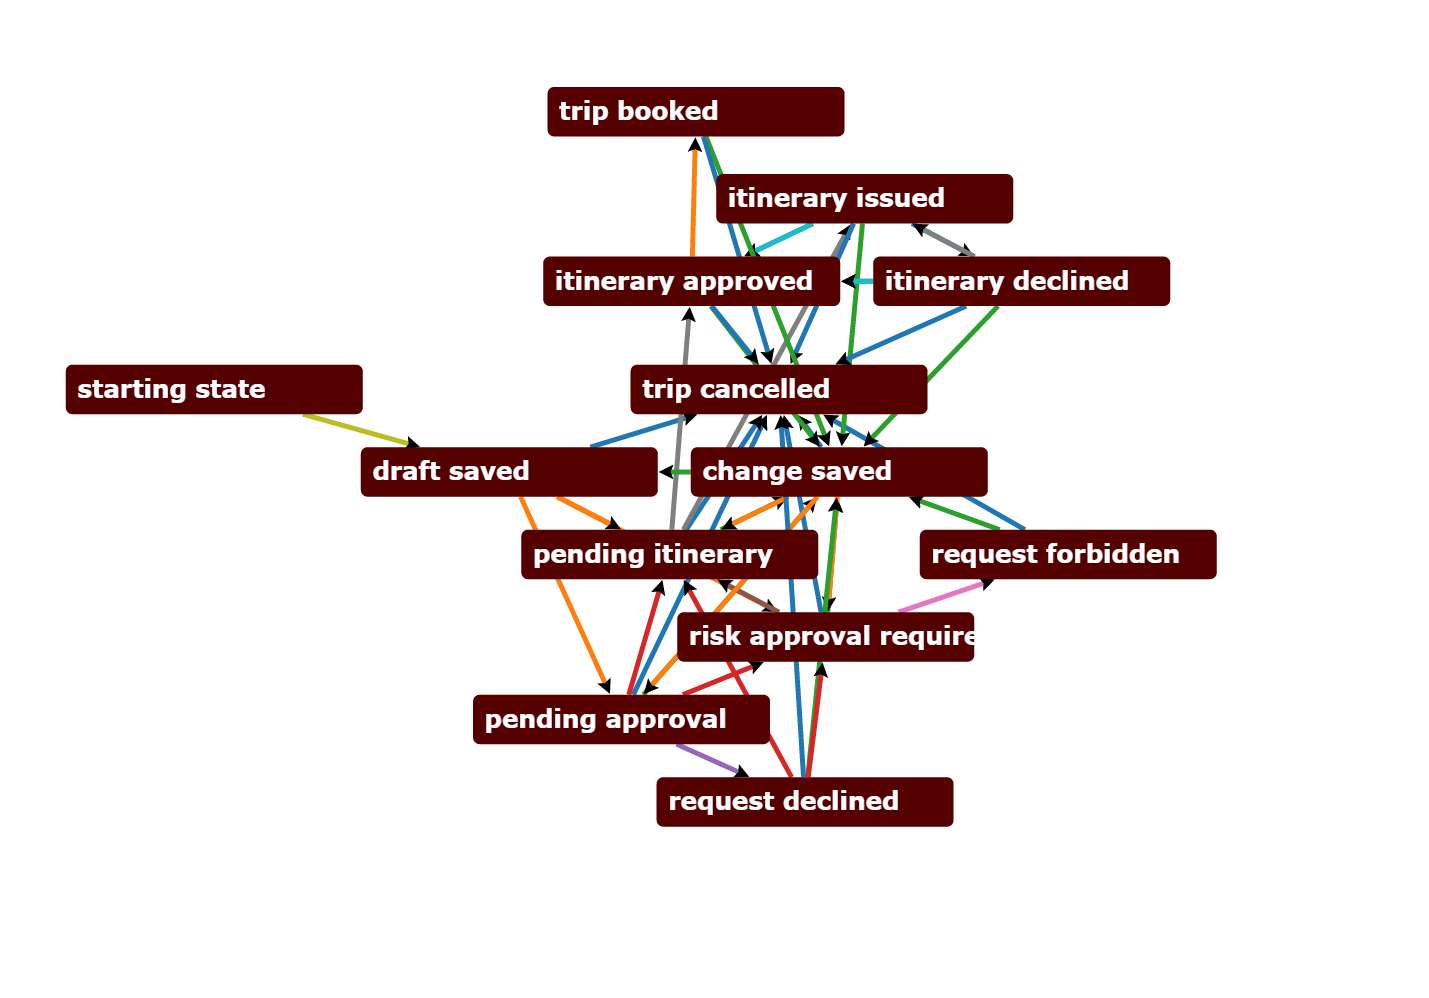 The state-machine graph drawn using WebCola (https://github.com/tgdwyer/WebCola)
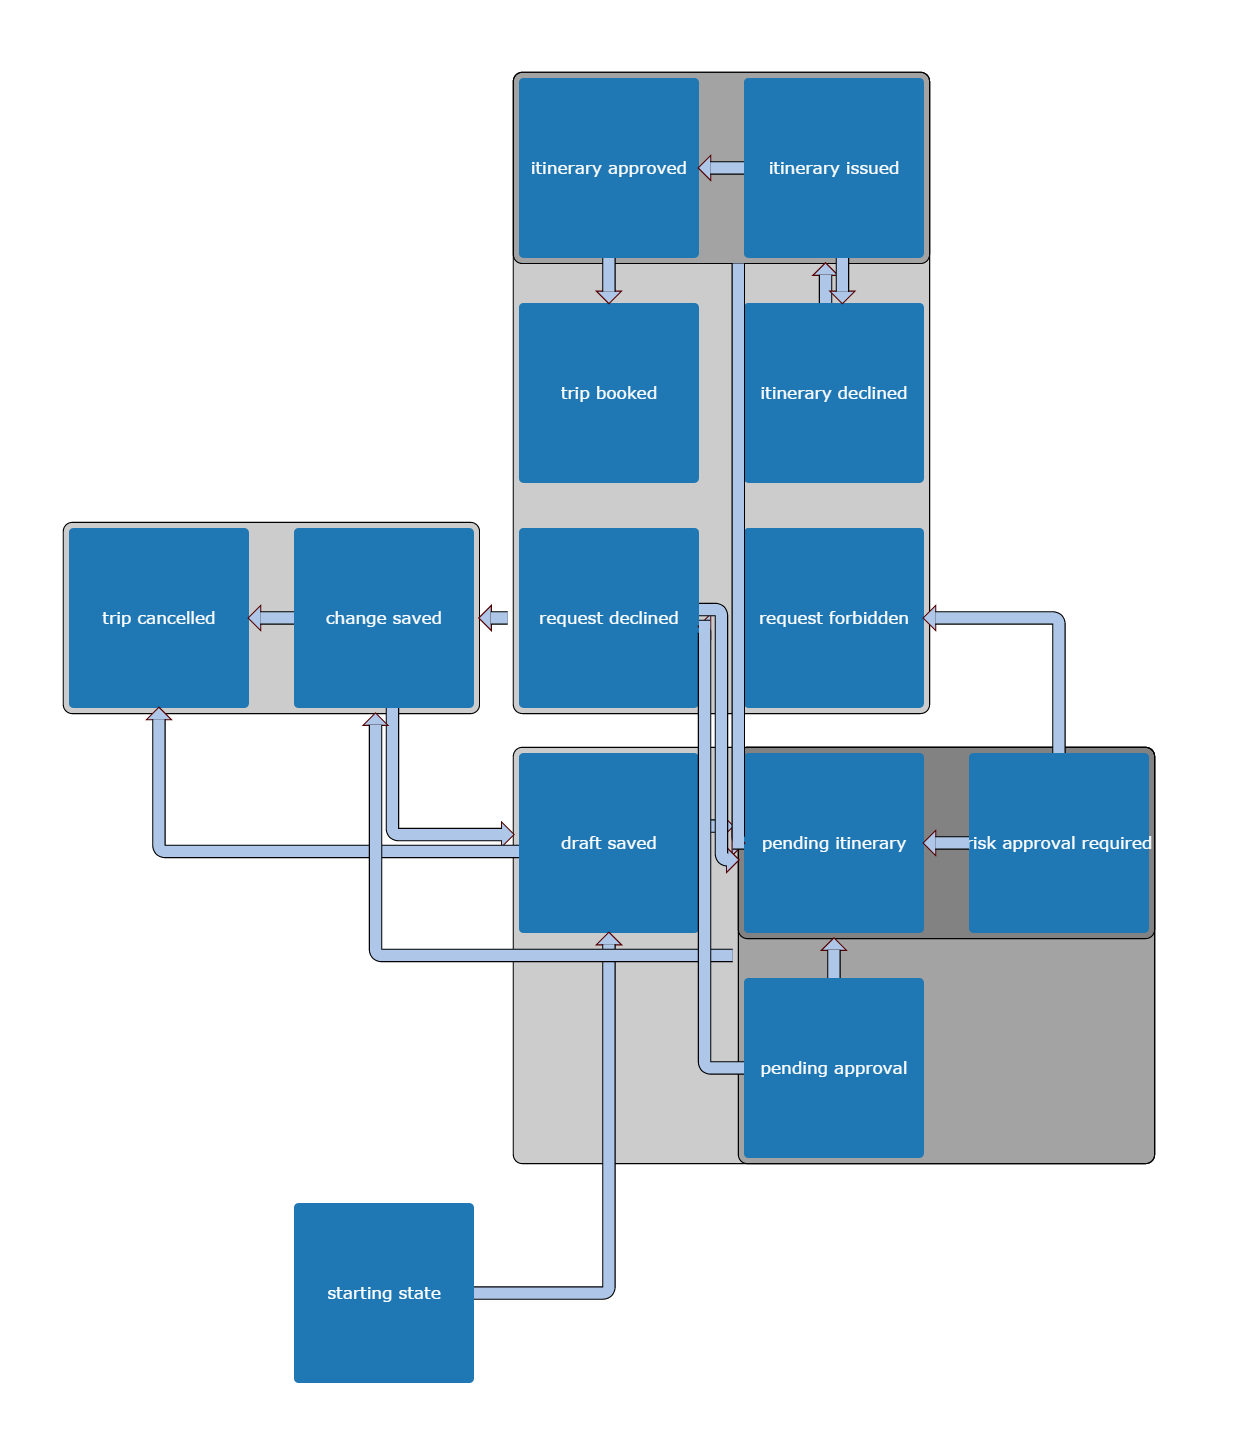 The state-machine graph drawn using WebCola's grid-snap feature (https://github.com/tgdwyer/WebCola)
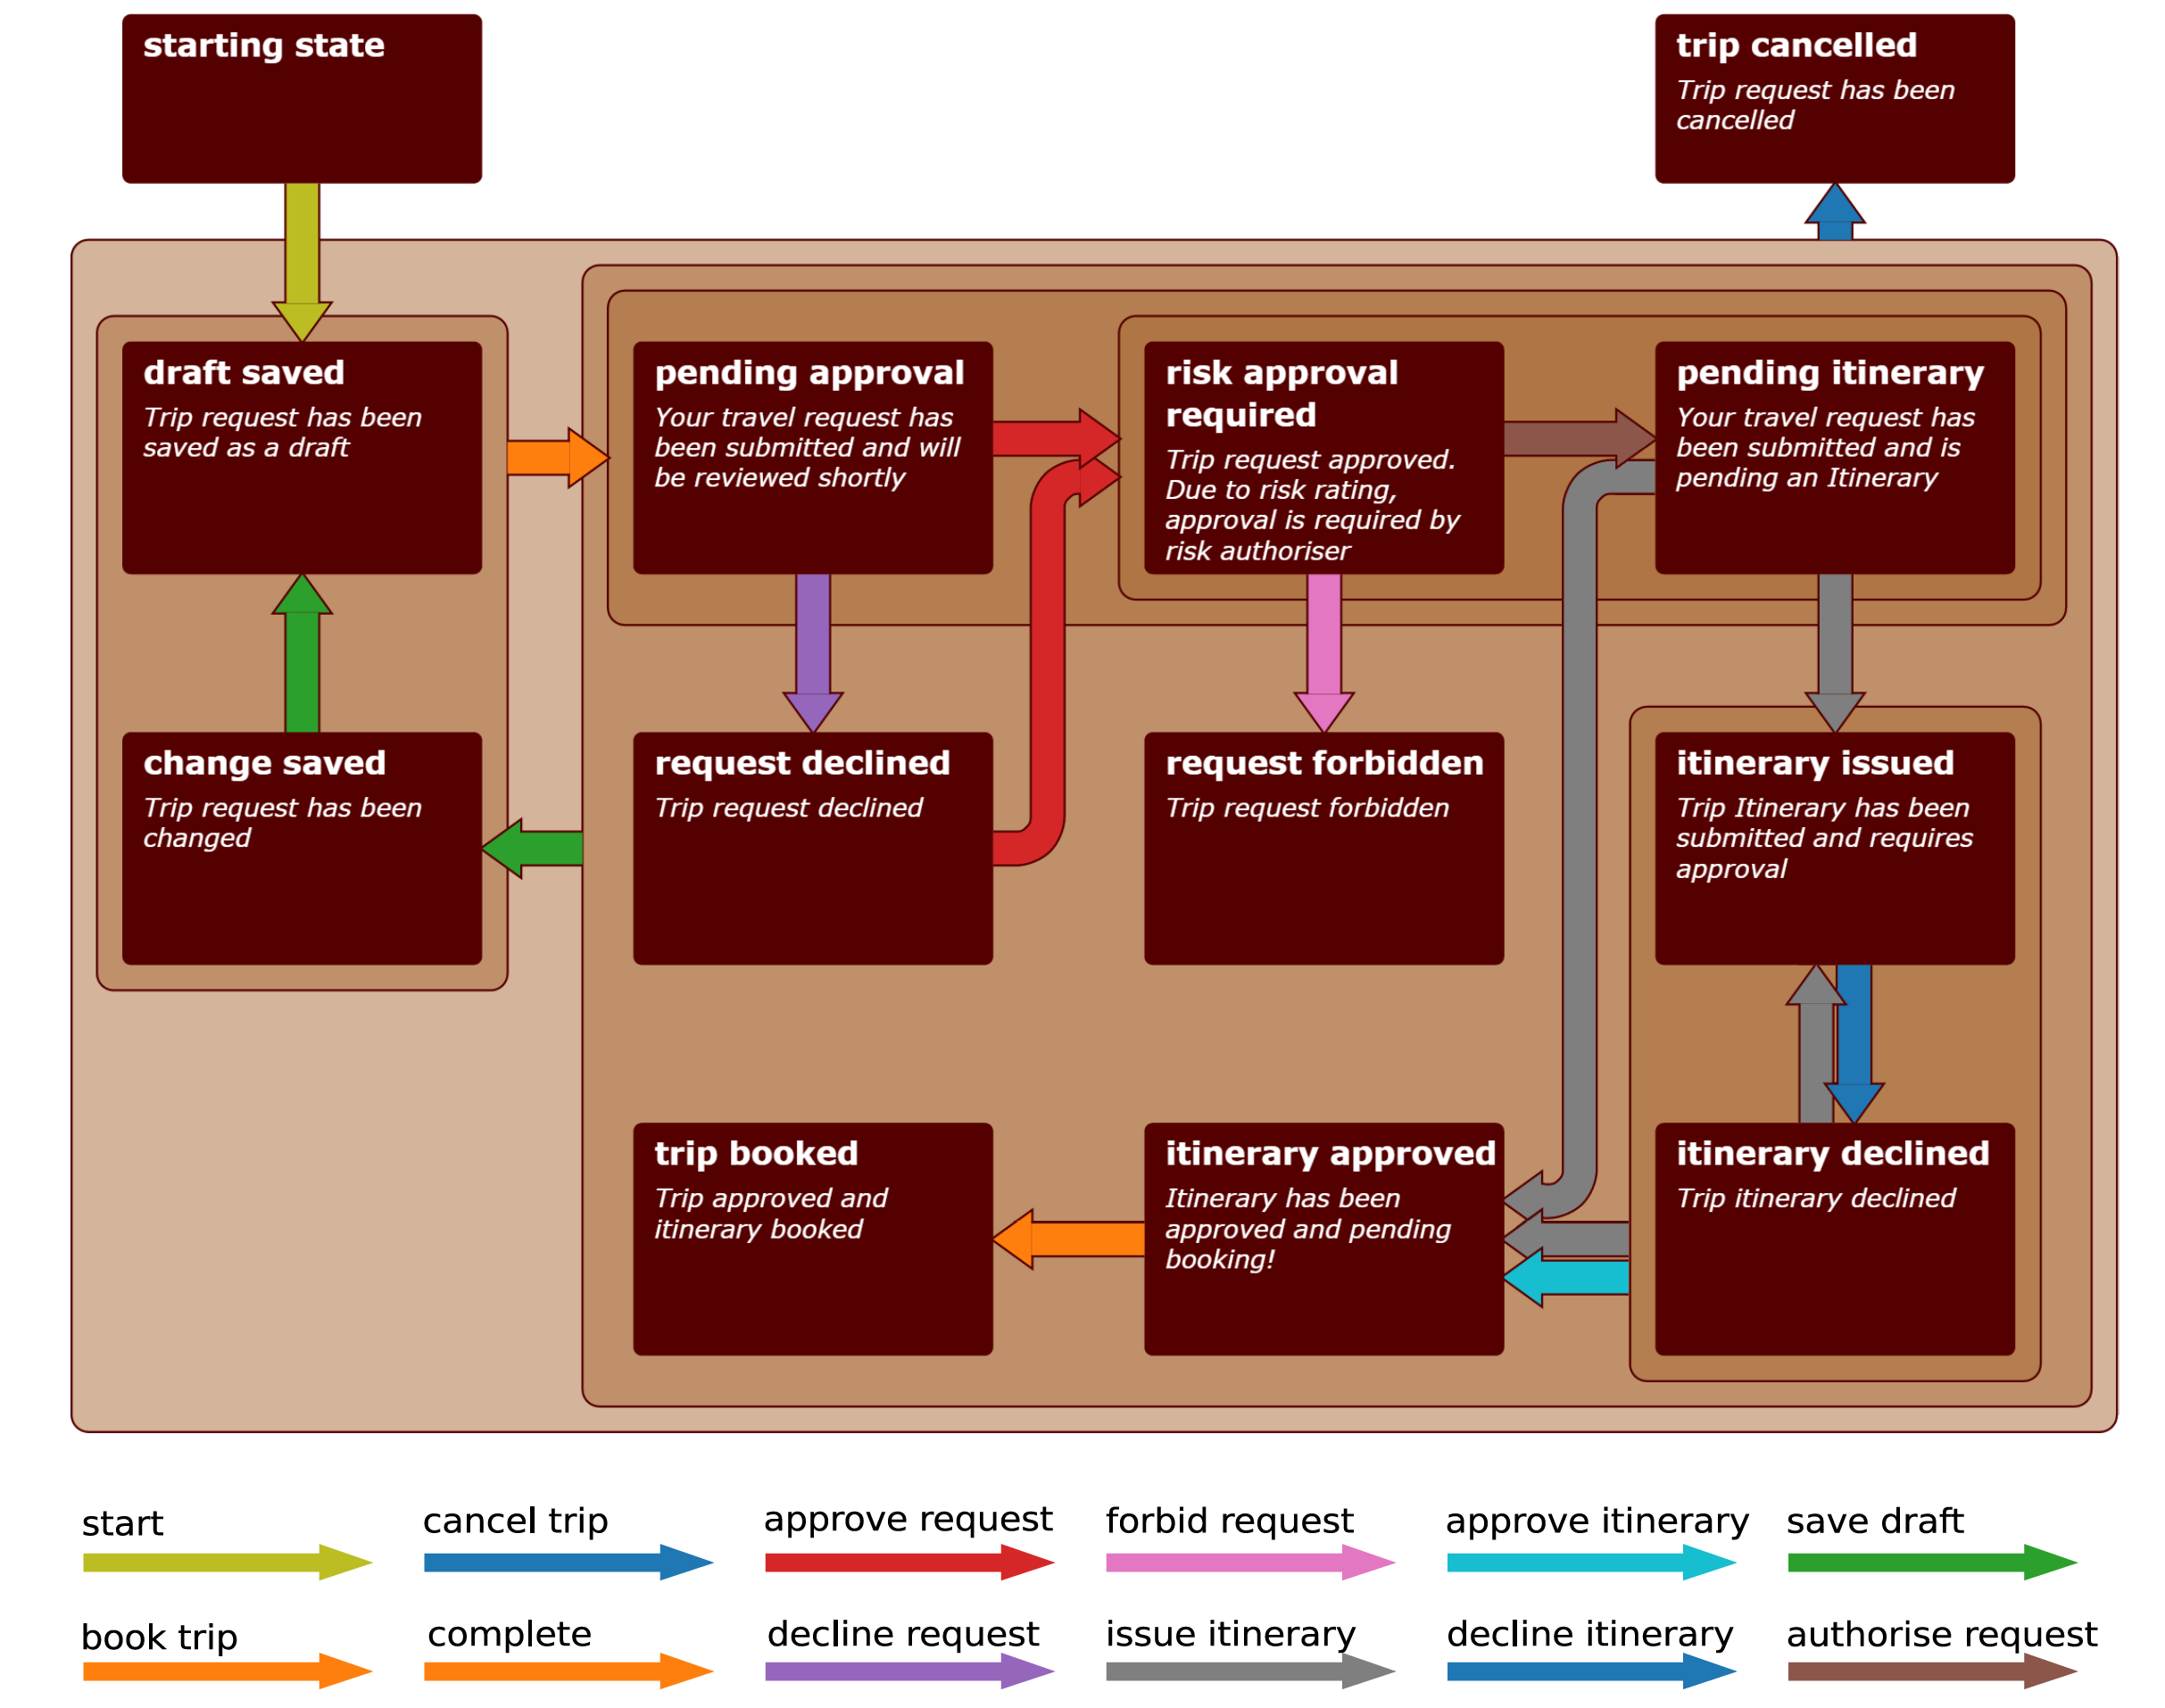 "Here is the same state-machine shown using our ultra-compact grid-based layout which has grid dimensions 4x4 leaving only three empty grid-cells. This optimally compact solution was found in 0.464 seconds using the SAT solver. Although we do not explicitly minimise bends or crossings, our layout is equal to the TSM output in these respects and significantly reduces the overall area and edge-length. With the additional node area we are able to include more detailed descriptions of each state."
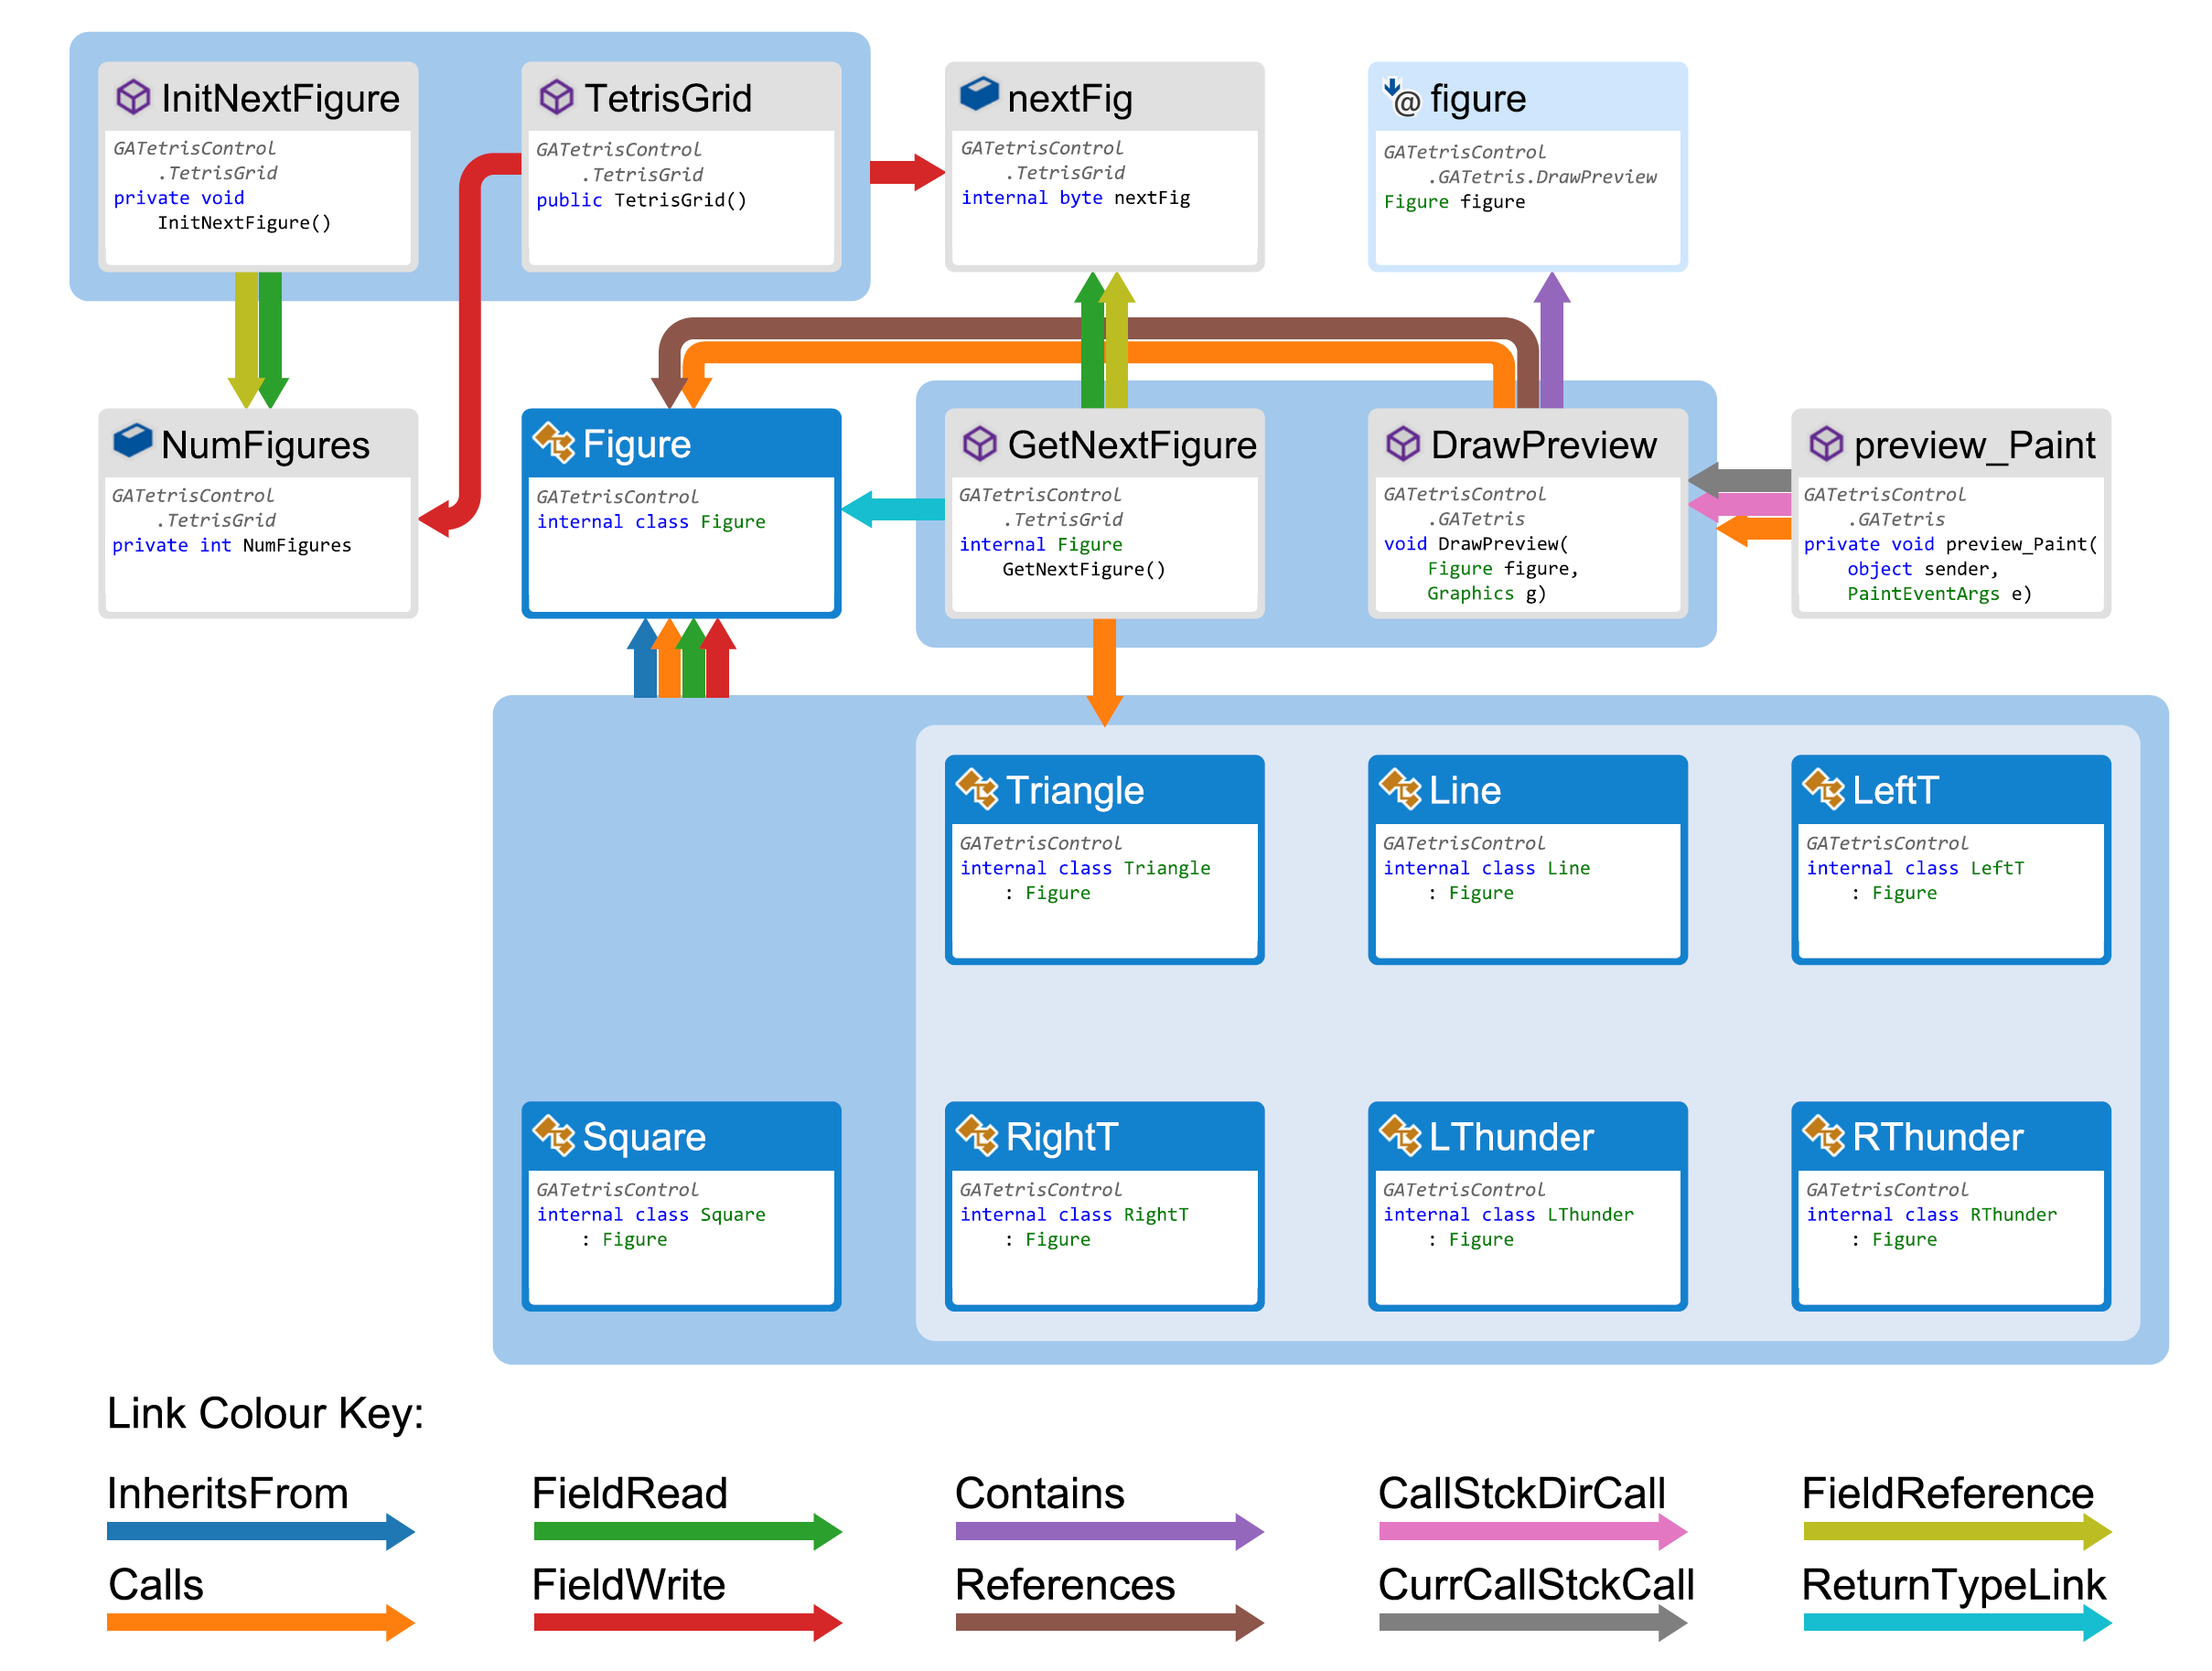 "An example software-dependency graph with routing detail and the final result. Solved in 0.732 seconds with the SAT solver. This network shows dependencies between types, methods and properties in C# code and was obtained in a debugging scenario using the Visual Studio Code Map tool. This layout neatly illustrates the cause of the bug: that Square is the only sub-class of Figure not created by the GetNextFigure method. Code snippets and icons on each of the nodes give added context."
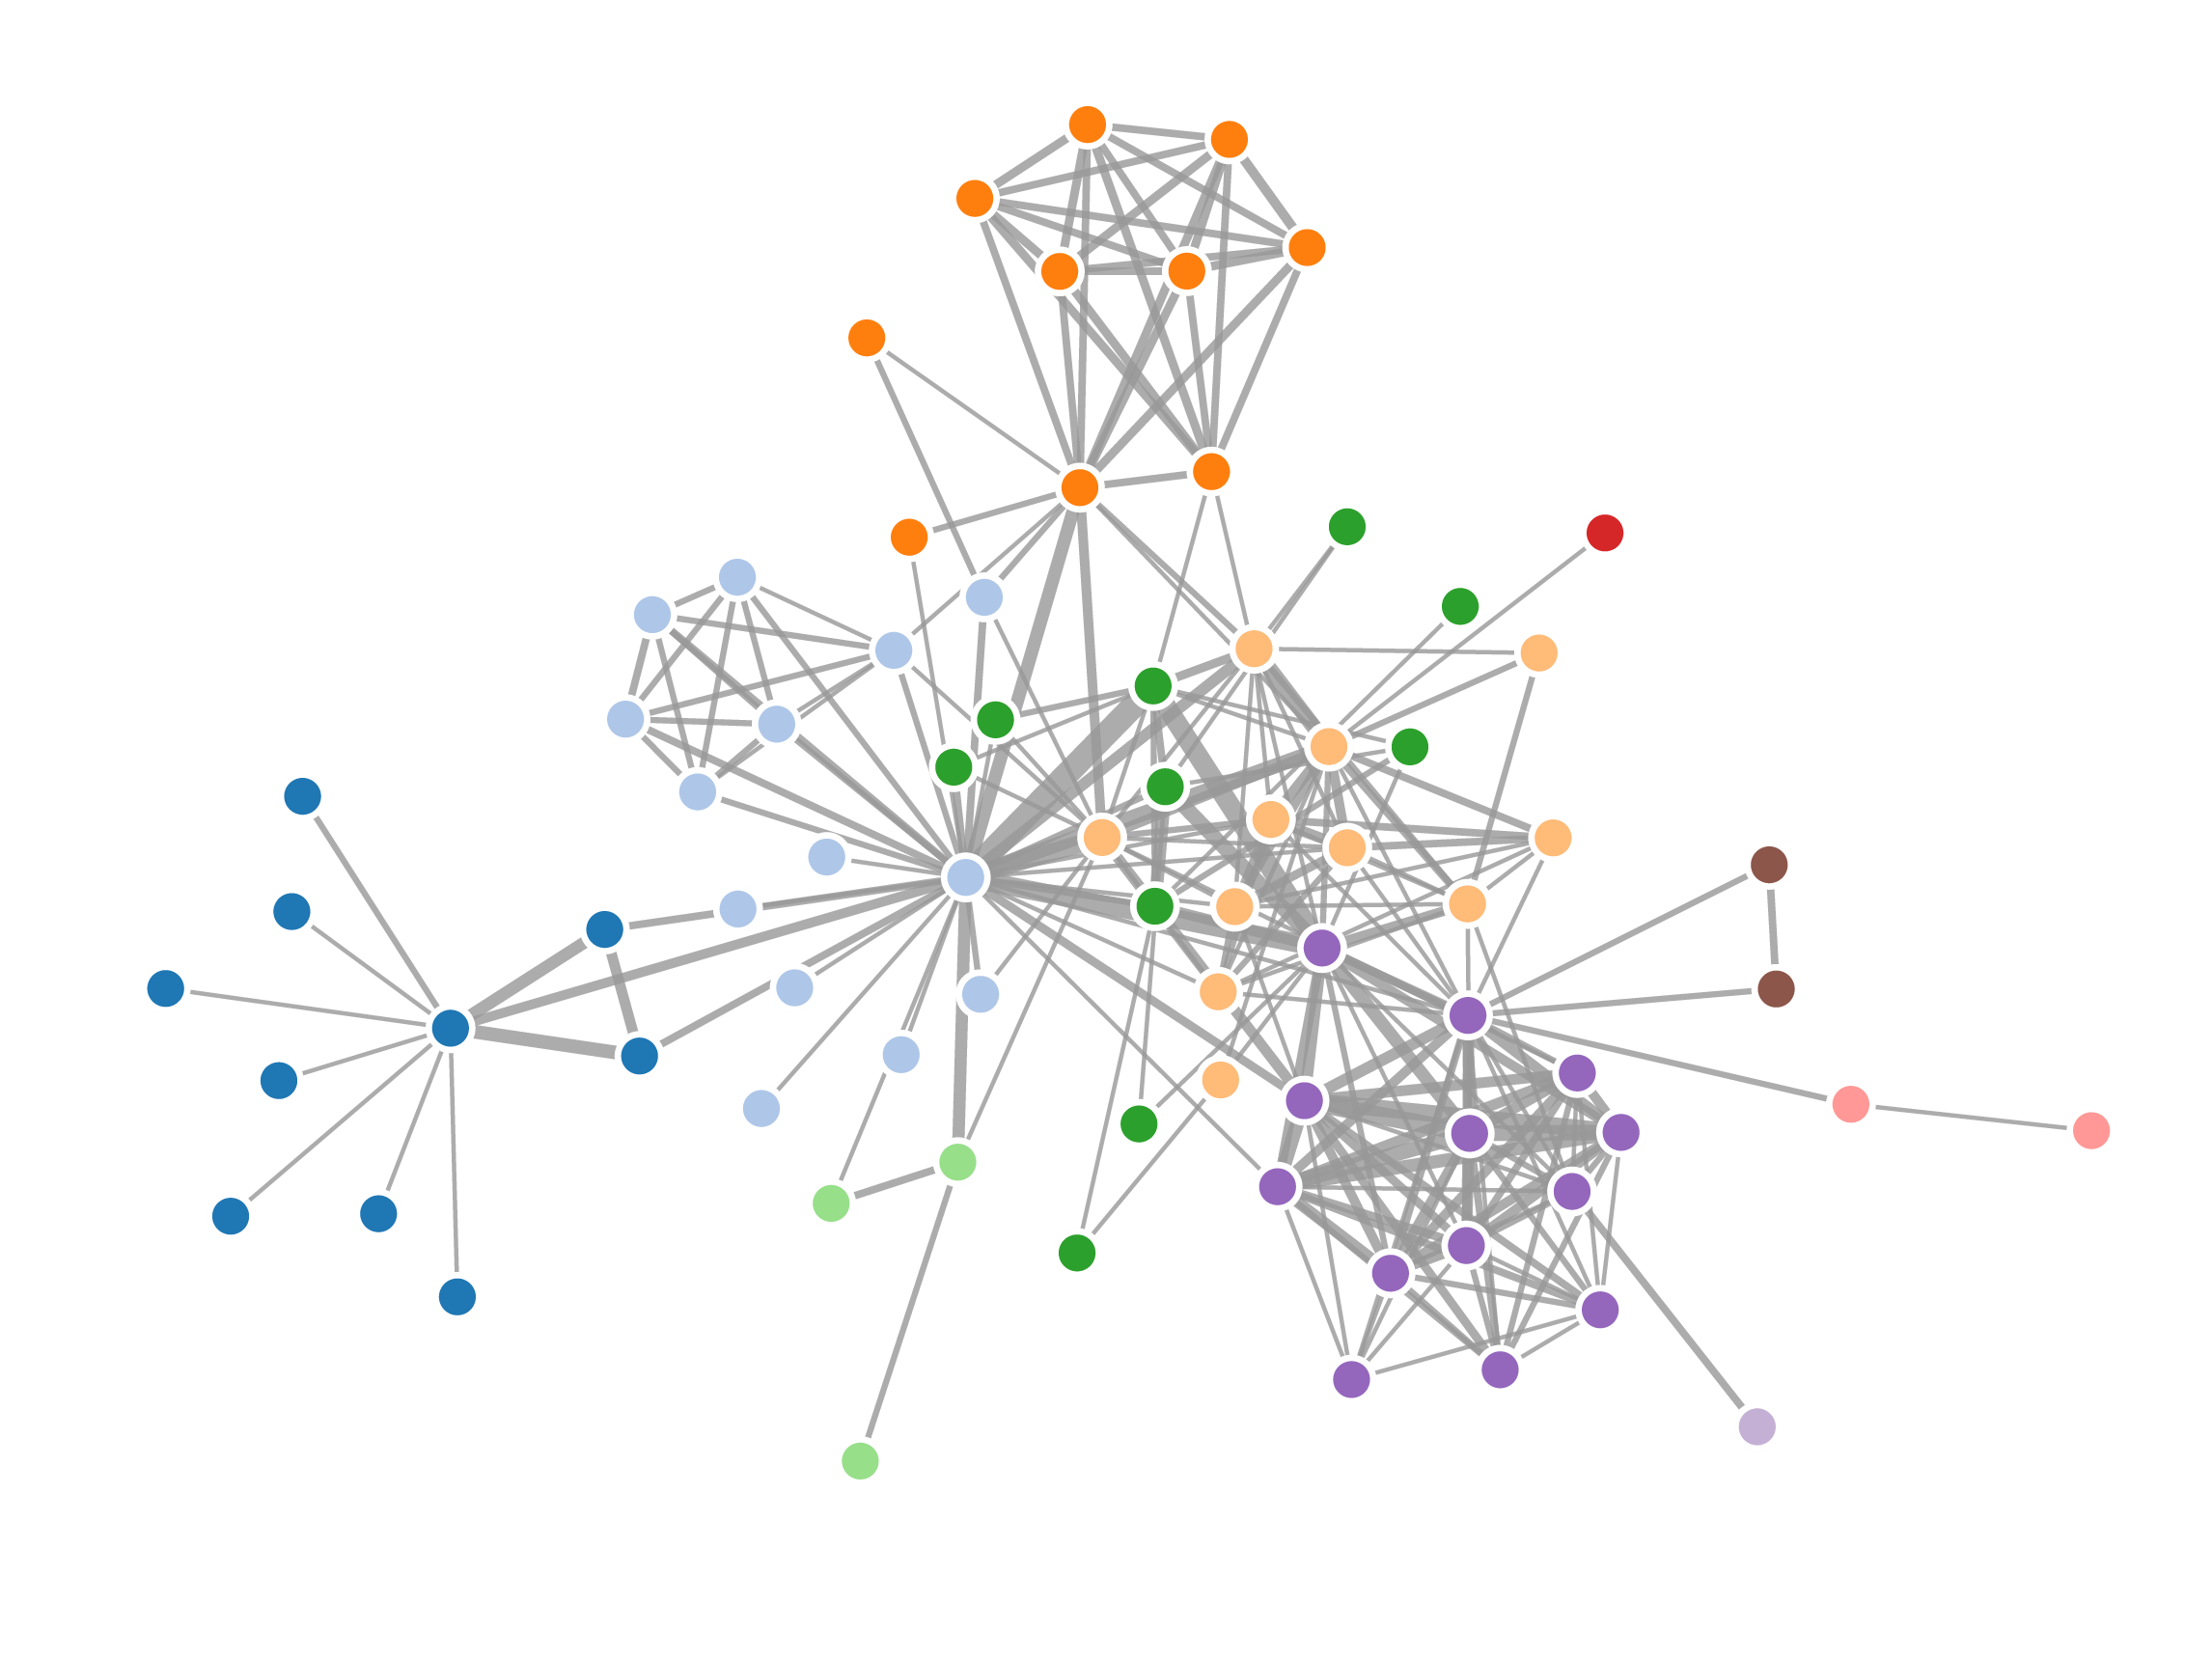
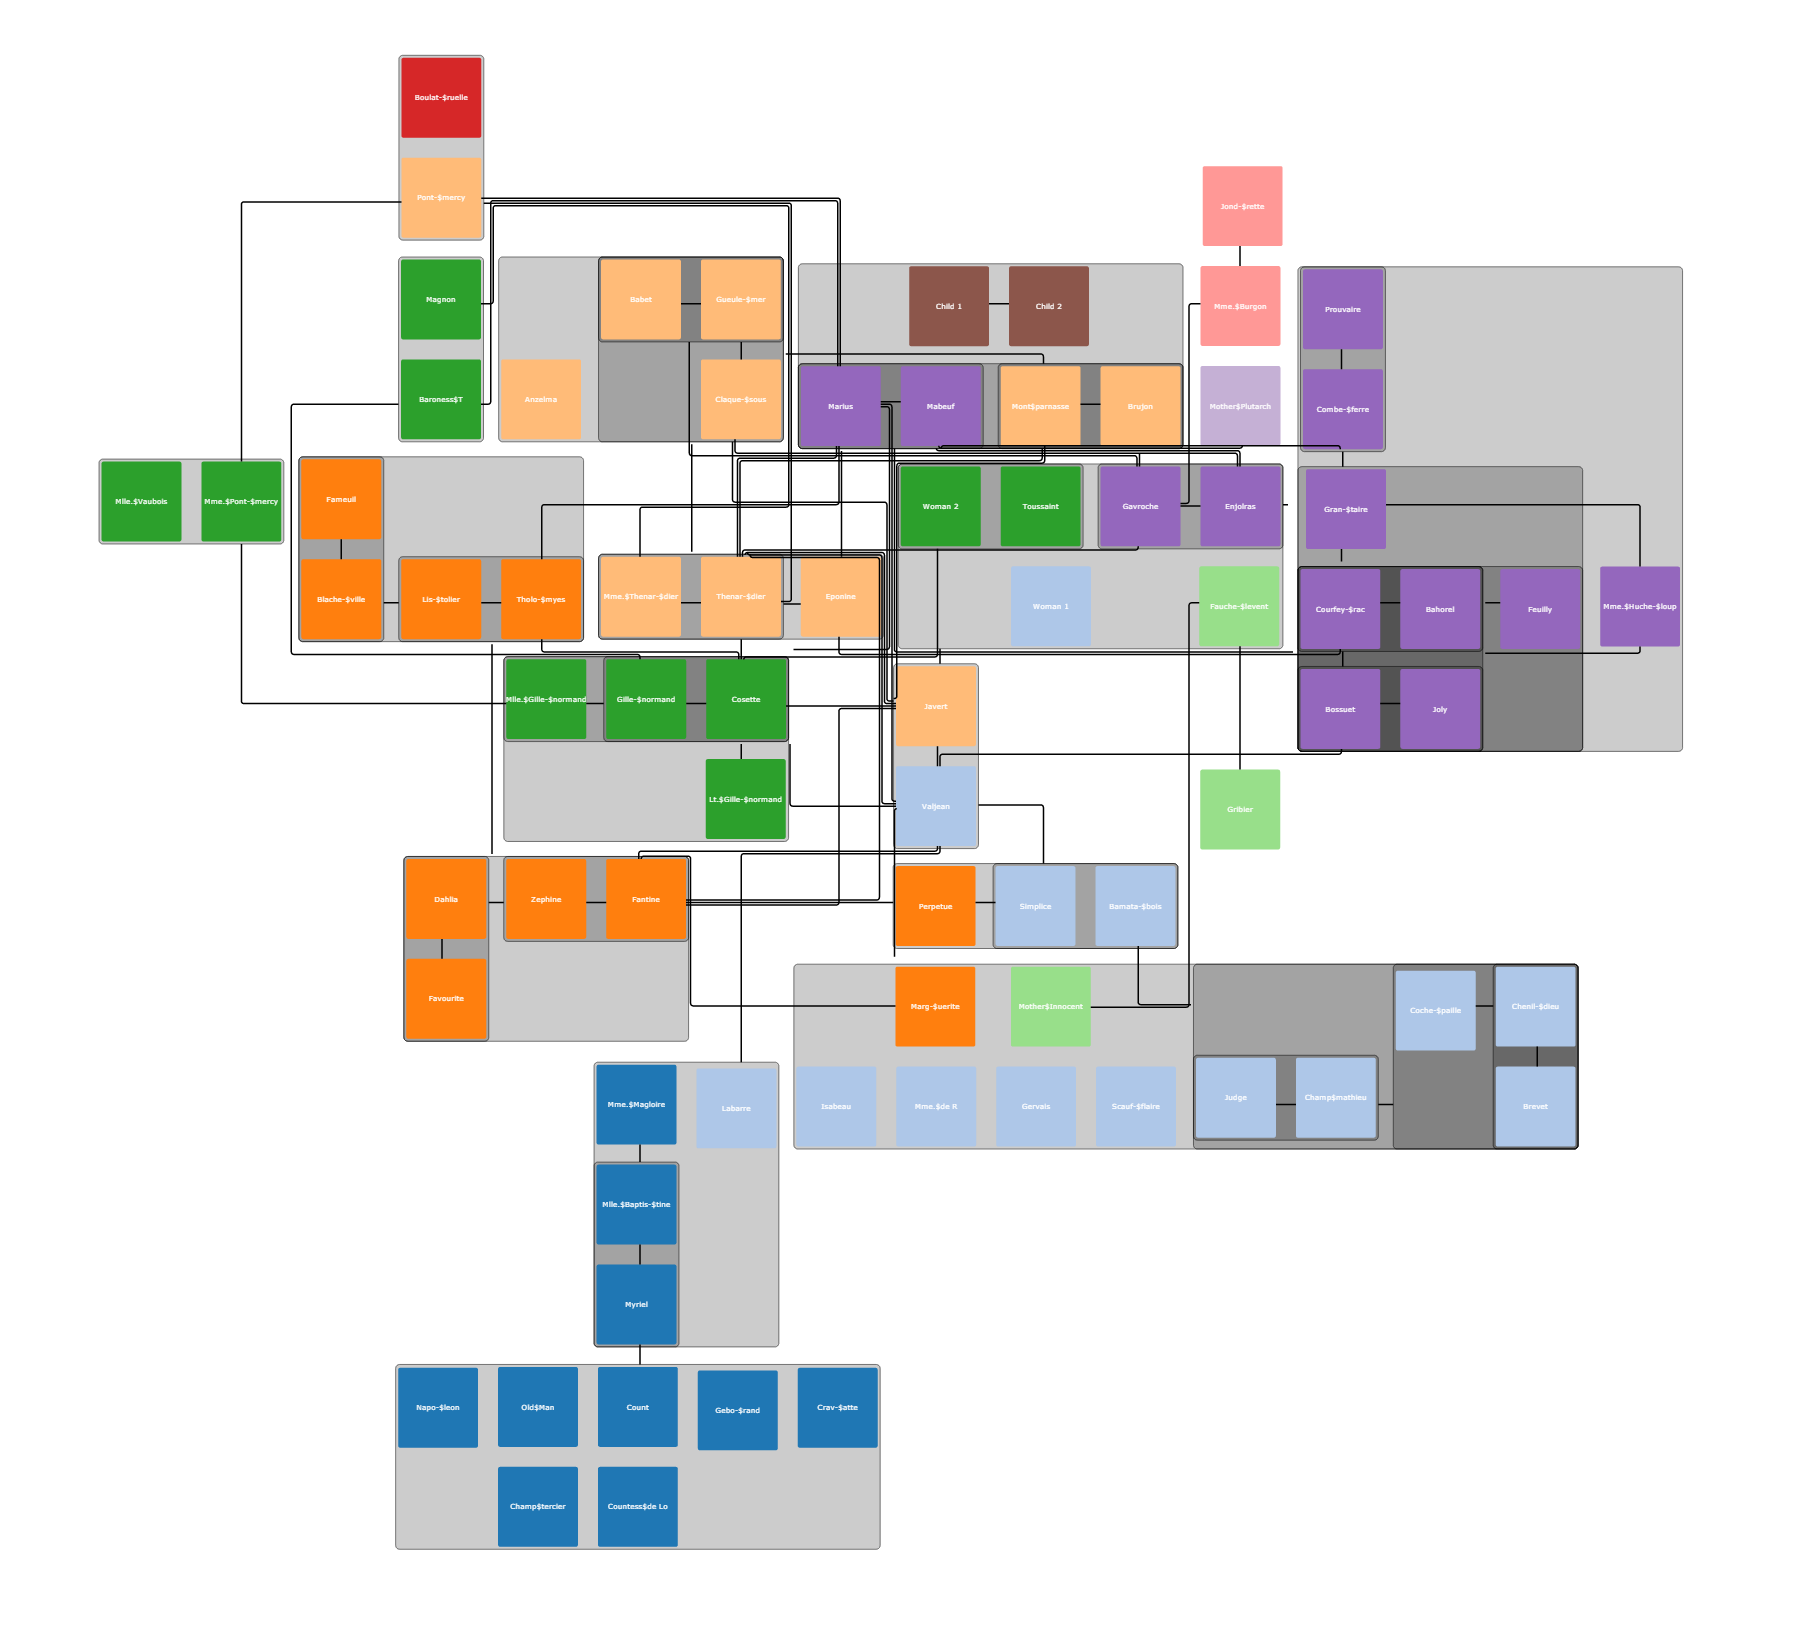
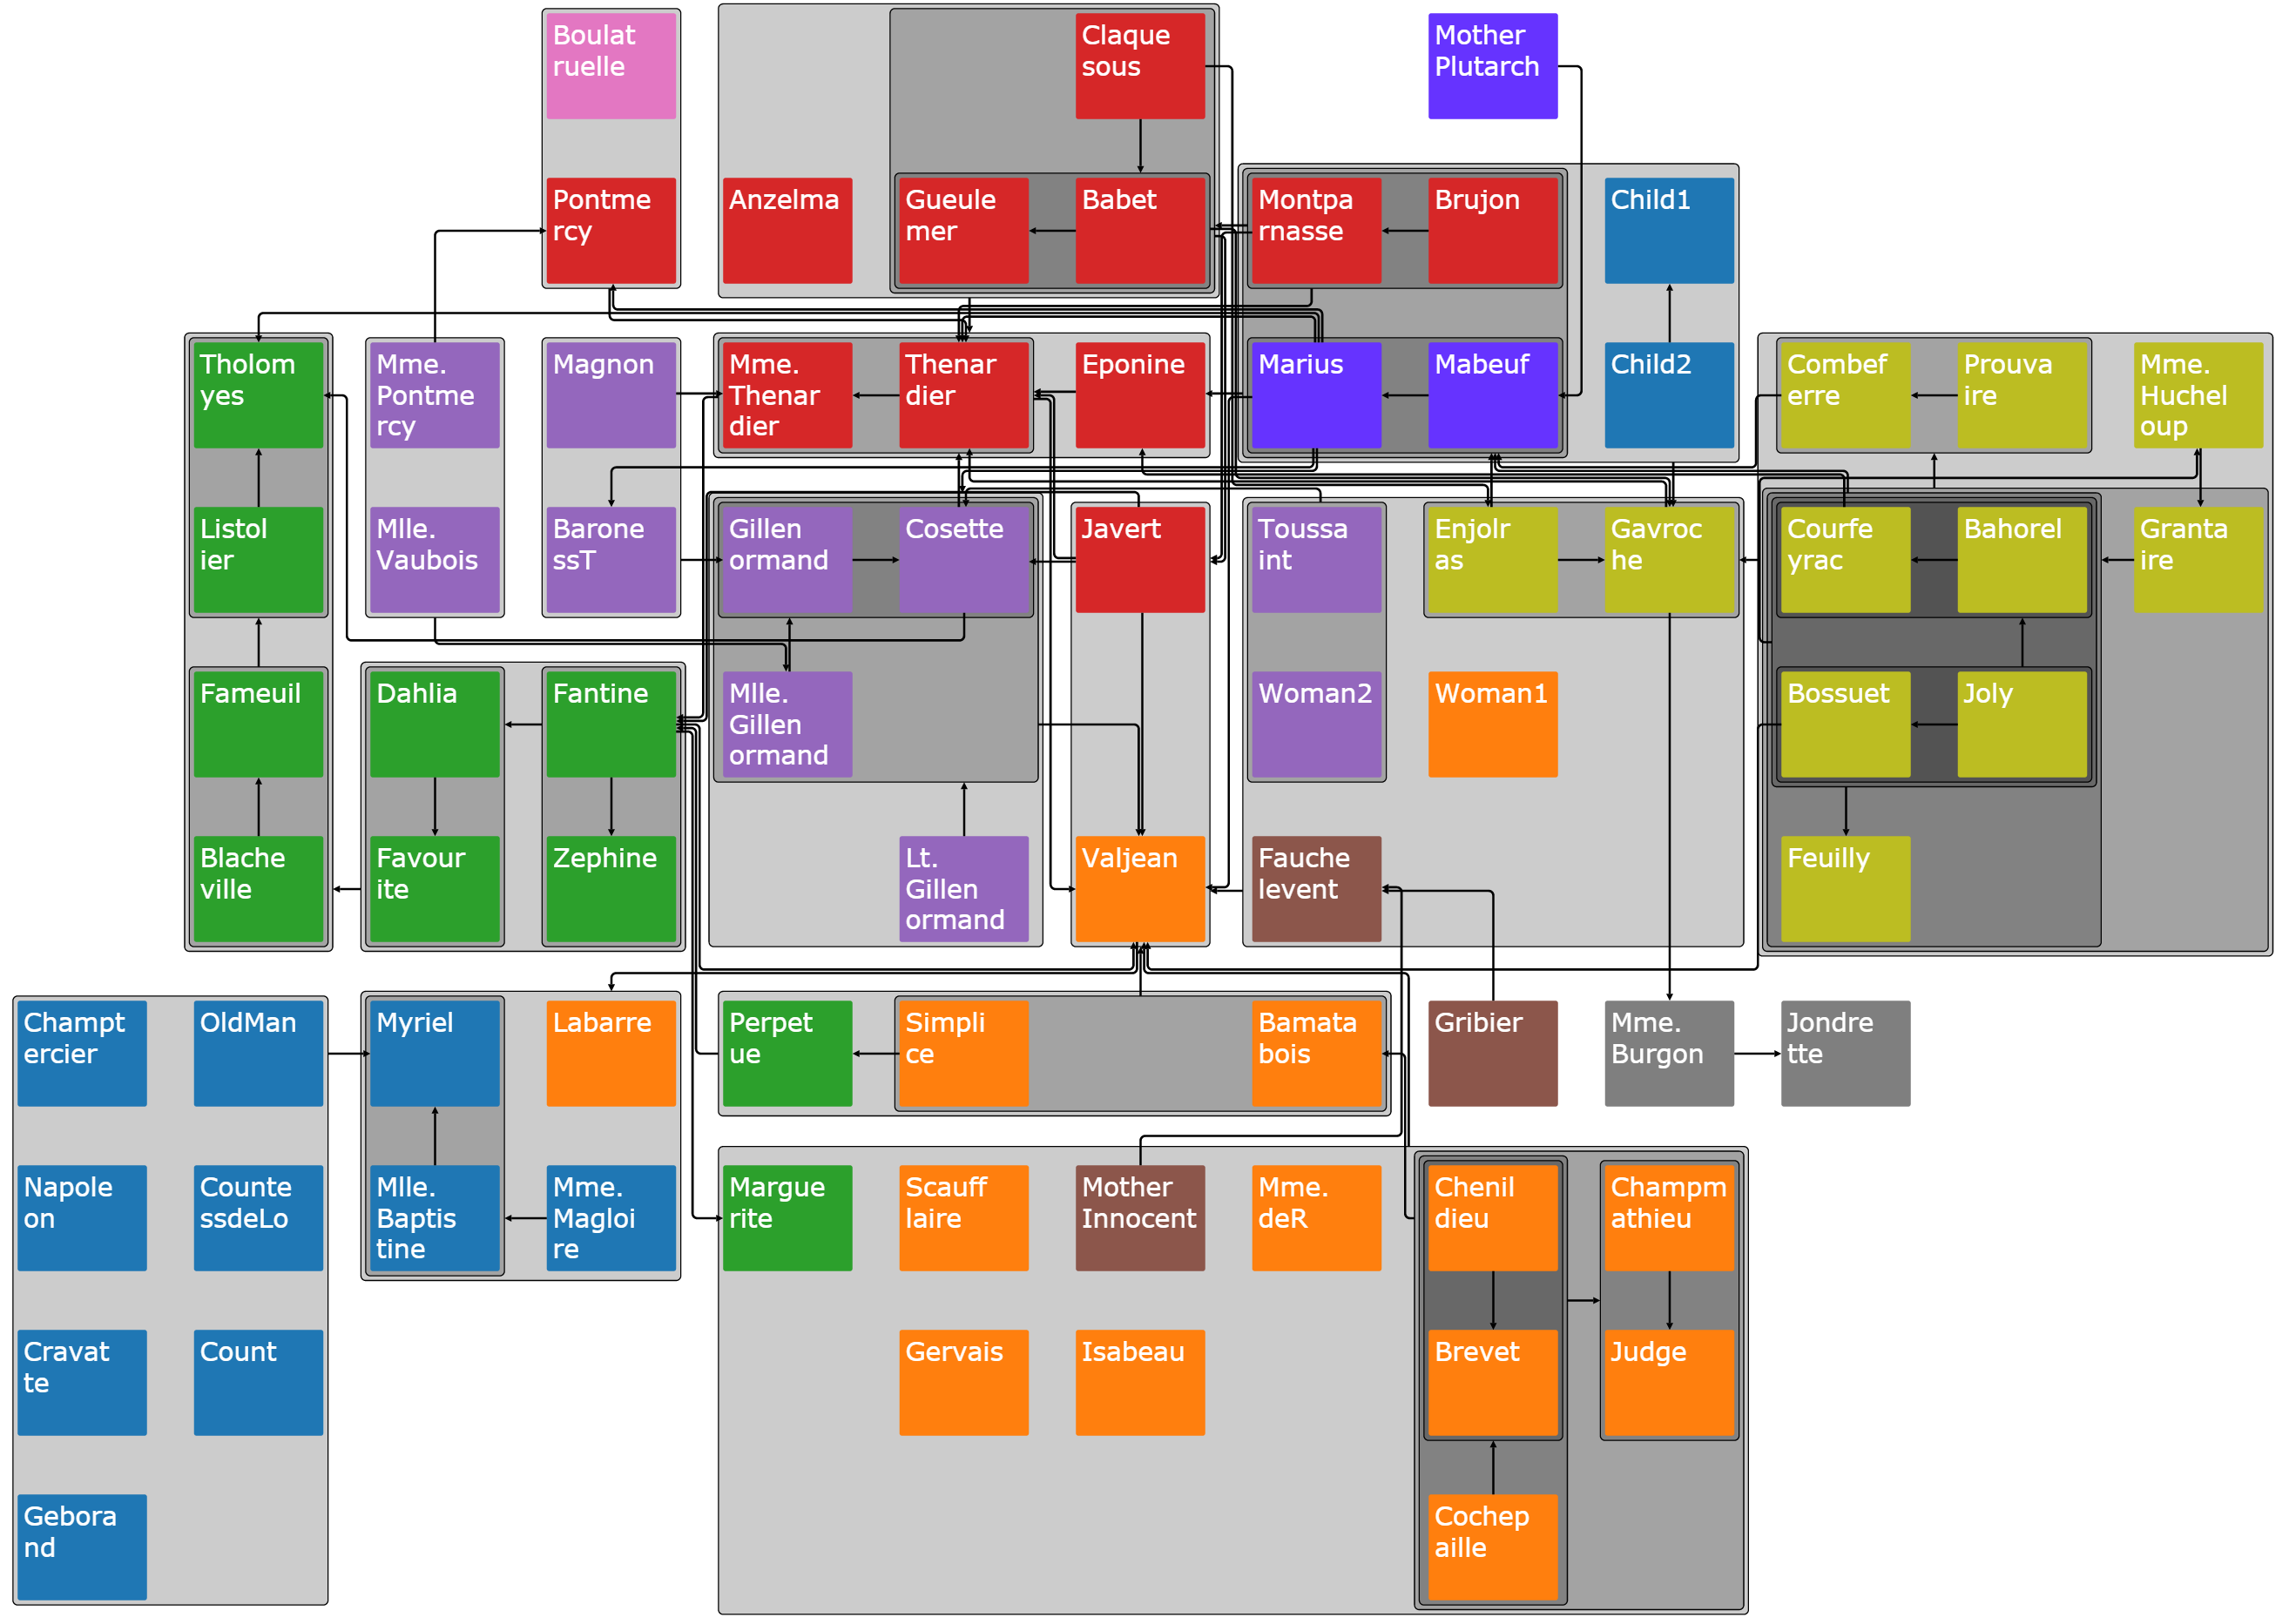
The characters from Les-Miserables represented as nodes. Characters that appear in the same scene are connected. The colouring is based on communities.
 Drawn using WebCola (https://github.com/tgdwyer/WebCola)
 Drawn using WebCola's grid-snap feature (https://github.com/tgdwyer/WebCola)
 Layout solved using CPLEX with LNS and to 473.61 seconds to solve.

