Coder Social home page Coder Social logo

optuna / optuna-dashboard Goto Github PK

View Code? Open in Web Editor NEW
448.0 448.0 82.0 12.8 MB

Real-time Web Dashboard for Optuna.

Home Page: https://optuna-dashboard.readthedocs.io/en/latest/

License: Other

Python 38.85% TypeScript 58.95% JavaScript 0.95% Dockerfile 0.25% Shell 0.01% HTML 0.65% Makefile 0.21% Rust 0.13%
dashboard hyperparameter-optimization optuna

optuna-dashboard's Introduction

Optuna: A hyperparameter optimization framework

Python pypi conda GitHub license Read the Docs Codecov

๐Ÿ”— Website | ๐Ÿ“ƒ Docs | โš™๏ธ Install Guide | ๐Ÿ“ Tutorial | ๐Ÿ’ก Examples

Optuna is an automatic hyperparameter optimization software framework, particularly designed for machine learning. It features an imperative, define-by-run style user API. Thanks to our define-by-run API, the code written with Optuna enjoys high modularity, and the user of Optuna can dynamically construct the search spaces for the hyperparameters.

๐Ÿ”ฅ Key Features

Optuna has modern functionalities as follows:

Basic Concepts

We use the terms study and trial as follows:

  • Study: optimization based on an objective function
  • Trial: a single execution of the objective function

Please refer to the sample code below. The goal of a study is to find out the optimal set of hyperparameter values (e.g., regressor and svr_c) through multiple trials (e.g., n_trials=100). Optuna is a framework designed for automation and acceleration of optimization studies.

Sample code with scikit-learn

Open in Colab

import ...

# Define an objective function to be minimized.
def objective(trial):

    # Invoke suggest methods of a Trial object to generate hyperparameters.
    regressor_name = trial.suggest_categorical('regressor', ['SVR', 'RandomForest'])
    if regressor_name == 'SVR':
        svr_c = trial.suggest_float('svr_c', 1e-10, 1e10, log=True)
        regressor_obj = sklearn.svm.SVR(C=svr_c)
    else:
        rf_max_depth = trial.suggest_int('rf_max_depth', 2, 32)
        regressor_obj = sklearn.ensemble.RandomForestRegressor(max_depth=rf_max_depth)

    X, y = sklearn.datasets.fetch_california_housing(return_X_y=True)
    X_train, X_val, y_train, y_val = sklearn.model_selection.train_test_split(X, y, random_state=0)

    regressor_obj.fit(X_train, y_train)
    y_pred = regressor_obj.predict(X_val)

    error = sklearn.metrics.mean_squared_error(y_val, y_pred)

    return error  # An objective value linked with the Trial object.

study = optuna.create_study()  # Create a new study.
study.optimize(objective, n_trials=100)  # Invoke optimization of the objective function.

Note

More examples can be found in optuna/optuna-examples.

The examples cover diverse problem setups such as multi-objective optimization, constrained optimization, pruning, and distributed optimization.

Installation

Optuna is available at the Python Package Index and on Anaconda Cloud.

# PyPI
$ pip install optuna
# Anaconda Cloud
$ conda install -c conda-forge optuna

Important

Optuna supports Python 3.7 or newer.

Also, we provide Optuna docker images on DockerHub.

Integrations

Optuna has integration features with various third-party libraries. Integrations can be found in optuna/optuna-integration and the document is available here.

Supported integration libraries

Web Dashboard

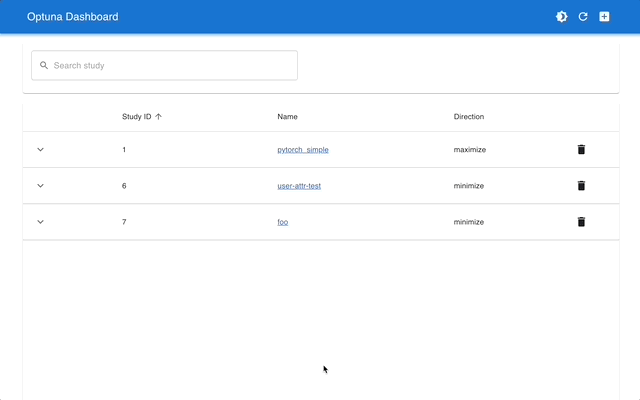
Optuna Dashboard is a real-time web dashboard for Optuna. You can check the optimization history, hyperparameter importance, etc. in graphs and tables. You don't need to create a Python script to call Optuna's visualization functions. Feature requests and bug reports are welcome!

optuna-dashboard

optuna-dashboard can be installed via pip:

$ pip install optuna-dashboard

Tip

Please check out the convenience of Optuna Dashboard using the sample code below.

Sample code to launch Optuna Dashboard

Save the following code as optimize_toy.py.

import optuna


def objective(trial):
    x1 = trial.suggest_float("x1", -100, 100)
    x2 = trial.suggest_float("x2", -100, 100)
    return x1 ** 2 + 0.01 * x2 ** 2


study = optuna.create_study(storage="sqlite:///db.sqlite3")  # Create a new study with database.
study.optimize(objective, n_trials=100)

Then try the commands below:

# Run the study specified above
$ python optimize_toy.py

# Launch the dashboard based on the storage `sqlite:///db.sqlite3`
$ optuna-dashboard sqlite:///db.sqlite3
...
Listening on http://localhost:8080/
Hit Ctrl-C to quit.

Communication

Contribution

Any contributions to Optuna are more than welcome!

If you are new to Optuna, please check the good first issues. They are relatively simple, well-defined, and often good starting points for you to get familiar with the contribution workflow and other developers.

If you already have contributed to Optuna, we recommend the other contribution-welcome issues.

For general guidelines on how to contribute to the project, take a look at CONTRIBUTING.md.

Reference

If you use Optuna in one of your research projects, please cite our KDD paper "Optuna: A Next-generation Hyperparameter Optimization Framework":

BibTeX
@inproceedings{akiba2019optuna,
  title={{O}ptuna: A Next-Generation Hyperparameter Optimization Framework},
  author={Akiba, Takuya and Sano, Shotaro and Yanase, Toshihiko and Ohta, Takeru and Koyama, Masanori},
  booktitle={The 25th ACM SIGKDD International Conference on Knowledge Discovery \& Data Mining},
  pages={2623--2631},
  year={2019}
}

optuna-dashboard's People

Contributors

2403hwaseer avatar adjeiv avatar alnusjaponica avatar c-bata avatar chenghuzi avatar contramundum53 avatar cross32768 avatar dependabot[bot] avatar eukaryo avatar gen740 avatar hideakiimamura avatar himkt avatar hrntsm avatar iwiwi avatar keisuke-umezawa avatar kenrota avatar knshnb avatar moririn2528 avatar msakai avatar nabenabe0928 avatar not522 avatar pnkov avatar porink0424 avatar simonhessner avatar toshihikoyanase avatar turbotimon avatar y0z avatar yoshinobc avatar yuigawada avatar zchenry avatar

Stargazers

 avatar  avatar  avatar  avatar  avatar  avatar  avatar  avatar  avatar  avatar  avatar  avatar  avatar  avatar  avatar  avatar  avatar  avatar  avatar  avatar  avatar  avatar  avatar  avatar  avatar  avatar  avatar  avatar  avatar  avatar  avatar  avatar  avatar  avatar  avatar  avatar  avatar  avatar  avatar  avatar  avatar  avatar  avatar  avatar  avatar  avatar  avatar  avatar  avatar  avatar  avatar  avatar  avatar  avatar  avatar  avatar  avatar  avatar  avatar  avatar  avatar  avatar  avatar  avatar  avatar  avatar  avatar  avatar  avatar  avatar  avatar  avatar  avatar  avatar  avatar  avatar  avatar  avatar  avatar  avatar  avatar  avatar  avatar  avatar  avatar  avatar  avatar  avatar  avatar  avatar  avatar  avatar  avatar  avatar  avatar  avatar  avatar  avatar  avatar  avatar

Watchers

 avatar  avatar  avatar  avatar  avatar  avatar  avatar  avatar

optuna-dashboard's Issues

[Bug] Wrong nummeric sorting of study trials

2021-01-15-101022_1227x449_scrot

Bug report

When I sort the study trials by value, the values are sorted as string, instead of as number

Expected Behavior

Correct numeric sorting

Current Behavior and Steps to Reproduce

Create a study with a bunch of trials, where the trials have values with different number of digits. Then sort by value to obtain a view like in the screenshot above

Context

optuna-dashboard installed via pip

Failed to fetch study (id=1)

Description

Everything works fine, then at a certain point I start getting this error message when trying to look at one study, and from that moment that study would load anymore (while I will still be able to see other studies).

This is just a problem of the dashboard, because from Python I will still be able to load and look at studies, and also to train more models on them.

I am using the SQLite backend.

I am not sure what causes the bug, but while I was running an hyperparameters optimization for two studies at a certain point I have noticed the error messages shown on the screenshot on the console of the optimization process of one of the two studies. From around that moment I started getting the above error message in that study (while the other study remained accessible).
Notices that the memntioned error message don't affect the training of the model or the optimization process. Also after a few epochs it disappeared.

Extra details: once I got a similar error message also when loading the homepage. I had to create a new .sqlite study. Not sure if the problem is related to the one above.

Screen Shot

How to Reproduce

  1. Optuna's objective function is 'validation_elbo' (a float to minimize).
  2. Run optuna-dashboard with 'optuna-dashboard sqlite:///optuna.sqlite --port 8798'
  3. go to the optuna dashboard homepage, then click on the name of a study to enter
  4. everything works fine, then at a certain point the error message above will appear (see above for discussion); from that moment the study will be not accessible from the dashboard (while other studies will remain accessible)

Python version

3.8.5

Optuna version

2.9.1

optuna-dashboard version or git revision

0.4.2

Web browser

Google Chrome, Firefox and Safari

Api call returns always cached data [Bug]

Bug reports

The api call to http://localhost:8080/api/studies/1 always returns the result from the first call since it gets cached and the cache is never invalidated.

Expected Behavior

Invalidate the cache every 10 seconds and return new values.

Current Behavior and Steps to Reproduce

Currently the dashboard will not update after initialization.

Context

Please provide any relevant information about your setup.
This is important in case the issue is not reproducible except for under certain conditions.

Optuna version 2.4

  • optuna-dashboard --version: 0.2.1

RFC 7807 compliant error response.

RFC 7807 defines a "problem detail" as a way to carry machine-readable details of errors in an HTTP response to avoid the need to define new error response formats for HTTP APIs like the following:

HTTP/1.1 400 Bad Request
Content-Type: application/problem+json
Content-Language: en

{
   "type": "https://example.net/validation-error",
   "title": "Your request parameters didn't validate.",
   "invalid-params": [
       {
         "name": "age",
         "reason": "must be a positive integer"
       },
       {
         "name": "color",
         "reason": "must be 'green', 'red' or 'blue'"
       }
   ]
}

See https://tools.ietf.org/html/rfc7807 for details.

How to connect optuna

study = optuna.create_study(
direction="maximize", study_name="LGBM Classifier", storage="sqlite:///opt.db",
)
study.optimize(objective, n_trials=5)

optuna-dashboard sqlite:///opt.db

WHY???

image

Empty Dashboard (duplicate of https://github.com/optuna/optuna/issues/2338)

Bug reports

Using Optuna 2.7.0 and optuna-dashboard 0.4.1, I see nothing in the dashboard. There are trials in the study database.

Expected Behavior

I expected to see information rather than a blank dashboard.

Current Behavior and Steps to Reproduce

Populate a database, then run the following command:
optuna-dashboard "sqlite:///database_name.db ![Empty_Optuna_Dashboard](https://user-images.githubusercontent.com/11823408/118311106-77ffbf00-b4bd-11eb-905d-e352f702b1eb.JPG) "

Context

  • python -c 'import optuna; print(optuna.__version__)': 2.7.0
  • optuna-dashboard --version: 0.4.1

Additional units to the Duration column ?

Currently, the duration is expressed in ms. However, sometime it can be quite inconvenient:
image

Would it be possible to add a mechanism for additional unit? Ex: Hours :)

Dashboard doesn't load if any of the trials have "Infinity" values

Bug reports

In an Optuna study, if any of the trials returns Infinity (Inf) values, the dashboard does not load, a message saying "Failed to fetch study <study_id>" is shown on the lower left corner of the dashboard

Expected Behavior

Ignore the Infinity values and show the dashboard for other values.

Current Behavior and Steps to Reproduce

Open a study which has Inf values in at least one trial.

image

image

I tried accessing the API at /api/studies/<study_id>, which shows some Inf values, e.g. ... "values": [Infinity] ...

Other studies which do not have Inf values, load and work as expected.

Context

Please provide any relevant information about your setup.
This is important in case the issue is not reproducible except for under certain conditions.

  • python -c 'import optuna; print(optuna.__version__)': 2.8.0
  • optuna-dashboard --version: 0.4.2

UI based unit test & functional test libraries setup

Feature Request

I will recommend to add Test suits/framework on UI layer for unit and functional testing during development.

As the dashboard is built using React, I will highly recommend to use the most popular test library @testing-library/react and jest to write unit tests for UI/Component layer and utility functions.

For functional tests, we could use Cypress.io.

I can start the contribution on the above work. Let me know your thoughts, I'm not sure if you guys have already planned this.

Failed to fetch study (id=1)

Hi!

I always get the error above and don't know how to solve it.
In the .db file stands: "Error! /Josef/CTGAN/CTGAN_tryout.db ist not UTF-8 encoded. Saving disabled. See Console for more details."
But the default value for encoding of the storage command should be UTF-8, isn't it?
I use a jupyter notebook for running the code.
Thanks in advance!

dashboard inside of the jupyterlab

This is more like a question rather than feature request.

I am running a jupyterlab inside of docker container. just wonder if it's possible to use the dashboard inside of the jupyterlab. is there is anything jupyterlab extension that support it? Thanks a lot in advance.

Optuna v2.4.0 support

I guess this dashboard does not work with the next release of Optuna due to the changes for multi-objective optimizations.

  • Optuna v2.4.0 support
  • Plot history
  • Create multi-objective study

chart labels not fully visible

It is not possible to read the labels on yaxis and xaxis, full screen option for larger view of charts would be useful.

chart 1
char 2

Add x-axis labels to categorical slice plot

Feature Request

For categorical hyper-parameters, Tensorboard works pretty well because a person can see what the choices are on the x-axis. Please make the slice plot behave in a similar way, at least by labeling the x-axis for the categorical choices.

It currently looks like this:
Slice_no_x_axis_label

As you can see, there is no label on the x-axis so the choices of the categorical hyper-parameter pertaining to each column must be guessed/inferred another way.

How to populate study

Hi,
i am new to optuna dashboard. i have tensorboard logs for my trials but i don't understand how to populate optuna-dashboard with my study. Any help would be appreciated.

thanks.

Delete trial

Feature Request

Under special circumstances, some useless trials will be left behind, and we hope to delete them, for example, failed, terminated process, and so on. thx!

Do not reload graphs when zoomed in

Currently, when I zoom into a graph (e.g. intermediate values), the graph is reset as soon as the network fetch in the background completes (every 10s?).

It would be nice if:

  • there was a button to stop autoreload
  • or the graph interactions would be restored/kept across data reloads

Otherwise, I love it! Thank you so much for the project

Dashboard of a study throws JS error

Bug reports

I have an experiment running with a simple study, to which I manually suggested some parameters (via. enqueue_trial). After that trial was finished, I could still open http://127.0.0.1:8080 to show the list of all studies in my sqlite file, but as soon as I clicked that study, the browser briefly shows the familiar interface but immediately switches to a blank (white site). The console shows following error message:

TypeError: n.union_search_space is undefined
    Xc http://127.0.0.1:8080/static/bundle.js:2
    Yi http://127.0.0.1:8080/static/bundle.js:2
    xs http://127.0.0.1:8080/static/bundle.js:2
    fl http://127.0.0.1:8080/static/bundle.js:2
    cl http://127.0.0.1:8080/static/bundle.js:2
    rl http://127.0.0.1:8080/static/bundle.js:2
    Wa http://127.0.0.1:8080/static/bundle.js:2
    unstable_runWithPriority http://127.0.0.1:8080/static/bundle.js:2
    Ha http://127.0.0.1:8080/static/bundle.js:2
    Wa http://127.0.0.1:8080/static/bundle.js:2
    Ga http://127.0.0.1:8080/static/bundle.js:2
    yl http://127.0.0.1:8080/static/bundle.js:2
    unstable_runWithPriority http://127.0.0.1:8080/static/bundle.js:2
    Ha http://127.0.0.1:8080/static/bundle.js:2
    vl http://127.0.0.1:8080/static/bundle.js:2
    gl http://127.0.0.1:8080/static/bundle.js:2
    F http://127.0.0.1:8080/static/bundle.js:2
    onmessage http://127.0.0.1:8080/static/bundle.js:2
    53 http://127.0.0.1:8080/static/bundle.js:2
    r http://127.0.0.1:8080/static/bundle.js:2
    3840 http://127.0.0.1:8080/static/bundle.js:2
    r http://127.0.0.1:8080/static/bundle.js:2
    4448 http://127.0.0.1:8080/static/bundle.js:2
    r http://127.0.0.1:8080/static/bundle.js:2
    3935 http://127.0.0.1:8080/static/bundle.js:2
    r http://127.0.0.1:8080/static/bundle.js:2
    <anonymous> http://127.0.0.1:8080/static/bundle.js:2
    <anonymous> http://127.0.0.1:8080/static/bundle.js:2
    <anonymous> http://127.0.0.1:8080/static/bundle.js:2
bundle.js:2:3611743

Expected Behavior

I expect the dashboard to show up as usual.

Current Behavior and Steps to Reproduce

Make a new study, add some trials. Then maybe add some new trials via enqueue_trial that might be outside of the previously used parameter range. Then open optuna-dashboard.

Context

  • python -c 'import optuna; print(optuna.__version__)': 3.8.8
  • optuna-dashboard --version: 0.3.1

Remove eslint warnings

There are some warnings of eslint.

  • StudyList.tsx
  • StudyDetail.tsx
  • GraphParallelCoordinate.tsx
  • GraphHistory.tsx
  • DataGrid.tsx
  • apiClient.ts
  • action.ts

Plot intermediate values of running trials

Feature Request

Is it possible to see the 'intermediate values' of a trial in running state being plotted as it runs.

E.g., in the attached image, it would be nice to see the top right plot populated with the numbers in the 'intermediate values' table bellow

Current figure
Screenshot from 2021-04-26 19-37-19

Docker

Feature Request

Docker build with Optuna Dashboard

Caching hyperparameter importances in memory.

This is a follow-up task for #54.

get_param_importances() is computationally expensive because of the training of RandomForest model. So it's better to cache the result at server-side like trials are cached.

Fast intersection search space calculation at server-side.

Feature Request

Intersection search space is computationally expensive because it consumes O(nm), where n is the number of trials and m is the number of parameters. Like the cursor-based approach at https://github.com/optuna/optuna/blob/master/optuna/samplers/_search_space.py, we can make it faster.

TODO

Support buttons to filter trial states

Feature Request

Currently, the button for filtering the trial states seems to be reflected only in the main graph,
but I want the filtered states to be reflected in other graphs as well.

parallel coordinate plot cannot handle small numbers using mantiassa/exponent notation

Bug reports

When one coordinate of the parallel coordinate plots gets values that are small enough (that we usually write with the floating point notation as e.g. 1e-10), the plot will show them in a random order (and not sorted as you would expect form a numerical coordinate):

Consider following screenshot. The numbers are completely out of order.

grafik

Expected Behavior

I expect that the values are sorted in ascending order, and ideally have some nice spacing between the different labelled points.

Current Behavior and Steps to Reproduce

Currently these values are probably treated as categorical values. I suspect this is because under the hood the values are converted to strings. While numbers that are displayed using the floating point format (containing the e to separate mantissa and exponent) fail, numbers that are just written using digits and a decimal separator work fine.

I used following code to generate the database file:

import optuna


def objective(trial: optuna.trial.BaseTrial):
    lr = trial.suggest_loguniform('lr', low=1e-10, high=1e-5)
    loss = lr
    return loss

if __name__ == '__main__':
    study = optuna.create_study(
        study_name='test',
        storage="sqlite:///test.db",
        load_if_exists=True,
        direction='minimize'
        )

    study.optimize(objective, n_trials=10)
    print(f'{study.best_params=}')

Context

  • Optuna Version 2.5.0 (ubuntu):
  • Optuna-Dashboard version 0.2.2 (win):

Plotly state is lost every x seconds (when refreshing)

Bug reports

When refreshing is enabled and you select some option in a plotly graph, e.g. "Show closest data on hover", this setting is lost whenever the dashboard refreshes.

Expected Behavior

The setting should be kept in the same way that settings like "log scale" or the selected parameters are kept.

Current Behavior and Steps to Reproduce

As described above.

I can try to investigate this bug and implement a solution if nobody is currently working on it already.

Context

Newest verion of optuna and optuna-dashboard.

Use log axis if parameter's distribution is log scale

Feature Request

Related to optuna/optuna#666.

Motivation

Currently, the slice plot is always shown in linear scale. The parameters in LogUniformDistribution or IntLogUniformDistribution tend to be plotted around left-edge, and it is sometimes difficult for users to analyze results. On the other hand, Optuna's visualization function automatically uses log axes for such parameters.

For example, the following slice plots are rendered using optuna/examples/pytorch/pytorch_simple.py. Optuna's plot visualizes the peak between 0.001 to 0.01 more clearly than Oputna-dashboard's figure.

(To write the results to the RDBStorage, following fix is required.)

--- a/examples/pytorch/pytorch_simple.py
+++ b/examples/pytorch/pytorch_simple.py
@@ -123,7 +123,7 @@ def objective(trial):
 
 
 if __name__ == "__main__":
-    study = optuna.create_study(direction="maximize")
+    study = optuna.create_study(direction="maximize", storage="sqlite:///foo.db")
     study.optimize(objective, n_trials=100, timeout=600)
 
     pruned_trials = study.get_trials(deepcopy=False, states=[TrialState.PRUNED])

Optuna Dashboard
image

Optuna
image

Description

Please convert axes to the log scale when parameters' distributions are log scale.

Delete trial

Feature Request

Under special circumstances, some useless trials will be left behind, and we hope to delete them, for example, failed, terminated process, and so on. thx!

Dashboard is not rendered if trials are pruned without intermediate values

Bug reports

This might be design, but I found that the dashboard page was not rendered if a study contained pruned trials without intermediate values.

Expected Behavior

Studies with pruned trials having no intermediate values should be rendered. Or, an error page should be provided if they are not acceptable.

Current Behavior and Steps to Reproduce

The following is an example code to reproduce the issue. In this example, I pruned trials whose objective values exceed a threshold. A list of studies were rendered as expected, but It showed blank page if I clicked the study name.

image

import optuna


def objective(trial):
    # Binh and Korn function with constraints.
    x = trial.suggest_float("x", -15, 30)
    y = trial.suggest_float("y", -15, 30)

    v = x ** 2 + y ** 2

    # Prune if the objective values exceed the threshold.
    if v > 100:
        raise optuna.TrialPruned()

    return v


if __name__ == "__main__":
    study = optuna.create_study(
        storage="sqlite:///foo.db",
    )
    study.optimize(objective, n_trials=32, timeout=600)

    print("Number of finished trials: ", len(study.trials))
    print("Number of complete trials: ", len(study.get_trials(states=(optuna.trial.TrialState.COMPLETE,))))

Context

Versions:

  • optuna: 2.8.0.dev
  • optuna-dashboard: 0.3.1

Porting patches to Goptuna.

Motivation

The code base of optuna-dashboard is originally taken from Goptuna project.
But recently, following changes are added to optuna-dashboard by external contributors.

In this issue, I want to ask external contributors whether I can port these patches to Goptuna.

@2403hwaseer @zchenry May I have your response?

TODO

  • Agreement from @zchenry
  • Agreement from @2403hwaseer
  • Add CLA (Contributor License Agreements) to port patches to Goptuna.

npm run build:dev fails with "[webpack-cli] Uncaught exception: TypeError: Cannot read property 'compiler' of undefined"

Bug reports

I would like to contribute some improvements to the UI and was trying to follow the contribution manual. I use Ubuntu with node v14.16.1 and npm v6.14.12. Typescript version is 4.2.4.

This is the error I get when running npm run build:dev:

[email protected] build:dev /home/simon/projects/optuna-dashboard
NODE_ENV=development webpack

= = = = = = = = = = = = = = = = = = =
DEVELOPMENT BUILD
= = = = = = = = = = = = = = = = = = =
[webpack-cli] Uncaught exception: TypeError: Cannot read property 'compiler' of undefined
[webpack-cli] TypeError: Cannot read property 'compiler' of undefined
at /home/simon/projects/optuna-dashboard/node_modules/ts-loader/dist/after-compile.js:13:25
at /home/simon/projects/optuna-dashboard/node_modules/ts-loader/dist/instances.js:259:84
at Hook.eval [as call] (eval at create (/home/simon/projects/optuna-dashboard/node_modules/webpack/node_modules/tapable/lib/HookCodeFactory.js:19:10), :7:1)
at Hook.CALL_DELEGATE [as _call] (/home/simon/projects/optuna-dashboard/node_modules/webpack/node_modules/tapable/lib/Hook.js:14:14)
at /home/simon/projects/optuna-dashboard/node_modules/webpack/lib/Compilation.js:2469:40
at eval (eval at create (/home/simon/projects/optuna-dashboard/node_modules/webpack/node_modules/tapable/lib/HookCodeFactory.js:33:10), :14:1)
at eval (eval at create (/home/simon/projects/optuna-dashboard/node_modules/webpack/node_modules/tapable/lib/HookCodeFactory.js:33:10), :11:1)
at /home/simon/projects/optuna-dashboard/node_modules/webpack/lib/SourceMapDevToolPlugin.js:546:10
at /home/simon/projects/optuna-dashboard/node_modules/neo-async/async.js:2830:7
at Object.each (/home/simon/projects/optuna-dashboard/node_modules/neo-async/async.js:2857:9)

Are there other dependencies that are not mentioned in DEVELOMENT.md?

Regression: Trial user attributes not being displayed on release v0.4.0

Bug reports

Trial user attributes not being displayed on release v0.4.0

Expected Behavior

I expect to see Trial user attributes

Current Behavior and Steps to Reproduce

I'm checking two installations of optuna-dashboard, one of version v0.3.1 and another v0.4.0. They point to the same storage, however, the lastest dont show the expected Trial user attributes
Screenshot from 2021-04-19 18-42-27
Screenshot from 2021-04-19 18-43-29

Context

Please provide any relevant information about your setup.
This is important in case the issue is not reproducible except for under certain conditions.

working on

$ python -c 'import optuna; print(optuna.__version__)'
2.6.0

$ optuna-dashboard --version
0.3.1

NOT working on

$ python -c 'import optuna; print(optuna.__version__)'
2.7.0

$ optuna-dashboard --version
0.4.0

how to see the trials in optuna-dashboard?

I am using optuna in my code. I need just to see the trials drawn in optuna-dashboard. For the moment, i can start optuna-dashbord, but it is empty. So, my question: once, I run my code from visual studio how can I see the trials results in optuna-dashboard?

Note to the questioner

If you are more comfortable with Stack Overflow, you may consider posting your question with the "optuna" tag there instead.
Alternatively, for issues that would benefit from more of an interactive session with the developers,
you may refer to the optuna/optuna chat on Gitter.

Recommend Projects

  • React photo React

    A declarative, efficient, and flexible JavaScript library for building user interfaces.

  • Vue.js photo Vue.js

    ๐Ÿ–– Vue.js is a progressive, incrementally-adoptable JavaScript framework for building UI on the web.

  • Typescript photo Typescript

    TypeScript is a superset of JavaScript that compiles to clean JavaScript output.

  • TensorFlow photo TensorFlow

    An Open Source Machine Learning Framework for Everyone

  • Django photo Django

    The Web framework for perfectionists with deadlines.

  • D3 photo D3

    Bring data to life with SVG, Canvas and HTML. ๐Ÿ“Š๐Ÿ“ˆ๐ŸŽ‰

Recommend Topics

  • javascript

    JavaScript (JS) is a lightweight interpreted programming language with first-class functions.

  • web

    Some thing interesting about web. New door for the world.

  • server

    A server is a program made to process requests and deliver data to clients.

  • Machine learning

    Machine learning is a way of modeling and interpreting data that allows a piece of software to respond intelligently.

  • Game

    Some thing interesting about game, make everyone happy.

Recommend Org

  • Facebook photo Facebook

    We are working to build community through open source technology. NB: members must have two-factor auth.

  • Microsoft photo Microsoft

    Open source projects and samples from Microsoft.

  • Google photo Google

    Google โค๏ธ Open Source for everyone.

  • D3 photo D3

    Data-Driven Documents codes.