Coder Social home page Coder Social logo

nl4dv / nl4dv Goto Github PK

View Code? Open in Web Editor NEW
127.0 4.0 23.0 25.4 MB

A python toolkit to create Visualizations (Vis) using natural language (NL) or add an NL interface to existing Vis.

Home Page: https://nl4dv.github.io

License: MIT License

Python 100.00%
visualization python toolkit vega-lite jupyter-notebook datascience opensource data-visualization natural-language natural-language-processing

nl4dv's Introduction

NL4DV: Natural Language toolkit for Data Visualization

DOI:10.1109/TVCG.2020.3030418 arxiv badge arxiv badge PyPI license PyPI - Downloads

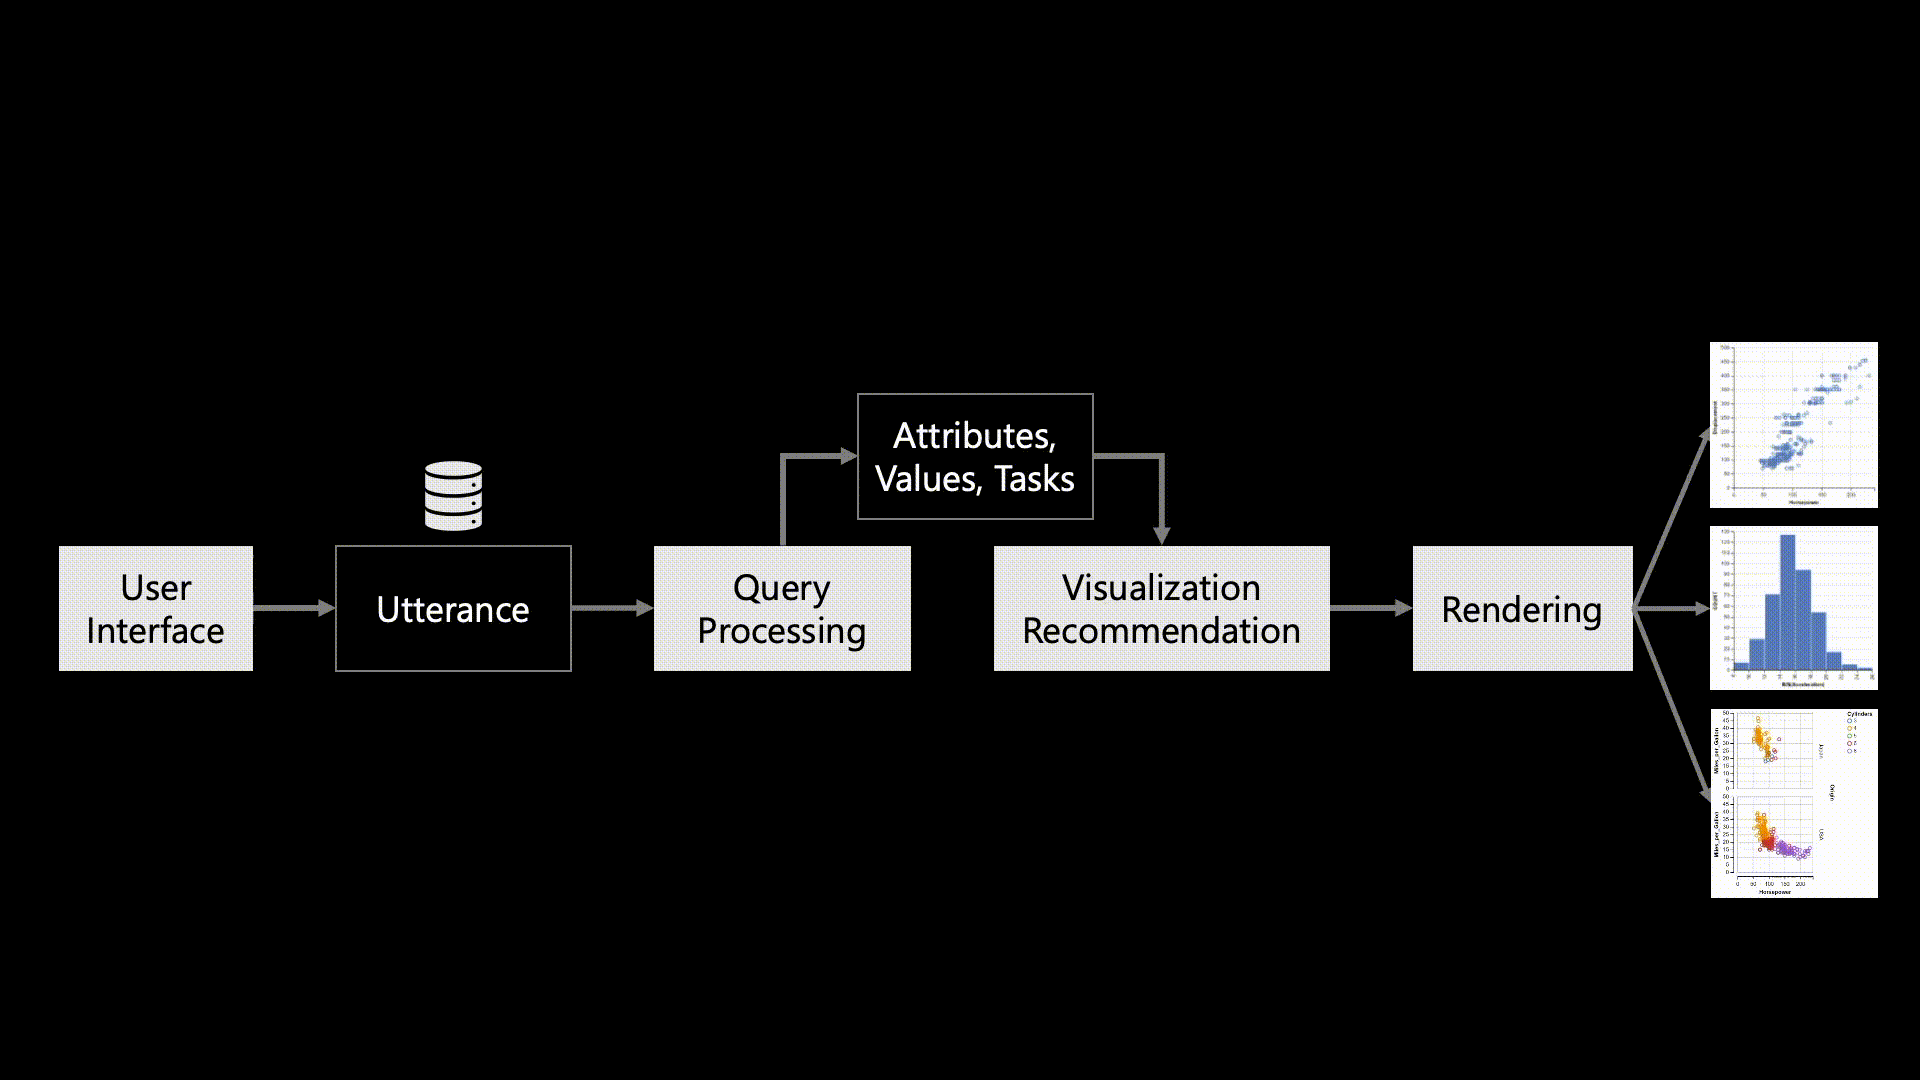
NL4DV takes a natural language query about a given dataset as input and outputs a structured JSON object containing:

  • Data attributes,
  • Analytic tasks, and
  • Visualizations (Vega-Lite specifications)

With this output, developers can

  • Create visualizations in Python using natural language, and/or
  • Add a natural language interface to their existing visualization systems.

NL4DV Overview

Setup Instructions, API Documentation, and Examples

These can all be found on NL4DV's project website.

Credits

NL4DV was created by Arpit Narechania, Arjun Srinivasan, Rishab Mitra, Alex Endert, and John Stasko of the Georgia Tech Visualization Lab.

We thank the members of the Georgia Tech Visualization Lab for their support and constructive feedback.

Citations

2020 IEEE TVCG Journal Full Paper (Proceedings of the 2020 IEEE VIS Conference)

@article{narechania2020nl4dv,
  title = {{NL4DV}: A {Toolkit} for Generating {Analytic Specifications} for {Data Visualization} from {Natural Language} Queries},
  shorttitle = {{NL4DV}},
  author = {{Narechania}, Arpit and {Srinivasan}, Arjun and {Stasko}, John},
  journal = {IEEE Transactions on Visualization and Computer Graphics (TVCG)},
  doi = {10.1109/TVCG.2020.3030378},
  year = {2020},
  publisher = {IEEE}
}

2022 IEEE VIS Conference Short Paper Track

@inproceedings{mitra2022conversationalinteraction,
  title = {{Facilitating Conversational Interaction in Natural Language Interfaces for Visualization}},
  author = {{Mitra}, Rishab and {Narechania}, Arpit and {Endert}, Alex and {Stasko}, John},
  booktitle={2022 IEEE Visualization Conference (VIS)},
  url = {https://doi.org/10.48550/arXiv.2207.00189},
  doi = {10.48550/arXiv.2207.00189},
  year = {2022},
  publisher = {IEEE}
}

License

The software is available under the MIT License.

Contact

If you have any questions, feel free to open an issue or contact Arpit Narechania.

nl4dv's People

Contributors

arjun010 avatar arpitnarechania avatar dependabot[bot] avatar rmitra34 avatar

Stargazers

 avatar  avatar  avatar  avatar  avatar  avatar  avatar  avatar  avatar  avatar  avatar  avatar  avatar  avatar  avatar  avatar  avatar  avatar  avatar  avatar  avatar  avatar  avatar  avatar  avatar  avatar  avatar  avatar  avatar  avatar  avatar  avatar  avatar  avatar  avatar  avatar  avatar  avatar  avatar  avatar  avatar  avatar  avatar  avatar  avatar  avatar  avatar  avatar  avatar  avatar  avatar  avatar  avatar  avatar  avatar  avatar  avatar  avatar  avatar  avatar  avatar  avatar  avatar  avatar  avatar  avatar  avatar  avatar  avatar  avatar  avatar  avatar  avatar  avatar  avatar  avatar  avatar  avatar  avatar  avatar  avatar  avatar  avatar  avatar  avatar  avatar  avatar  avatar  avatar  avatar  avatar  avatar  avatar  avatar  avatar  avatar  avatar  avatar  avatar  avatar

Watchers

 avatar  avatar  avatar  avatar

nl4dv's Issues

Issue with Query Involving Temporal Attribute

The following query average budget where release year is between 2005 and 2009 generates the following VegaLite specification:

{ "$schema": "https://vega.github.io/schema/vega-lite/v4.json", "mark": { "type": "line", "tooltip": true }, "encoding": { "y": { "field": "Production Budget", "type": "quantitative", "aggregate": "mean", "axis": { "format": "s" } }, "x": { "field": "Release Year", "type": "temporal" } }, "transform": [ { "filter": { "field": "Release Year", "range": [ "2005", "2009" ] } } ], "data": { "url": "https://raw.githubusercontent.com/nl4dv/nl4dv/master/examples/assets/data/movies-w-year.csv", "format": { "type": "csv" } } }

This vegalite specification does not output a visualization. However, the VegaLite specification that outputs the correct visualization is the following:

{ "$schema": "https://vega.github.io/schema/vega-lite/v4.json", "mark": { "type": "line", "tooltip": true }, "encoding": { "y": { "field": "Production Budget", "type": "quantitative", "aggregate": "mean", "axis": { "format": "s" } }, "x": { "field": "Release Year", "type": "temporal" } }, "transform": [ { "filter": { "timeUnit": "year", "field": "Release Year", "range": [2005, 2009]} } ], "data": { "url": "https://raw.githubusercontent.com/nl4dv/nl4dv/master/examples/assets/data/movies-w-year.csv", "format": { "type": "csv" } } }

Therefore the transform JSON seems to be off and should be much like the latter VegaLite specification. Thanks!

Use database as data source?

Is it possible to use a database (Elasticsearch, Postgres, etc) as the source of data, instead of having to first retrieve the data into a dataframe or file, which often times is infeasible if the dataset is large?

Issue generating vega lite visualisation

nl4dv_instance = NL4DV(data_url = os.path.join(".", "Detailed Exp. of each MP 16th LS.csv"))
dependency_parser_config = {"name": "spacy", "model": "en_core_web_sm", "parser": None}
query = "visualize a barchart showing average Expenditure across State"
vega_lite_spec = nl4dv_instance.render_vis(query)
st.vega_lite_chart(vega_lite_spec)

The above code causes following error:

File "C:\Users\tih_desktop_2\Documents\Superset\nl4dv\lib\site-packages\nltk\corpus\util.py", line 95, in __load
args, kwargs = self.__args, self.__kwargs
AttributeError: 'WordNetCorpusReader' object has no attribute '_LazyCorpusLoader__args'. Did you mean: 'synset'?
2023-12-07 17:16:53.515 Uncaught app exception

However, the following code does not generate any error but only produces screen with no visualisation in the browser

query = "create a barchart showing average Expenditure across State"
output = nl4dv_instance.analyze_query(query)
st.vega_lite_chart(output["visList"][0]["vlSpec"])

Is there a way to use a data frame instead of a file path?

Really amazing work here!

Is it possible to pass a data frame as the data_url? I am trying to use this with a MySQL database, and I would much rather have the data be stored in the session temporarily (as a data frame) rather than it be cached on the disk permanently (or until someone deletes it).

If you can offer any advice, that will be much appreciated!

ImportError Issue

Hello,
After I run all the steps as specified in the application section at https://nl4dv.github.io/nl4dv/documentation.html, I am getting the following error by running (python app.py)
ImportError: cannot import name 'MutableMapping' from 'collections' (C:\Users\wadda\AppData\Local\Programs\Python\Python311\Lib\collections_init_.py)
Do you have any idea how to solve the importing issue?
Thanks

Recommend Projects

  • React photo React

    A declarative, efficient, and flexible JavaScript library for building user interfaces.

  • Vue.js photo Vue.js

    ๐Ÿ–– Vue.js is a progressive, incrementally-adoptable JavaScript framework for building UI on the web.

  • Typescript photo Typescript

    TypeScript is a superset of JavaScript that compiles to clean JavaScript output.

  • TensorFlow photo TensorFlow

    An Open Source Machine Learning Framework for Everyone

  • Django photo Django

    The Web framework for perfectionists with deadlines.

  • D3 photo D3

    Bring data to life with SVG, Canvas and HTML. ๐Ÿ“Š๐Ÿ“ˆ๐ŸŽ‰

Recommend Topics

  • javascript

    JavaScript (JS) is a lightweight interpreted programming language with first-class functions.

  • web

    Some thing interesting about web. New door for the world.

  • server

    A server is a program made to process requests and deliver data to clients.

  • Machine learning

    Machine learning is a way of modeling and interpreting data that allows a piece of software to respond intelligently.

  • Game

    Some thing interesting about game, make everyone happy.

Recommend Org

  • Facebook photo Facebook

    We are working to build community through open source technology. NB: members must have two-factor auth.

  • Microsoft photo Microsoft

    Open source projects and samples from Microsoft.

  • Google photo Google

    Google โค๏ธ Open Source for everyone.

  • D3 photo D3

    Data-Driven Documents codes.