Coder Social home page Coder Social logo

graphviz-java's Introduction

graphviz-java

Build Status codecov License Maven Central

Use graphviz with pure java. Create graphviz models using java code and convert them into nice graphics.

How it works

To execute the graphviz layout engine, one of these options is used:

  • If the machine has graphviz installed and a dot command is available, spawn a new process running dot.
  • Use this javascript version of graphviz and execute it on the V8 javascript engine. This is done with the bundled J2V8 library.
  • Alternatively, the javascript can be executed on Java's own Nashorn or GraalVM engine (preferring Graal if both are available).

The method(s) to be used can be configured with the Graphviz.useEngine() method.

Prerequisites

This project heavily uses classes from java.awt. Therefore, it does not work on android.

Maven

This project is available via Maven:

<dependency>
    <groupId>guru.nidi</groupId>
    <artifactId>graphviz-java</artifactId>
    <version>0.18.1</version>
</dependency>

graphviz-java contains all needed dependencies including one to J2V8 for the current platform (Linux, Mac OS X, Windows). This should be ok for most use cases.

gradle does not support this way of defining a dependency. Gradle users have to manually add a dependency to J2V8, e.g. com.eclipsesource.j2v8:j2v8_linux_x86_64:4.6.0

Instead of graphviz-java there are two alternative dependencies that can be used:

  • graphviz-java-all-j2v8 additionally contains dependencies to all J2V8 platforms. So the same application can run on Linux, Mac OS X and Windows.
  • graphviz-java-min-deps contains only dependencies that are absolutely necessary. All other dependencies are marked as optional and must added manually. See the pom.xml for details.

Instead of J2V8, one can also use the JDK javascript engine Nashorn. If Nashorn is too slow or on JDK version 15 or newer (where Nashorn has been removed), the graal javascript engine is a third option. It needs this additional dependency:

<dependency>
    <groupId>org.graalvm.js</groupId>
    <artifactId>js</artifactId>
    <version>20.0.0</version>
</dependency>

Logging

Graphviz-java uses the SLF4J facade to log. Users must therefore provide a logging implementation like LOGBack

<dependency>
    <groupId>ch.qos.logback</groupId>
    <artifactId>logback-classic</artifactId>
    <version>1.2.3</version>
</dependency>

or Log4j

<dependency>
    <groupId>org.apache.logging.log4j</groupId>
    <artifactId>log4j-core</artifactId>
    <version>2.13.0</version>
</dependency>
<dependency>
    <groupId>org.apache.logging.log4j</groupId>
    <artifactId>log4j-slf4j-impl</artifactId>
    <version>2.13.0</version>
</dependency>

API

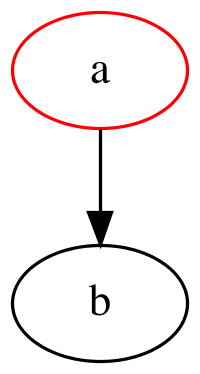
The API is separated into a mutable and immutable part. The basic usage is as follows (assuming import static guru.nidi.graphviz.model.Factory.*).

Immutable

Graph g = graph("example1").directed()
        .graphAttr().with(Rank.dir(LEFT_TO_RIGHT))
        .nodeAttr().with(Font.name("arial"))
        .linkAttr().with("class", "link-class")
        .with(
                node("a").with(Color.RED).link(node("b")),
                node("b").link(
                        to(node("c")).with(attr("weight", 5), Style.DASHED)
                )
        );
Graphviz.fromGraph(g).height(100).render(Format.PNG).toFile(new File("example/ex1.png"));

  • Global attributes are set using the graphAttr, linkAttr and nodeAttr methods.
  • Nodes are styled using the with method.
  • To style edges, use the static method to which returns a Link that also has a with method.
  • The with method accepts predefined attributes like Style, Arrow or Shape as well as everything defined in the Graphviz reference e.g. with("weight", 5) or even arbitrary custom attributes.
  • Custom attribute classes can be defined by extending SingleAttributes or MapAttributes.

Attention: Node a = node("a"); a.with(Color.RED); Is not working as it might be expected. All "mutating" methods like with on nodes, links and graphs create new objects and leave the original object unchanged. So in the example above, variable a contains a node that is NOT red. If you want a red node, do a = a.with(Color.RED) or use the mutable API.

Mutable

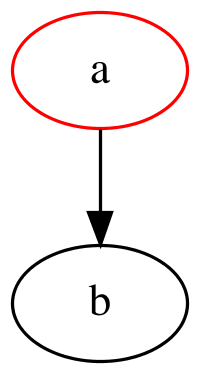
MutableGraph g = mutGraph("example1").setDirected(true).add(
        mutNode("a").add(Color.RED).addLink(mutNode("b")));
Graphviz.fromGraph(g).width(200).render(Format.PNG).toFile(new File("example/ex1m.png"));

The mutable API provides similar functions as the immutable one with slightly different syntax:

  • mutGraph instead of graph, mutNode instead of node
  • use setters: setDirected instead of directed
  • add instead of width

Imperative

There is a third possibility to use the API, based on the mutable version. Its form is closer to the way dot files are written. In the lambda of the MutableGraph.use method, all referenced nodes, links and graphs are automatically added to the parent graph, without explicitly calling the add method.

MutableGraph g = mutGraph("example1").setDirected(true).use((gr, ctx) -> {
    mutNode("b");
    nodeAttrs().add(Color.RED);
    mutNode("a").addLink(mutNode("b"));
});
Graphviz.fromGraph(g).width(200).render(Format.PNG).toFile(new File("example/ex1i.png"));

This corresponds to the following dot file:

digraph example1 {
    b
    node[color=red]
    a -> b
}

Kotlin DSL

Kotlin DSL is still experimental. Things can change and any feedback is very welcome.

<dependency>
    <groupId>guru.nidi</groupId>
    <artifactId>graphviz-kotlin</artifactId>
    <version>0.18.1</version>
</dependency>

The kotlin DSL based on the imperative API. It defines that following elements:

  • edge, node, graph variables to define global attributes.
  • -, /, [] operators on MutableNode which link, define ports, set attributes.
  • -, /, [] operators on String so that strings can be used directly to define nodes.
  • -, [] operators on Link which allow to chain links and set attributes.

To enable the functions, use import guru.nidi.graphviz.*

graph(directed = true) {
    edge["color" eq "red", Arrow.TEE]
    node[Color.GREEN]
    graph[Rank.dir(LEFT_TO_RIGHT)]

    "a" - "b" - "c"
    ("c"[Color.RED] - "d"[Color.BLUE])[Arrow.VEE]
    "d" / NORTH - "e" / SOUTH
}.toGraphviz().render(PNG).toFile(File("example/ex1.png"))

Parsing

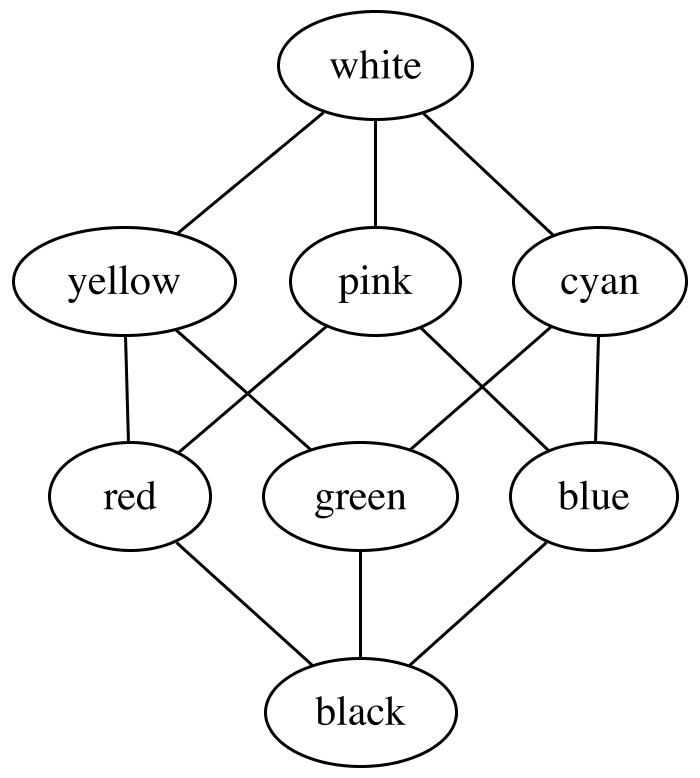
Dot files can be parsed and thus manipulated. Given this file color.dot:

graph {
    { rank=same; white}
    { rank=same; cyan; yellow; pink}
    { rank=same; red; green; blue}
    { rank=same; black}

    white -- cyan -- blue
    white -- yellow -- green
    white -- pink -- red

    cyan -- green -- black
    yellow -- red -- black
    pink -- blue -- black
}

Then running this program:

try (InputStream dot = getClass().getResourceAsStream("/color.dot")) {
    MutableGraph g = new Parser().read(dot);
    Graphviz.fromGraph(g).width(700).render(Format.PNG).toFile(new File("example/ex4-1.png"));

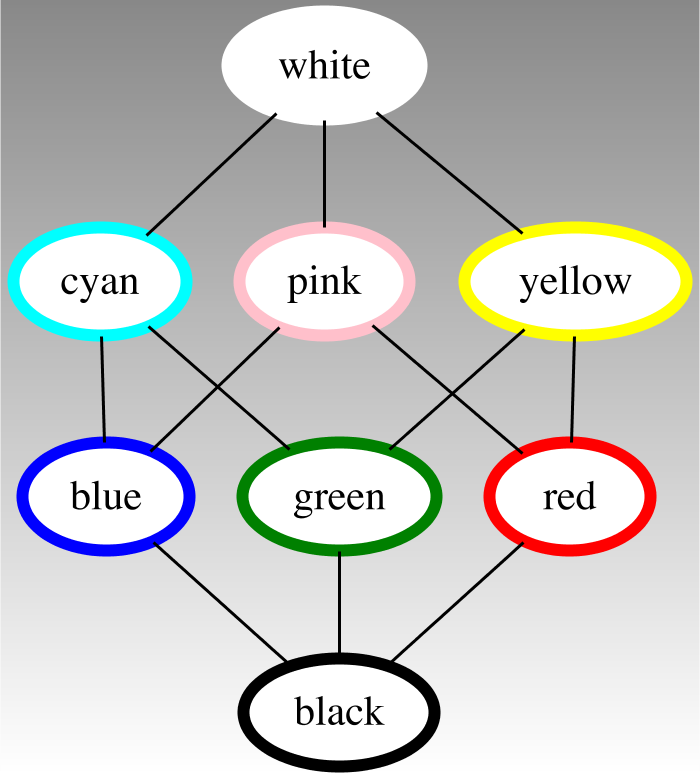
    g.graphAttrs()
            .add(Color.WHITE.gradient(Color.rgb("888888")).background().angle(90))
            .nodeAttrs().add(Color.WHITE.fill())
            .nodes().forEach(node ->
            node.add(
                    Color.named(node.name().toString()),
                    Style.lineWidth(4), Style.FILLED));
    Graphviz.fromGraph(g).width(700).render(Format.PNG).toFile(new File("example/ex4-2.png"));
}

results in this graphics:

Examples

Complex example

Node
        main = node("main").with(Label.html("<b>main</b><br/>start"), Color.rgb("1020d0").font()),
        init = node(Label.markdown("**_init_**")),
        execute = node("execute"),
        compare = node("compare").with(Shape.RECTANGLE, Style.FILLED, Color.hsv(.7, .3, 1.0)),
        mkString = node("mkString").with(Label.lines(LEFT, "make", "a", "multi-line")),
        printf = node("printf");

Graph g = graph("example2").directed().with(
        main.link(
                to(node("parse").link(execute)).with(LinkAttr.weight(8)),
                to(init).with(Style.DOTTED),
                node("cleanup"),
                to(printf).with(Style.BOLD, Label.of("100 times"), Color.RED)),
        execute.link(
                graph().with(mkString, printf),
                to(compare).with(Color.RED)),
        init.link(mkString));

Graphviz.fromGraph(g).width(900).render(Format.PNG).toFile(new File("example/ex2.png"));

Example with records

import static guru.nidi.graphviz.attribute.Records.*;
import static guru.nidi.graphviz.model.Compass.*;
Node
        node0 = node("node0").with(Records.of(rec("f0", ""), rec("f1", ""), rec("f2", ""), rec("f3", ""), rec("f4", ""))),
        node1 = node("node1").with(Records.of(turn(rec("n4"), rec("v", "719"), rec("")))),
        node2 = node("node2").with(Records.of(turn(rec("a1"), rec("805"), rec("p", "")))),
        node3 = node("node3").with(Records.of(turn(rec("i9"), rec("718"), rec("")))),
        node4 = node("node4").with(Records.of(turn(rec("e5"), rec("989"), rec("p", "")))),
        node5 = node("node5").with(Records.of(turn(rec("t2"), rec("v", "959"), rec("")))),
        node6 = node("node6").with(Records.of(turn(rec("o1"), rec("794"), rec("")))),
        node7 = node("node7").with(Records.of(turn(rec("s7"), rec("659"), rec(""))));
Graph g = graph("example3").directed()
        .graphAttr().with(Rank.dir(LEFT_TO_RIGHT))
        .with(
                node0.link(
                        between(port("f0"), node1.port("v", SOUTH)),
                        between(port("f1"), node2.port(WEST)),
                        between(port("f2"), node3.port(WEST)),
                        between(port("f3"), node4.port(WEST)),
                        between(port("f4"), node5.port("v", NORTH))),
                node2.link(between(port("p"), node6.port(NORTH_WEST))),
                node4.link(between(port("p"), node7.port(SOUTH_WEST))));
Graphviz.fromGraph(g).width(900).render(Format.PNG).toFile(new File("example/ex3.png"));

Images

Images can be included in graphviz in two ways.

One possibility is using the <img> tag inside a HTML label:

Graphviz.useEngine(new GraphvizCmdLineEngine());
Graphviz g = Graphviz.fromGraph(graph()
        .with(node(Label.html("<table border='0'><tr><td><img src='graphviz.png' /></td></tr></table>"))));
g.basedir(new File("example")).render(Format.PNG).toFile(new File("example/ex7.png"));

Because viz.js does not support <img> tags, this works only when using the command line engine.

The other possibility is the image attribute of a node:

Graphviz g = Graphviz.fromGraph(graph()
        .with(node(" ").with(Size.std().margin(.8, .7), Image.of("graphviz.png"))));
g.basedir(new File("example")).render(Format.PNG).toFile(new File("example/ex8.png"));

This works with all engines.

In both cases, the basedir() method can be used to define where relative paths are looked up.

Configuration

The size of the resulting image, the rendering engine and the output format can be configured:

Graphviz.useEngine(new GraphvizCmdLineEngine()); // Rasterizer.builtIn() works only with CmdLineEngine
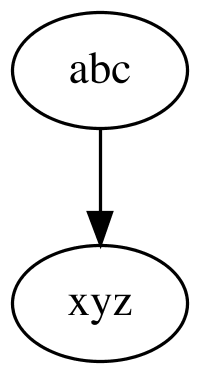
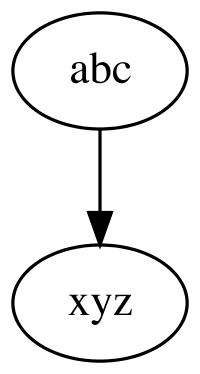
Graph g = graph("example5").directed().with(node("abc").link(node("xyz")));
Graphviz viz = Graphviz.fromGraph(g);
viz.width(200).render(Format.SVG).toFile(new File("example/ex5.svg"));
viz.width(200).rasterize(Rasterizer.BATIK).toFile(new File("example/ex5b.png"));
viz.width(200).rasterize(Rasterizer.SALAMANDER).toFile(new File("example/ex5s.png"));
viz.width(200).rasterize(Rasterizer.builtIn("pdf")).toFile(new File("example/ex5p"));
String dot = viz.render(Format.DOT).toString();
String json = viz.engine(Engine.NEATO).render(Format.JSON).toString();
BufferedImage image = viz.render(Format.PNG).toImage();

To rasterize with batik, provide this library on the classpath:

<dependency>
    <groupId>org.apache.xmlgraphics</groupId>
    <artifactId>batik-rasterizer</artifactId>
    <version>1.13</version>
</dependency>

Processors

Processors can be registered to further customize what goes in and out of the graphviz engine.

  • Pre processors change the dot file that is fed into the graphviz engine.
  • Post processor change the result of the graphviz engine (image, svg,...).
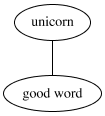
Graph graph = graph().with(node("bad word").link("good word"));
Graphviz g = Graphviz.fromGraph(graph)
        .preProcessor((source, options, processOptions) -> source.replace("bad word", "unicorn"))
        .postProcessor((result, options, processOptions) ->
                result.mapString(svg ->
                        SvgElementFinder.use(svg, finder -> {
                            finder.findNode("unicorn").setAttribute("class", "pink");
                        })));
g.render(Format.PNG).toFile(new File("example/ex9.png"));

Javadoc

To use graphviz inside javadoc comments, add this to pom.xml:

<build>
  <plugins>
    <plugin>
      <artifactId>maven-javadoc-plugin</artifactId>
      <version>3.1.0</version>
      <configuration>
        <taglet>guru.nidi.graphviz.taglet.GraphvizTaglet</taglet>
        <tagletArtifact>
          <groupId>guru.nidi</groupId>
          <artifactId>graphviz-taglet</artifactId>
          <version>0.18.1</version>
        </tagletArtifact>
      </configuration>
    </plugin>
  </plugins>
</build>

To use this with JDK 9 or later, replace graphviz-taglet with graphviz-taglet9.

The usage inside javadoc is then as follows:

/**
 * Support graphviz inside javadoc.
 * <p>
 * {@graphviz
 * graph test { a -- b }
 * }
 * </p>
 * So easy.
 */
public class GraphvizTaglet implements Taglet {}

Sketchy

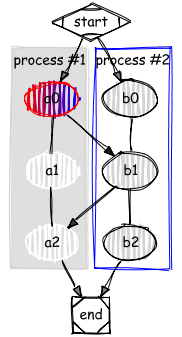
To change the appearance of the graph into something more sketchy / hand drawn, the Roughifyer processor can be used. First, add the rough module to the dependencies:

<dependency>
    <groupId>guru.nidi</groupId>
    <artifactId>graphviz-rough</artifactId>
    <version>0.18.1</version>
</dependency>

Then, apply the Roughifyer to the graph:

final Graph g = graph("ex1").directed().with(
        graph().cluster()
                .nodeAttr().with(Style.FILLED, Color.WHITE)
                .graphAttr().with(Style.FILLED, Color.LIGHTGREY, Label.of("process #1"))
                .with(node("a0").link(node("a1").link(node("a2")))),
        graph("x").cluster()
                .nodeAttr().with(Style.FILLED)
                .graphAttr().with(Color.BLUE, Label.of("process #2"))
                .with(node("b0").link(node("b1").link(node("b2")))),
        node("start").with(Shape.M_DIAMOND).link("a0", "b0"),
        node("a0").with(Style.FILLED, Color.RED.gradient(Color.BLUE)).link("b1"),
        node("b1").link("a2"),
        node("a2").link("end"),
        node("b2").link("end"),
        node("end").with(Shape.M_SQUARE)
);

Graphviz.fromGraph(g)
        .processor(new Roughifyer()
                .bowing(2)
                .curveStepCount(6)
                .roughness(1)
                .fillStyle(FillStyle.hachure().width(2).gap(5).angle(0))
                .font("*serif", "Comic Sans MS"))
        .render(Format.PNG)
        .toFile(new File("example/ex1-rough.png"));

graphviz-java's People

Contributors

anuraaga avatar breandan avatar damienb-opt avatar douo avatar jenspiegsa avatar jrodbx avatar nidi3 avatar nkame avatar simon04 avatar sparsick avatar

Stargazers

 avatar  avatar  avatar  avatar  avatar  avatar  avatar  avatar  avatar  avatar  avatar  avatar  avatar  avatar  avatar  avatar  avatar  avatar  avatar  avatar  avatar  avatar  avatar  avatar  avatar  avatar  avatar  avatar  avatar  avatar  avatar  avatar  avatar  avatar  avatar  avatar  avatar  avatar  avatar  avatar  avatar  avatar  avatar  avatar  avatar  avatar  avatar  avatar  avatar  avatar  avatar  avatar  avatar  avatar  avatar  avatar  avatar  avatar  avatar  avatar  avatar  avatar  avatar  avatar  avatar  avatar  avatar  avatar  avatar  avatar  avatar  avatar  avatar  avatar  avatar  avatar  avatar  avatar  avatar  avatar  avatar  avatar  avatar  avatar  avatar  avatar  avatar  avatar  avatar  avatar  avatar  avatar  avatar  avatar  avatar  avatar  avatar  avatar  avatar  avatar

Watchers

 avatar  avatar  avatar  avatar  avatar  avatar  avatar  avatar  avatar  avatar  avatar  avatar  avatar  avatar  avatar  avatar  avatar  avatar  avatar  avatar  avatar  avatar  avatar  avatar  avatar  avatar  avatar  avatar  avatar  avatar  avatar

graphviz-java's Issues

dot.exe command not found

Hello, I have installed graphviz and added it to the system environment (windows), tried it using the dot command in the shell and everything worked fine. Graphviz is installed under C:\Program Files (x86)\Graphviz2.38 so why do I get this error: ?

[JavaFX Application Thread] INFO guru.nidi.graphviz.engine.AbstractGraphvizEngine - Could not initialize guru.nidi.graphviz.engine.GraphvizCmdLineEngine
guru.nidi.graphviz.engine.GraphvizException: dot.exe command not found

API leads to confusion between node ids and labels

Given that Node constructor takes Label, and Label supports HTML, I expected

Factory.graph().with(Factory.node(Label.html("<b>a</b>")))

to work and produce bold "a". However, in my tests it produces a node with text "a" as label, when rendered on JSVGCanvas. Instead, I need

Factory.mutGraph().with(Factory.node("some random id").with("label", Label.html("<b>a</b>"))))

Is this the expected result, or is it just failure on Batik's side?

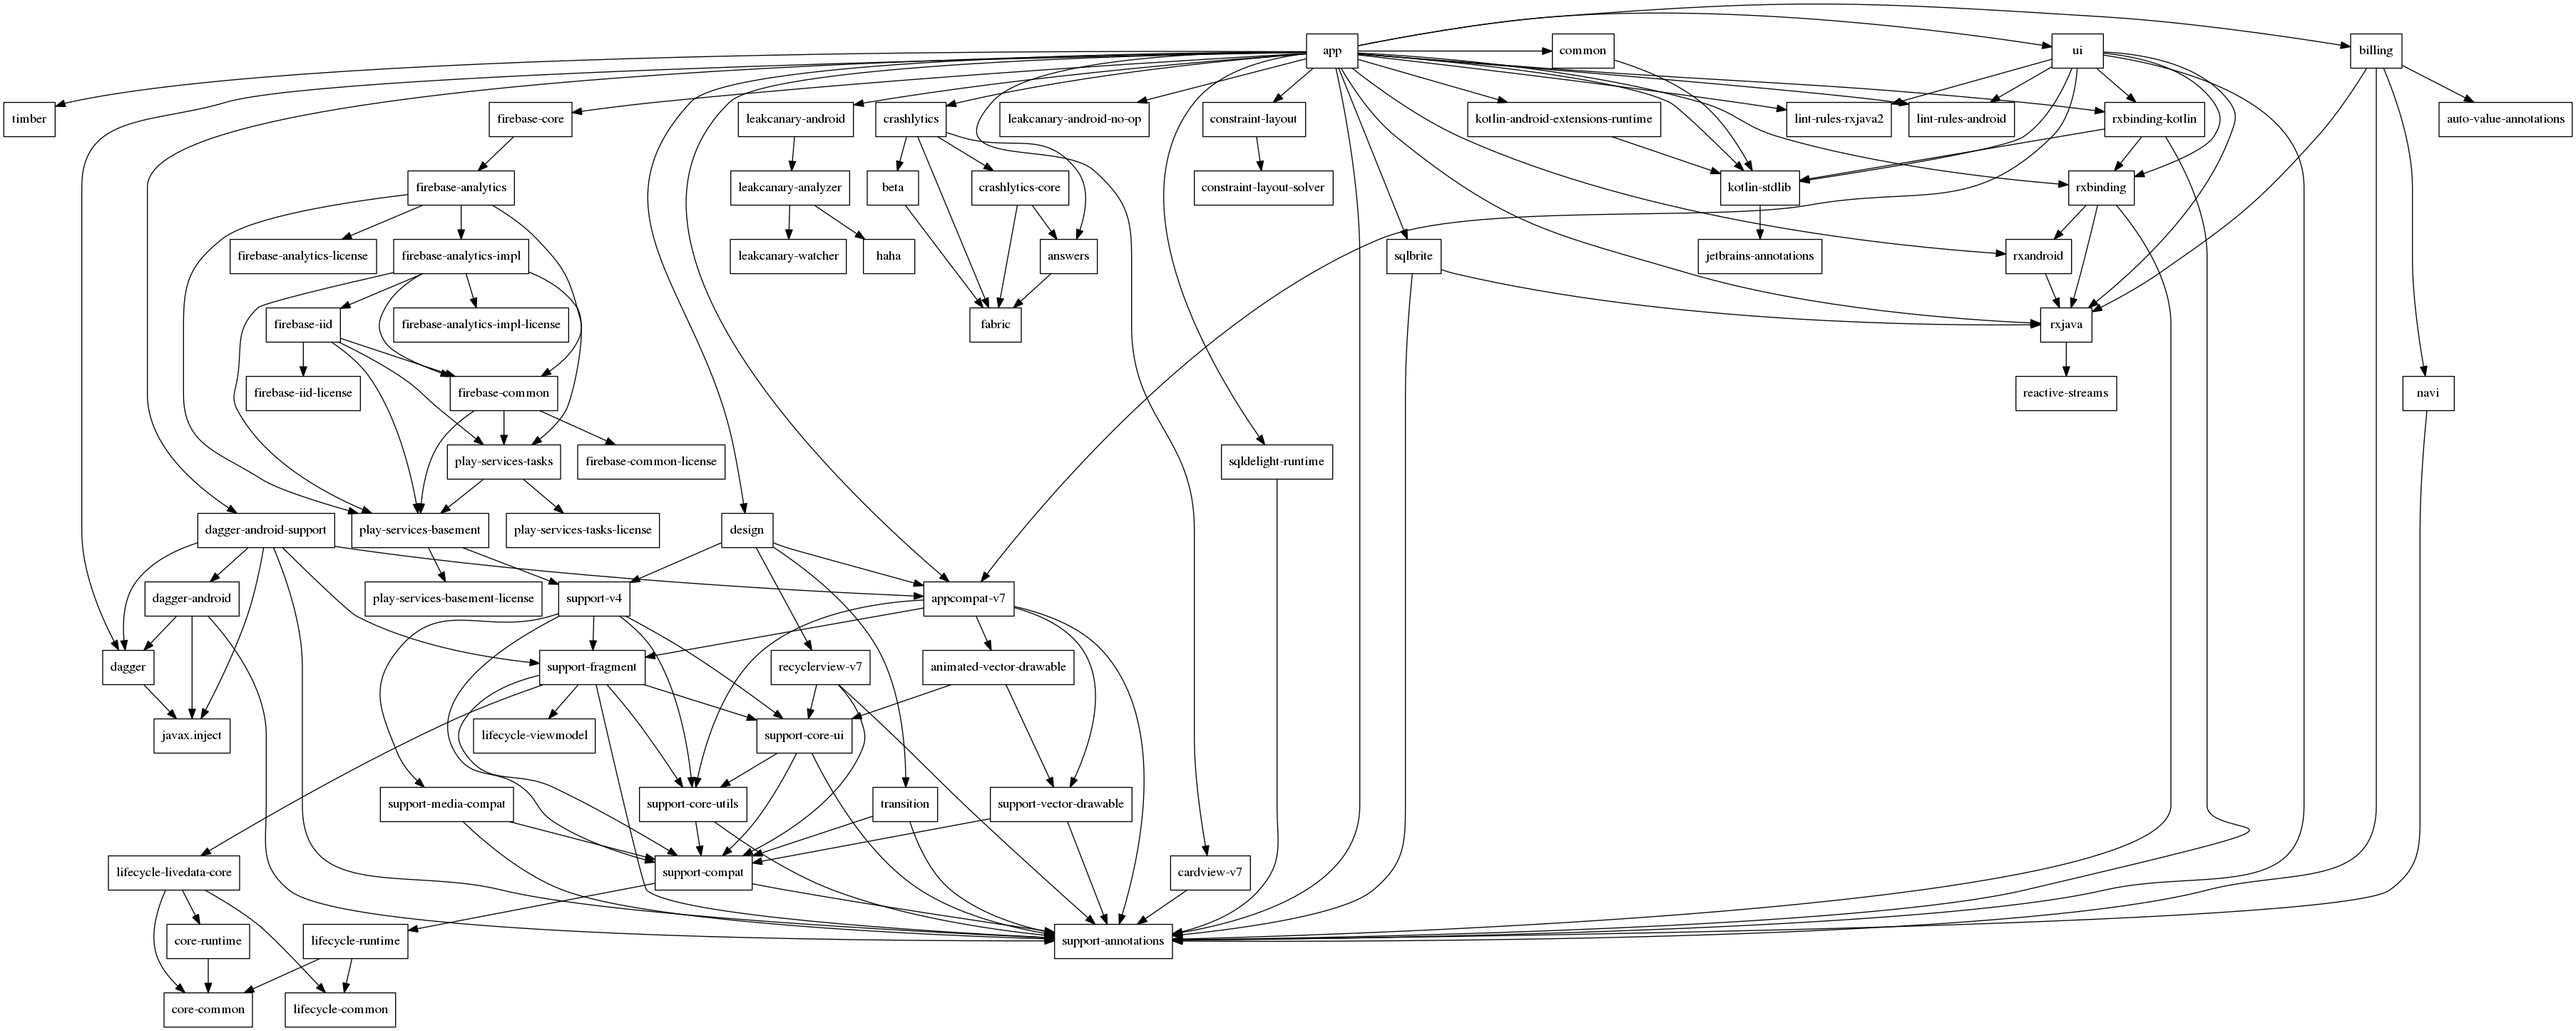
Text of a box will go outside of it's bounds

Image:

dependency-graph

When using the normal dot the boxes will grow larger as necessary:

dependency-graph

Note that there are some differences in the chart themselves but my focus is only on the text box size.

Dot:

digraph "G" {
"app" ["shape"="rectangle"]
"sqldelight-runtime" ["shape"="rectangle"]
"support-annotations" ["shape"="rectangle"]
"leakcanary-android" ["shape"="rectangle"]
"leakcanary-analyzer" ["shape"="rectangle"]
"leakcanary-watcher" ["shape"="rectangle"]
"haha" ["shape"="rectangle"]
"kotlin-android-extensions-runtime" ["shape"="rectangle"]
"kotlin-stdlib" ["shape"="rectangle"]
"jetbrains-annotations" ["shape"="rectangle"]
"crashlytics" ["shape"="rectangle"]
"beta" ["shape"="rectangle"]
"fabric" ["shape"="rectangle"]
"crashlytics-core" ["shape"="rectangle"]
"answers" ["shape"="rectangle"]
"design" ["shape"="rectangle"]
"recyclerview-v7" ["shape"="rectangle"]
"support-core-ui" ["shape"="rectangle"]
"support-core-utils" ["shape"="rectangle"]
"support-compat" ["shape"="rectangle"]
"lifecycle-runtime" ["shape"="rectangle"]
"lifecycle-common" ["shape"="rectangle"]
"core-common" ["shape"="rectangle"]
"transition" ["shape"="rectangle"]
"appcompat-v7" ["shape"="rectangle"]
"animated-vector-drawable" ["shape"="rectangle"]
"support-vector-drawable" ["shape"="rectangle"]
"support-fragment" ["shape"="rectangle"]
"lifecycle-livedata-core" ["shape"="rectangle"]
"core-runtime" ["shape"="rectangle"]
"lifecycle-viewmodel" ["shape"="rectangle"]
"support-v4" ["shape"="rectangle"]
"support-media-compat" ["shape"="rectangle"]
"cardview-v7" ["shape"="rectangle"]
"constraint-layout" ["shape"="rectangle"]
"constraint-layout-solver" ["shape"="rectangle"]
"timber" ["shape"="rectangle"]
"billing" ["shape"="rectangle"]
"navi" ["shape"="rectangle"]
"rxjava" ["shape"="rectangle"]
"reactive-streams" ["shape"="rectangle"]
"auto-value-annotations" ["shape"="rectangle"]
"ui" ["shape"="rectangle"]
"rxbinding" ["shape"="rectangle"]
"rxbinding-kotlin" ["shape"="rectangle"]
"lint-rules-android" ["shape"="rectangle"]
"lint-rules-rxjava2" ["shape"="rectangle"]
"common" ["shape"="rectangle"]
"dagger" ["shape"="rectangle"]
"javax.inject" ["shape"="rectangle"]
"dagger-android-support" ["shape"="rectangle"]
"dagger-android" ["shape"="rectangle"]
"firebase-core" ["shape"="rectangle"]
"firebase-analytics" ["shape"="rectangle"]
"firebase-analytics-impl" ["shape"="rectangle"]
"firebase-iid" ["shape"="rectangle"]
"firebase-common" ["shape"="rectangle"]
"play-services-tasks" ["shape"="rectangle"]
"play-services-basement" ["shape"="rectangle"]
"play-services-basement-license" ["shape"="rectangle"]
"play-services-tasks-license" ["shape"="rectangle"]
"firebase-common-license" ["shape"="rectangle"]
"firebase-iid-license" ["shape"="rectangle"]
"firebase-analytics-impl-license" ["shape"="rectangle"]
"firebase-analytics-license" ["shape"="rectangle"]
"rxandroid" ["shape"="rectangle"]
"sqlbrite" ["shape"="rectangle"]
"leakcanary-android-no-op" ["shape"="rectangle"]
"app" -> "sqldelight-runtime"
"app" -> "support-annotations"
"app" -> "leakcanary-android"
"app" -> "kotlin-android-extensions-runtime"
"app" -> "crashlytics"
"app" -> "design"
"app" -> "appcompat-v7"
"app" -> "cardview-v7"
"app" -> "constraint-layout"
"app" -> "timber"
"app" -> "billing"
"app" -> "ui"
"app" -> "common"
"app" -> "dagger"
"app" -> "dagger-android-support"
"app" -> "kotlin-stdlib"
"app" -> "firebase-core"
"app" -> "rxjava"
"app" -> "rxandroid"
"app" -> "sqlbrite"
"app" -> "rxbinding"
"app" -> "rxbinding-kotlin"
"app" -> "lint-rules-android"
"app" -> "lint-rules-rxjava2"
"app" -> "leakcanary-android-no-op"
"sqldelight-runtime" -> "support-annotations"
"leakcanary-android" -> "leakcanary-analyzer"
"leakcanary-analyzer" -> "leakcanary-watcher"
"leakcanary-analyzer" -> "haha"
"kotlin-android-extensions-runtime" -> "kotlin-stdlib"
"kotlin-stdlib" -> "jetbrains-annotations"
"crashlytics" -> "beta"
"crashlytics" -> "crashlytics-core"
"crashlytics" -> "answers"
"crashlytics" -> "fabric"
"beta" -> "fabric"
"crashlytics-core" -> "answers"
"crashlytics-core" -> "fabric"
"answers" -> "fabric"
"design" -> "recyclerview-v7"
"design" -> "transition"
"design" -> "appcompat-v7"
"design" -> "support-v4"
"recyclerview-v7" -> "support-core-ui"
"recyclerview-v7" -> "support-compat"
"recyclerview-v7" -> "support-annotations"
"support-core-ui" -> "support-core-utils"
"support-core-ui" -> "support-compat"
"support-core-ui" -> "support-annotations"
"support-core-utils" -> "support-compat"
"support-core-utils" -> "support-annotations"
"support-compat" -> "support-annotations"
"support-compat" -> "lifecycle-runtime"
"lifecycle-runtime" -> "lifecycle-common"
"lifecycle-runtime" -> "core-common"
"transition" -> "support-compat"
"transition" -> "support-annotations"
"appcompat-v7" -> "animated-vector-drawable"
"appcompat-v7" -> "support-fragment"
"appcompat-v7" -> "support-core-utils"
"appcompat-v7" -> "support-vector-drawable"
"appcompat-v7" -> "support-annotations"
"animated-vector-drawable" -> "support-core-ui"
"animated-vector-drawable" -> "support-vector-drawable"
"support-vector-drawable" -> "support-compat"
"support-vector-drawable" -> "support-annotations"
"support-fragment" -> "support-core-ui"
"support-fragment" -> "support-core-utils"
"support-fragment" -> "support-compat"
"support-fragment" -> "support-annotations"
"support-fragment" -> "lifecycle-livedata-core"
"support-fragment" -> "lifecycle-viewmodel"
"lifecycle-livedata-core" -> "lifecycle-common"
"lifecycle-livedata-core" -> "core-runtime"
"lifecycle-livedata-core" -> "core-common"
"core-runtime" -> "core-common"
"support-v4" -> "support-fragment"
"support-v4" -> "support-core-ui"
"support-v4" -> "support-core-utils"
"support-v4" -> "support-media-compat"
"support-v4" -> "support-compat"
"support-media-compat" -> "support-compat"
"support-media-compat" -> "support-annotations"
"cardview-v7" -> "support-annotations"
"constraint-layout" -> "constraint-layout-solver"
"billing" -> "navi"
"billing" -> "support-annotations"
"billing" -> "rxjava"
"billing" -> "auto-value-annotations"
"navi" -> "support-annotations"
"rxjava" -> "reactive-streams"
"ui" -> "kotlin-stdlib"
"ui" -> "support-annotations"
"ui" -> "appcompat-v7"
"ui" -> "rxjava"
"ui" -> "rxbinding"
"ui" -> "rxbinding-kotlin"
"ui" -> "lint-rules-android"
"ui" -> "lint-rules-rxjava2"
"rxbinding" -> "support-annotations"
"rxbinding" -> "rxandroid"
"rxbinding" -> "rxjava"
"rxbinding-kotlin" -> "rxbinding"
"rxbinding-kotlin" -> "support-annotations"
"rxbinding-kotlin" -> "kotlin-stdlib"
"common" -> "kotlin-stdlib"
"dagger" -> "javax.inject"
"dagger-android-support" -> "appcompat-v7"
"dagger-android-support" -> "support-fragment"
"dagger-android-support" -> "dagger-android"
"dagger-android-support" -> "support-annotations"
"dagger-android-support" -> "dagger"
"dagger-android-support" -> "javax.inject"
"dagger-android" -> "support-annotations"
"dagger-android" -> "dagger"
"dagger-android" -> "javax.inject"
"firebase-core" -> "firebase-analytics"
"firebase-analytics" -> "firebase-analytics-impl"
"firebase-analytics" -> "firebase-common"
"firebase-analytics" -> "play-services-basement"
"firebase-analytics" -> "firebase-analytics-license"
"firebase-analytics-impl" -> "firebase-iid"
"firebase-analytics-impl" -> "firebase-common"
"firebase-analytics-impl" -> "play-services-tasks"
"firebase-analytics-impl" -> "play-services-basement"
"firebase-analytics-impl" -> "firebase-analytics-impl-license"
"firebase-iid" -> "firebase-common"
"firebase-iid" -> "play-services-tasks"
"firebase-iid" -> "play-services-basement"
"firebase-iid" -> "firebase-iid-license"
"firebase-common" -> "play-services-tasks"
"firebase-common" -> "play-services-basement"
"firebase-common" -> "firebase-common-license"
"play-services-tasks" -> "play-services-basement"
"play-services-tasks" -> "play-services-tasks-license"
"play-services-basement" -> "support-v4"
"play-services-basement" -> "play-services-basement-license"
"rxandroid" -> "rxjava"
"sqlbrite" -> "support-annotations"
"sqlbrite" -> "rxjava"
}

Upgrade to batik 1.9

Hi,

if possible update to batik 1.9 since 1.8 brings in some vulnerabilties.
mvn org.owasp:dependency-check-maven:aggregate -Dowasp

screenshot 756 dependency-check report - mozilla firefox

Best regards
Jรถrg

multiple lines between two nodes

It seem that Viz support multiple lines between two nodes, but fail in this package.

Example:

Graph g = graph("example1").directed().with(node("a").link(node("b"))).with(node("a").link(node("b")));
Graphviz.fromGraph(g).width(200).render(Format.PNG).toFile(new File("example/ex1.png"));

NPE if output file has no parent directory

Version: guru.nidi:graphviz-java:0.2.3

This works fine:

fromGraph(g)//
			.render(format)//
			.toFile(new File("folder/file.png"));

This fails with NPE:

fromGraph(g)//
			.render(format)//
			.toFile(new File("file.png"));

Stacktrace:

Exception in thread "main" java.lang.NullPointerException
	at guru.nidi.graphviz.engine.Renderer.toFile(Renderer.java:44)
	at se.bjurr.mrdv.graph.GraphGenerator.create(GraphGenerator.java:43)
	at se.bjurr.mrdv.api.MavenDependencyGraphVisualizer.run(MavenDependencyGraphVisualizer.java:80)
	at se.bjurr.mrdv.main.Main.main(Main.java:93)

Use graphviz engine installed on host

[Not really an issue]

Since the J2V8 engine gives errors when two different JVM's use J2V8 (eclipsesource/J2V8#39), I think it would be nice to provide an engine that uses the graphviz installed on the host to transform the dot files.

More precisely:
Provide an engine (extends AbstractGraphvizEngine) that can
-) Check if the dot command is available on the host OS
-) On execution uses this dot command with the correct parameters to transform the dot files into an output.

I made a first implementation for this engine in my fork of the project.

Would you be interested to integrate this engine into the graphviz-java project?

Kind Regards,
Daan

Support for -y option of dot program

Please, add to graphviz-java possibility to achieve the same behavior as for such command:
dot -Tdot -y -o output.dot input.dot

Lets say I have such input.dot file:

graph {
    { rank=same; top}
    { rank=same; right; left; center}
    { rank=same; bottom}

    top -- right -- bottom
    top -- left -- bottom
    left -- center -- right
}

Now, the output of command: dot -Tdot -y -o output.dot input.dot gives me following result:

graph {
	graph [bb="0,180,209.3,0"];
	node [label="\N"];
	{
		graph [rank=same];
		top		 [height=0.5,
			pos="104,18",
			width=0.75];
	}
	{
		graph [rank=same];
		right		 [height=0.5,
			pos="182,90",
			width=0.75827];
		left		 [height=0.5,
			pos="27,90",
			width=0.75];
		center		 [height=0.5,
			pos="104,90",
			width=0.9027];
	}
	{
		graph [rank=same];
		bottom		 [height=0.5,
			pos="104,162",
			width=1.011];
	}
	top -- right	 [pos="119.41,32.83 133,45.022 152.7,62.704 166.35,74.959"];
	top -- left	 [pos="88.418,33.166 74.971,45.39 55.659,62.946 42.296,75.094"];
	right -- bottom	 [pos="166.22,105.17 153.04,116.99 134.3,133.8 120.84,145.89"];
	left -- center	 [pos="54.07,90 59.791,90 65.513,90 71.234,90"];
	left -- bottom	 [pos="42.582,105.17 55.59,116.99 74.085,133.8 87.375,145.89"];
	center -- right	 [pos="136.6,90 142.63,90 148.66,90 154.69,90"];
}

But using graphviz-java with following code:

MutableGraph mutableGraph = Parser.read(new File("input.dot"));

Graphviz.useEngine(new GraphvizV8Engine());
Graphviz.fromGraph(mutableGraph).engine(Engine.DOT).render(Format.XDOT).toFile(new File("output.dot"));

gives result different than the native dot program:

graph {
	graph [bb="0,0,218.28,180"
	];
	node [label="\N"];
	{
		graph [rank=same];
		top		 [height=0.5,
			pos="108,162",
			width=0.75];
	}
	{
		graph [rank=same];
		right		 [height=0.5,
			pos="189,90",
			width=0.81321];
		left		 [height=0.5,
			pos="27,90",
			width=0.75];
		center		 [height=0.5,
			pos="107,90",
			width=0.96177];
	}
	{
		graph [rank=same];
		bottom		 [height=0.5,
			pos="108,18",
			width=1.0667];
	}
	top -- right	 [pos="124.39,147.43 138.26,135.1 158.06,117.5 172.08,105.04"];
	top -- left	 [pos="91.608,147.43 77.555,134.94 57.413,117.03 43.367,104.55"];
	right -- bottom	 [pos="172.22,75.082 158.78,63.136 139.96,46.41 126.17,34.151"];
	left -- center	 [pos="54.188,90 60.239,90 66.29,90 72.342,90"];
	left -- bottom	 [pos="43.392,75.43 56.89,63.431 76.006,46.439 89.942,34.052"];
	center -- right	 [pos="141.91,90 147.8,90 153.69,90 159.57,90"];
}

You can see the difference in the second lines of the output files:

dot -y                               graphviz_java
graph [bb="0,180,209.3,0"];    vs    graph [bb="0,0,218.28,180"

It would be great if you could give me some advice how to achieve the same result like with 'dot -y' command or please add support for such option.

Support Ports in Tables

To draw complex structual objects, one can use in graphviz the HTML TABLE syntax. The following example comes from http://renenyffenegger.ch/notes/tools/Graphviz/examples/index.

digraph H {

  parent [
   shape=plaintext
   label=<
     <table border='1' cellborder='1'>
       <tr><td colspan="3">The foo, the bar and the baz</td></tr>
       <tr><td port='port_one'>First port</td><td port='port_two'>Second port</td><td port='port_three'>Third port</td></tr>
     </table>
  >];

  child_one [
   shape=plaintext
   label=<
     <table border='1' cellborder='0'>
       <tr><td>1</td></tr>
     </table>
  >];

  child_two [
   shape=plaintext
   label=<
     <table border='1' cellborder='0'>
       <tr><td>2</td></tr>
     </table>
  >];

  child_three [
   shape=plaintext
   label=<
     <table border='1' cellborder='0'>
       <tr><td>3</td></tr>
     </table>
  >];

  parent:port_one   -> child_one;
  parent:port_two   -> child_two;
  parent:port_three -> child_three;

} 

Today, it is not passible to parse nor write such code, because it is not possible to link to ports. There is the Compass Enumeration, but the values defined are fixed.

When I try to parse such code, I get to following exception

java.lang.RuntimeException: <string>:19:26 Invalid compass value 'port_one'
	at guru.nidi.graphviz.model.CreationContext.use(CreationContext.java:40)
	at guru.nidi.graphviz.parse.Parser.parse(Parser.java:56)
	at guru.nidi.graphviz.parse.Parser.read(Parser.java:47)
	at guru.nidi.graphviz.parse.Parser.read(Parser.java:43)
	...
Caused by: <string>:19:26 Invalid compass value 'port_one'
	at guru.nidi.graphviz.parse.Parser.lambda$compass$12(Parser.java:173)
	at java.util.Optional.orElseThrow(Optional.java:290)
	at guru.nidi.graphviz.parse.Parser.compass(Parser.java:172)
	at guru.nidi.graphviz.parse.Parser.nodeId(Parser.java:193)
	at guru.nidi.graphviz.parse.Parser.statement(Parser.java:101)
	at guru.nidi.graphviz.parse.Parser.statementList(Parser.java:84)
	at guru.nidi.graphviz.parse.Parser.lambda$parse$10(Parser.java:72)
	at guru.nidi.graphviz.model.CreationContext.use(CreationContext.java:38)
	... 28 more

I recommend to intoduce a new class "Port" implementing LinkSource and LinkTarget . A child class might use the Compass Enumeration. Otherwise, one can define a custom port name. Furthermore, the Serializer class shall support this LinkSource / LinkTarget.

API subgraph

is there a way to create subgraphs with the API? I don't see anything in the api related to it, and Graph does not implement node...

Ambiguous methods in MutableAttributed

Aren't these two methods from MutableAttributed ambiguous per their types when given two arguments?

    default T add(String name, Object value)

    default T add(Object... keysAndValues)

Are both necessary?

Edge Attributes

Hi Stefan,

I'm trying to draw UML (like) diagrams and would like to use the 'Lollipop' notation for interfaces (small circle connected to an component box). My code:

		Node relNode = node(release.title()).with(Shape.RECTANGLE);
		List<LinkSource> links = new ArrayList<LinkSource>();

		Node psNode = null;
		for (ProvidedService ps : release.getCapabilities()) {
			psNode = node(ps.title()).with(Color.RED);
			links.add(psNode.link(to(relNode)).with("dir", "none"));
		}

Neither dir=none nor arrowhead=none showed the expected result.

Am I doing something wrong or did I hit an outstanding feature?

Thanks in advance
Jรถrg

Maven respository Diff

Forgive me if this is not the place but the maven respository is out of date. Can you update?

Replace newlines in a platform-independent way

@nidi3 - great library! Unfortunately, I cannot build yet, or I would have submitted a patch.

I am reading a DOT file, and then using a JavaScript engine to generate a graph image. My code is roughly

Graphviz.useEngine(new GraphvizV8Engine(), new GraphvizJdkEngine());
Graphviz.fromFile(dotFile).render(format).toFile(outputFile);

If the DOT file has newlines, this will fail. Please could you make the following modification on my behalf?
In guru.nidi.graphviz.engine.AbstractJsGraphvizEngine, replace newlines in a platform-independent way:

protected String jsEscape(String js) {
		return js.replace("\\R", " ").replace("\\", "\\\\").replace("'", "\\'");
}

two node not work in Parser

graph {
layout=neato;
overlap=scalexy;
sep="+1"; // 0.1, +1

node[label="Large node", width=2, height=2];
l1; l2; l3;
node[label="\N", width=0.5, height=0.3];
1 -- l1;
2 -- l1;
3 -- l1;
4 -- l1;
5 -- l1;
5 -- l2;
6 -- l2;
7 -- l2;
8 -- l2;
8 -- l3;
9 -- l3;
10 -- l3;
}

after pase Parser.read(dotString).toString() will lost first node attributes

Crash when Graphviz not installed and falling back on JS port

Happens on Ubuntu 17 and Windows 7.

I'm relocating the lib inside a fat jar.... perhaps that is why. But it would still be very nice if I could do that. To create a self contained runnable jar.

I'm getting this now:

[main] INFO se.bjurr.mrdv.mavenrepositorydependencyvisualizer.guru.nidi.graphviz.engine.AbstractGraphvizEngine - Could not initialize se.bjurr.mrdv.mavenrepositorydependencyvisualizer.guru.nidi.graphviz.engine.GraphvizCmdLineEngine
se.bjurr.mrdv.mavenrepositorydependencyvisualizer.guru.nidi.graphviz.engine.GraphvizException: dot command not found
#
# A fatal error has been detected by the Java Runtime Environment:
#
#  EXCEPTION_ACCESS_VIOLATION (0xc0000005) at pc=0x000000005e5de2b2, pid=5004, tid=0x00000000000020f8
#
...

How to color a label?

I want to make my link and my link label have the same color.
It seems like if I want to do this, I'll need to specify the label as html and format it myself. Any tips? I'm entering uncharted territory.

Font change between 0.1.1 and 0.1.3

Between versions 0.1.1 and 0.1.3, the default font for node labels seems to have changed. Could you speak more to how this change was made and how we can get the 0.1.1 style rendering back?

Edit: This seems to be for PNG rendering only. When I use .createSvg(), I can see the label render as Times,serif.

Grapvhiz native in Windows: JSON format not supported.

When using the GraphvizCmdLineEngine on Windows with a JSON as output, the following error appears:
Format: "json" not recognized. Use one of: bmp canon cmap cmapx cmapx_np dot emf emfplus eps fig gd gd2 gif gv imap imap_np ismap jpe jpeg jpg metafile pdf pic plain plain-ext png pov ps ps2 svg svgz tif tiff tk vml vmlz vrml wbmp xdot xdot1.2 xdot1.

=> It seems that the JSON output format is not supported on Windows machines.

Separate ids and label names for a MutableNode

I've got one last thing - I think - that I need for porting over my gradle dependency graph generator plugin to this library.

I want to generate something along the lines of this:

digraph G {
  rxjava [label="rxjava", shape="box"];
  ioreactivexrxjava2rxjava [label="rxjava", shape="box"];
  rxjava -> ioreactivexrxjava2rxjava;
  orgreactivestreamsreactivestreams [label="reactive-streams", shape="box"];
  ioreactivexrxjava2rxjava -> orgreactivestreamsreactivestreams;
}

The important part here is that the identifier is different from the label. I've played around with MutableNode but I could not find a way to do this. Is there any way to achieve this?

Font question

Hej!

In you examples, you don't seem to use the default font. And it looks good. So I wonder how you did that?

I've been trying to use a few different fonts, but there isn't enough space allocated for the labels.
I have the same version of the native Graphviz installed on my system, and the output differs only when it comes to the dimension of boxes etc. The fonts are all installed on my system, and I've pointed the fontpath attribute to them as well.

aggregation-introduction preparation-graph svg dot

BTW I have a set of 165 dot files, and generating SVGs for all of them is 40x faster with V8 compared to Nashorn (counting the total time for my files, including init)!

Render.toFile(file) throws FileNotFoundException if parent folders of file don't exists

If Render.toFile(file) gets a file object whose has parent folders that don't exist, then a FileNotFoundException is thrown.

Following TestCase reproduces the problem (testFolder doesn't exist in the filesystem):

        Graph graph = graph("example1").directed().with(node("a").link(node("b")));

        File expectedFile = new File("target/testFolder/ex1.png");
        Graphviz.fromGraph(graph).width(200).render(Format.PNG).toFile(expectedFile);

        assertTrue(expectedFile.exists());

        expectedFile.delete();
        expectedFile.getParentFile().delete();

Graph that is composed by subgraphs is not equal to the same graph that is built by using only nodes

Hello Stefan,

thank you for your great work.

I note, when I run following test code, I get an AssertionError:

        Graph graph1 = graph().directed().with((node("a").link(node("b"), node("c"))));;
        Graph graph2 = graph().directed().with((node("c").link(node("d"), node("e"))));;
        Graph composedGraph = graph().directed().with(graph1, graph2);
        Graph similarGraph = graph().directed().with(node("a").link(node("b"), node("c")),node("c").link(node("d"), node("e")));

        assertEquals(similarGraph, composedGraph);

My comparision view shows me following difference:

grafik

But both graphs are rendered as expected:

ex2

For me the expected result for assertEquals(similarGraph, composedGraph) is true. Or maybe a normalize() method for the Graph onject would be helpful.

Not an issue, just praise

Hi, I integrated GraphViz-java into my Java dialect, JavaX, which makes applications using it easy to build & very easy to distribute. Here's an example.OS

It should work out-of-the-box on Win (32 bit JVM) and Linux/64 with no GraphViz installed, just a JVM plus my file.

I haven't added the other platforms' native libs yet (Mac OS, Win/64) as my system currently downloads all of listed jars regardless of the actual OS and that seemed a bit excessive.

Keep up the good work, this is amazing!

Headlabel and Taillabel for edges are missing

I'm building a parser/renderer for .json to UML for work. -> .dot example for an edge would be:
"node1" -- "node3" ["headlabel"="(1,*)",
"taillabel"="(0,1)"]
Can I or someone else add this feature, because the code is just a lot prettier not using a string builder for .dot but this lib only supports Label if I am not mistaken :)
PS: nice work so far

Order of operations creates a wrong graph

I am trying to create a graph generically without knowing node dependency upfront. Here's an example that works:

        Node h1 = node("h1");
        Node h2 = node("h2");
        Node p = node("p");

        Graph g = graph("example1").directed().with(h1.link(p.link(h2.link(p)).link(h1)));

which produces correct graph:

digraph "example1" {
        "h1" -> "p"
        "p" -> "h2"
        "p" -> "h1"
        "h2" -> "p"
}

However, attempting to produce the same result generically (without knowing upfront what links to what), produces wrong extra line!

        Node h1 = node("h1");
        Node h2 = node("h2");
        Node p = node("p");

        h1 = h1.link(p);
        p = p.link(h2);
        h2 = h2.link(p);

        // This makes a double line from p to h2!!
        p = p.link(h1);

        Graph g = graph("example2").directed().with(h1).with(h2).with(p);

Notice extra p to h2!

digraph "example2" {
        "h1" -> "p"
        "p" -> "h2"
        "p" -> "h1"
        "p" -> "h2"
        "h2" -> "p"
}

However if the order of operations is tweaked, it works(!)

        h1 = h1.link(p);
        p = p.link(h1);
        p = p.link(h2);
        h2 = h2.link(p);

Parser for GraphViz in Java

Hi there, this looks like a very interesting project, but you ever find or created a parser for graphviz files? I kinda like your APIs, but it will be great if you can obtain a Graph object from an actual graphviz dot file.

MutableGraph.rootNodes() may return incorrect result on parsed graph

Here's snippet:

MutableGraph graph = Parser.read(new File("src/test/resources/test1.dot"));
Assert.assertEquals(5, graph.rootNodes().getSize());

Reason is after Parser added some nodes into LinkedHashSet (MutableGraph#nodes field) it alternates them later so MutableNode#hashCode returns another result and Graph#add(node) adds same node twice into set.

Workaround is to call MutableGraph#copy() after parsing it MutableGraph graph = Parser.read(new File("src/test/resources/test1.dot")).copy();.

Solution could be to change MutableNode#hashCode and MutableNode#equals to use only MutableNode#label.

align nodes / clusters in graph

Hi there,
I am new to graphviz and this java implementation. I want to create some clusters with links between. My problem is the alingment of these clusters.

This is what I want:
parser

This is what I got right now:
test1

In Dot I found a simple workaround, with adding the [cosntraint=false] attribute, here in dot-code rendered at http://webgraphviz.com/ :

digraph G {
	subgraph cluster_0 {
                a0 -> a1;
                a0 -> a2;
                a2 -> a3;
		label = "process #1";
	}
	subgraph cluster_1 {
		b3 -> b1 -> b2;
                b3 -> b4;
                b0 -> b1;
		label = "process #2";
	}
	a3 -> b2[constraint=false];           
}

I tried different ways, but didn't find an equal result to the workaround with not-constraint edges.

I found out, that if I parse my Dot-code with the constraint edge, it adds the constraint as a SimpleMutableAttribute and renders it correctly.
I found the attribute under nodes[0].links[0].attributes:
eclipse

But I didn't find a way to add this directly too.

Do I have to use invisble nodes/edges, ranks or did I miss something?

How to link nodes on the fly?

Hello, I'm building an application that creates a control flow graph from source code. So as my parser scans teh source code it is supposed to generate nodes and link them together, and at the end create a graph with the nodes previously created. How can I achieve this? I was thinking something along the lines of:

graph = new File("graphs/ex1.png");
Node root = node("a");        
root.link(node("b"));
root.link(node("c"));
Graph g = graph("example1").directed().with(root);
Graphviz.fromGraph(g).width(2000).render(Format.PNG).toFile(graph);

However this does not work, it only creates a graph with the root node. Thank you.

Subgraph style example

Could you provide a code sample that illustrates how to create subgraphs and apply styles to them?

Get around the order of adding links

Is there a way to get around the order of adding links?
I am trying to create a graph that should look like:

a -> b
a -> c
c -> d

When I do:

Node
a = node("a"),
b = node("b"),
c = node("c"),
d = node("d");
a = a.link(b);
a = a.link(c);
c.link(d);


Graph g1 = graph("example1").directed().with(a);

Graphviz.fromGraph(g1).width(200).render(Format.SVG).toFile(new File("src/main/d3/graph1.svg"));

There is no link created from c -> d
I can't link them in the correct order because I don't know from my input.
What is the way to fix this?

ClassNotFoundException: org.apache.batik.transcoder.TranscoderException

Based on the examples in README.md, I am trying to parse dot files and render pngs.

However, when calling Graphviz.fromGraph(g) I get the exception:

ClassNotFoundException: org.apache.batik.transcoder.TranscoderException

I am using the release graphviz-java-0.2.1.jar.

import guru.nidi.graphviz.attribute.Records.*;
import guru.nidi.graphviz.model.Compass.*;
import guru.nidi.graphviz.model.Factory.*;
    for (int i = 0; i <= files.length - 1; i++) {
       try {
         MutableGraph g = Parser.read(files[i]);
         Graphviz.fromGraph(g).width(700).render(Format.PNG).toFile(new File("out.png"));
       } 
       catch(IOException ie) {
         ie.printStackTrace();
       }
     }

Label justification of the graph won't emitted correctly

Failing test case:

val graph = mutGraph("test")
graph.generalAttrs().add(Label.of("my custom header").locate(TOP).justify(MIDDLE))
assertThat(graph).hasToString("""
    graph "test" {
    "labelloc"="t"
    "label"="my custom header"
    }
    """.trimIndent())

Somehow the labeljust=c got missing. I'm using 0.4.0

NullPointerException when calling toFile

I am using version 0.2.3 and I get a NullPointerException when trying to output to a file. Here's a minimal example to reproduce the problem:

Graphviz.fromGraph(graph("g")).render(Format.PNG).toFile(new File("./a.png"));

Stacktrace:

Caused by: java.lang.NullPointerException
        at guru.nidi.graphviz.engine.GraphvizV8Engine.release(GraphvizV8Engine.java:38)
        at guru.nidi.graphviz.engine.AbstractGraphvizEngine.initTask(AbstractGraphvizEngine.java:46)
        at guru.nidi.graphviz.engine.AbstractGraphvizEngine.init(AbstractGraphvizEngine.java:34)
        at guru.nidi.graphviz.engine.Graphviz.doUseEngine(Graphviz.java:82)
        at guru.nidi.graphviz.engine.Graphviz.lambda$doUseEngine$15(Graphviz.java:82)
        at guru.nidi.graphviz.engine.AbstractGraphvizEngine.initTask(AbstractGraphvizEngine.java:47)
        at guru.nidi.graphviz.engine.AbstractGraphvizEngine.init(AbstractGraphvizEngine.java:34)
        at guru.nidi.graphviz.engine.Graphviz.doUseEngine(Graphviz.java:82)
        at guru.nidi.graphviz.engine.Graphviz.useEngine(Graphviz.java:74)
        at guru.nidi.graphviz.engine.Graphviz.useEngine(Graphviz.java:55)
        at guru.nidi.graphviz.engine.Graphviz.useDefaultEngines(Graphviz.java:47)
        at guru.nidi.graphviz.engine.Graphviz.getEngine(Graphviz.java:88)
        at guru.nidi.graphviz.engine.Graphviz.execute(Graphviz.java:170)
        at guru.nidi.graphviz.engine.Renderer.toImage(Renderer.java:68)
        at guru.nidi.graphviz.engine.Renderer.toFile(Renderer.java:46)

Am I missing something?

StackOverflowError

when i try to send two parallel requests, or two requests close to each other (time interval between two requests is about 3sec) to the lib to create a 'svg' file i got StackOverflowError.
exception.txt

Graphviz.scale() overwrites height and width values when it's used in a method chain

I use the static methods (scale(), heigth(), width()) in a method chaining for configuring Graphviz. Unfortunately, the scale() method overwrites the height and width values to 0.

Following failing unit test demonstrates the behaviour

 @Test
    public void methodChainCheck(){
        final Graph graph = graph().with(node("a").link("b"));

        final Graphviz graphviz = Graphviz.fromGraph(graph).height(20).width(30).scale(3);

        assertThat(graphviz.width, is(30) );
        assertThat(graphviz.height, is(20) );
        assertThat(graphviz.scale, is(3d ));
    }

Test result is:

java.lang.AssertionError: 
Expected: is <30>
     but: was <0>
Expected :is <30>
     
Actual   :<0>

My expectation would be that this test runs successfully.

This same behaviour is watchable if width()or height() is the last method call in a method chain.

Windows 32-Bit Support

Running graphviz-java on a windows 32 bit machine throws following exception

guru.nidi.graphviz.engine.GraphvizException: Could not start graphviz engine
	at guru.nidi.graphviz.engine.AbstractGraphvizEngine.execute(AbstractGraphvizEngine.java:42)
	at guru.nidi.graphviz.engine.Graphviz.execute(Graphviz.java:118)
	at guru.nidi.graphviz.engine.Renderer.toString(Renderer.java:40)
	at guru.nidi.graphviz.engine.Renderer.toFile(Renderer.java:49)
	at sun.reflect.NativeMethodAccessorImpl.invoke0(Native Method)
	at sun.reflect.NativeMethodAccessorImpl.invoke(NativeMethodAccessorImpl.java:62)
	at sun.reflect.DelegatingMethodAccessorImpl.invoke(DelegatingMethodAccessorImpl.java:43)
	at java.lang.reflect.Method.invoke(Method.java:498)
	at org.junit.runners.model.FrameworkMethod$1.runReflectiveCall(FrameworkMethod.java:50)
	at org.junit.internal.runners.model.ReflectiveCallable.run(ReflectiveCallable.java:12)
	at org.junit.runners.model.FrameworkMethod.invokeExplosively(FrameworkMethod.java:47)
	at org.junit.internal.runners.statements.InvokeMethod.evaluate(InvokeMethod.java:17)
	at org.junit.runners.ParentRunner.runLeaf(ParentRunner.java:325)
	at org.junit.runners.BlockJUnit4ClassRunner.runChild(BlockJUnit4ClassRunner.java:78)
	at org.junit.runners.BlockJUnit4ClassRunner.runChild(BlockJUnit4ClassRunner.java:57)
	at org.junit.runners.ParentRunner$3.run(ParentRunner.java:290)
	at org.junit.runners.ParentRunner$1.schedule(ParentRunner.java:71)
	at org.junit.runners.ParentRunner.runChildren(ParentRunner.java:288)
	at org.junit.runners.ParentRunner.access$000(ParentRunner.java:58)
	at org.junit.runners.ParentRunner$2.evaluate(ParentRunner.java:268)
	at org.junit.runners.ParentRunner.run(ParentRunner.java:363)
	at org.apache.maven.surefire.junit4.JUnit4Provider.execute(JUnit4Provider.java:252)
	at org.apache.maven.surefire.junit4.JUnit4Provider.executeTestSet(JUnit4Provider.java:141)
	at org.apache.maven.surefire.junit4.JUnit4Provider.invoke(JUnit4Provider.java:112)
	at sun.reflect.NativeMethodAccessorImpl.invoke0(Native Method)
	at sun.reflect.NativeMethodAccessorImpl.invoke(NativeMethodAccessorImpl.java:62)
	at sun.reflect.DelegatingMethodAccessorImpl.invoke(DelegatingMethodAccessorImpl.java:43)
	at java.lang.reflect.Method.invoke(Method.java:498)
	at org.apache.maven.surefire.util.ReflectionUtils.invokeMethodWithArray(ReflectionUtils.java:189)
	at org.apache.maven.surefire.booter.ProviderFactory$ProviderProxy.invoke(ProviderFactory.java:165)
	at org.apache.maven.surefire.booter.ProviderFactory.invokeProvider(ProviderFactory.java:85)
	at org.apache.maven.surefire.booter.ForkedBooter.runSuitesInProcess(ForkedBooter.java:115)
	at org.apache.maven.surefire.booter.ForkedBooter.main(ForkedBooter.java:75)
Caused by: java.lang.IllegalStateException: J2V8 native library not loaded
	at com.eclipsesource.v8.V8.checkNativeLibraryLoaded(V8.java:195)
	at com.eclipsesource.v8.V8.createV8Runtime(V8.java:149)
	at com.eclipsesource.v8.V8.createV8Runtime(V8.java:110)
	at guru.nidi.graphviz.engine.GraphvizV8Engine.doInit(GraphvizV8Engine.java:50)
	at guru.nidi.graphviz.engine.AbstractGraphvizEngine.init(AbstractGraphvizEngine.java:56)
	at guru.nidi.graphviz.engine.AbstractGraphvizEngine.<init>(AbstractGraphvizEngine.java:32)
	at guru.nidi.graphviz.engine.GraphvizV8Engine.<init>(GraphvizV8Engine.java:39)
	at guru.nidi.graphviz.engine.Graphviz.initEngine(Graphviz.java:50)
	at guru.nidi.graphviz.engine.Graphviz.render(Graphviz.java:111)
	... 29 more
Caused by: java.lang.UnsatisfiedLinkError: Could not load J2V8 library. Reasons: 
	no j2v8_win32_x86 in java.library.path

	at com.eclipsesource.v8.LibraryLoader.loadLibrary(LibraryLoader.java:75)
	at com.eclipsesource.v8.V8.load(V8.java:71)
	at com.eclipsesource.v8.V8.createV8Runtime(V8.java:145)
	... 38 more

It seems that the 32 bit lib of J2V8 isn't in the classpath.

Make totalMemory of viz.js configurable over the Java API

If you render a large graph, following exception can be thrown:

guru.nidi.graphviz.engine.GraphvizException: Cannot enlarge memory arrays. Either (1) compile with  -s TOTAL_MEMORY=X  with X higher than the current value 16777216, (2) compile with  -s ALLOW_MEMORY_GROWTH=1  which adjusts the size at runtime but prevents some optimizations, (3) set Module.TOTAL_MEMORY to a higher value before the program runs, or if you want malloc to return NULL (0) instead of this abort, compile with  -s ABORTING_MALLOC=0 
Cannot enlarge memory arrays. Either (1) compile with  -s TOTAL_MEMORY=X  with X higher than the current value 16777216, (2) compile with  -s ALLOW_MEMORY_GROWTH=1  which adjusts the size at runtime but prevents some optimizations, (3) set Module.TOTAL_MEMORY to a higher value before the program runs, or if you want malloc to return NULL (0) instead of this abort, compile with  -s ABORTING_MALLOC=0 

	at guru.nidi.graphviz.engine.GraphvizV8Engine.doExecute(GraphvizV8Engine.java:64)
	at guru.nidi.graphviz.engine.AbstractGraphvizEngine.execute(AbstractGraphvizEngine.java:51)
	at guru.nidi.graphviz.engine.Graphviz.execute(Graphviz.java:68)
	at guru.nidi.graphviz.engine.Renderer.toImage(Renderer.java:64)
	at guru.nidi.graphviz.engine.Renderer.toFile(Renderer.java:52)

The reason is that graphviz-java uses the default value (16MB) for the available total memory for the Emscripten module instance (see the documentation of viz.js ). The exception message signals that more memory is needed. It's possible in viz.js to increase this value for the total memory (BTW, more memory helps in my case ). But unfortunately, I can't set this value over the Java API.

It would be nice if the total memory value can be configurable over the Graphviz class.

Dynamically set the graph values based on a matrix

Hi, thanks for your great effort, your work is really great, however i wonder how is it possible to set those .with() and .link() values in the workflow of a program. for example to set the graph based on a matrix like this:

ArralyList<String> processes = new ArrayList<>();
ArrayList<guru.nidi.graphviz.model.Node> nodes = new ArrayList<>();
        for(int i=0; i<someLength; i++) {
            guru.nidi.graphviz.model.Node node = node(processes.get(i));
            nodes.add(node);
        }
        Graph g = graph("graph").directed();

        for(int i=0; i<someLength; i++) {
            for(int j=0; j<someLength; j++) {
                if(matrix[i][j] == 1) {
                    g.with(nodes.get(i).link(nodes.get(j)));
                }
            }
        }

Recommend Projects

  • React photo React

    A declarative, efficient, and flexible JavaScript library for building user interfaces.

  • Vue.js photo Vue.js

    ๐Ÿ–– Vue.js is a progressive, incrementally-adoptable JavaScript framework for building UI on the web.

  • Typescript photo Typescript

    TypeScript is a superset of JavaScript that compiles to clean JavaScript output.

  • TensorFlow photo TensorFlow

    An Open Source Machine Learning Framework for Everyone

  • Django photo Django

    The Web framework for perfectionists with deadlines.

  • D3 photo D3

    Bring data to life with SVG, Canvas and HTML. ๐Ÿ“Š๐Ÿ“ˆ๐ŸŽ‰

Recommend Topics

  • javascript

    JavaScript (JS) is a lightweight interpreted programming language with first-class functions.

  • web

    Some thing interesting about web. New door for the world.

  • server

    A server is a program made to process requests and deliver data to clients.

  • Machine learning

    Machine learning is a way of modeling and interpreting data that allows a piece of software to respond intelligently.

  • Game

    Some thing interesting about game, make everyone happy.

Recommend Org

  • Facebook photo Facebook

    We are working to build community through open source technology. NB: members must have two-factor auth.

  • Microsoft photo Microsoft

    Open source projects and samples from Microsoft.

  • Google photo Google

    Google โค๏ธ Open Source for everyone.

  • D3 photo D3

    Data-Driven Documents codes.