This project will analyze the Colorado Congressional Election data to come up with a summary consisting of the total number of votes cast, each county's turnout, each candidate's vote count and percentage, and the results with the winner.
- Data source: election_results.csv
- Software: Python 3.6.1, Visual Studio Code 1.56.2
In order to come up with the analysis of the election data I utilized python packages such as csv and os; variables like integers, floats, lists, dictionaries; modules to modify and call objects; membership and logical operators; repetition and decision statements like for loops and if statements; and different printing formats like f-strings. The code will be attached to the repo like 'PyPoll_Challenge.py', if you want to take a look to the script.
The election results were produced both as output in the terminal and as text in a file I created and wrote on automatically as the code ran.
Terminal:

election_analysis.txt:
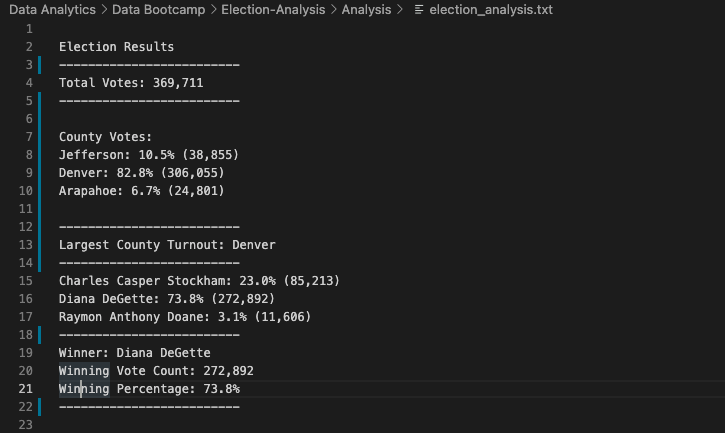
- There were 369,711 votes cast in the election.
- From all the votes, each county's turnout was as follows:
- 38,855 votes came from Jefferson, which accounted for 10.5% of the election.
- 306,055 votes came from Denver, which accounted for 82.8% of the election.
- 24,801 votes came from Anapahoe, which accounted for 6.7% of the election.
- The county with the largest nuymber of votes was Denver.
- The congressional candidates were:
- Charles Casper Stockham
- Diana DeGette
- Raymon Anthony Doane
- The candidate results were:
- Charles C. Stockham received 23.0% of the vote and 85,213 number of votes.
- Diana DeGette received 73.8% of the vote and 272,892 number of votes.
- Raymon A. Doane received 3.1% of the vote and 11,606 number of votes.
- The winner of the election was Diana DeGette with 73.8% of the vote (272,892 votes).
In conclusion, the goal was to automate the election audit so that the code would give us the results on a separate text file. Certainly, using a program is a lot more efficient than having to count all the votes individually. Python is a great tool that allowed me to count how many votes were cast, how many came from each county, and how many went to each candidate. Another good thing is that the code script is versatile and could help the election commission use it for future audits.
Learning how to code is a very monetizable skill. Coding saves up a lot of time and people are in the look for that. In this case, we can slightly change the script to make it work on other election audits. Firstly, we would have to change the data we are working with.
import csv
import os
file_to_load = os.path.join("Resources", "election_results.csv")
file_to_save = os.path.join("analysis", "election_analysis.txt")
Instead of the election_results.csv file, the commission would be able to choose from any other dataset. Of course, it would be preferable if the data is organized the same way with ballot ID on the first column, the county the cast was from in the second, and the candidate voted on the third. Nevertheless, if the dataset is not organized that way it wouldn't be a problem. The script could be manipulated to be able to read any type of data.
Likewise, if we were to have more columns or categories in the dataset such as time or time intervals in the votes, we would be able to read that information the same way. We would just need to initialize new variables such as time_interval_options list or time_interval_count interval. This way, we would be able to read how many votes were cast in a specific time frame to be able to see the chronological order of the election. Another option would be to get more specific and read the votes by neighborhoods or specific areas inside the county. We would just need to initialize the variable we want to read like the vote count, percentage out of all the votes in the area, and winner in each area.
total_votes = 0
candidate_options = []
candidate_votes = {}
county_options = []
county_votes = {}
winning_candidate = ""
winning_count = 0
winning_percentage = 0
countyHighTurnout = ""
countyMoreVotes = 0
And last but not least, would be to make the necessary corrections to our code.
with open(file_to_load) as election_data:
    reader = csv.reader(election_data)
    header = next(reader)
    for row in reader:
        total_votes = total_votes + 1
        candidate_name = row[2]
        county_name = row[1]
        if candidate_name not in candidate_options:
            candidate_options.append(candidate_name)
            candidate_votes[candidate_name] = 0
        candidate_votes[candidate_name] += 1
        if county_name not in county_options:
            county_options.append(county_name)
            county_votes[county_name] = 0
        county_votes[county_name] += 1
The first three lines of code were utilized to read the dataset. The first one was to open it, the second one was to read it, and the third one was to skip the header row. From there, we wanted to loop through all the rows to get the total votes and name the variables for both columns holding the county and candidate voted. This way, every object inside the row would be set as the variable we initialized. If we were to add the time or the specific area inside the county, then we would have variables such as time_of_vote = row[3] or neighborhood_name = row[4] to be able to iterate the dictionaries using that variable as index. After that, we would have to add an if statement in order to add the different time intervals or neighborhood to an options list for them not to repeat, and set the vote count from the dictionary to 0. That way we already have the dictionary holding the names and times as keys, to start counting each row to add the vote count as values each time the index is the same. The product would be two extra dictionaries in this case, holding the different neighborhoods as keys and how many votes cast there as values, and on the other hand a dictionary with diffrerent times as keys, like for example day 1 of the election, with the value of the number of votes cast that day.
Having the necessary information stored in dictionaries, would then make it easy for us to print it to the text file that holds the results. In conclusion, it doesn't matter if the election data has more or less votes than the one we used, the program would just iterate through each row and get the necessary information from it. This code would save the election commission a lot of time as it could instantaneously audit any election.
