Coder Social home page Coder Social logo

nguyens7 / tidynano Goto Github PK

View Code? Open in Web Editor NEW
5.0 3.0 2.0 6.05 MB

Repository for the tidyNano package to analyze and visualize NanoSight/NTA data.

Home Page: https://nguyens7.github.io/tidyNano

License: Other

R 100.00%
nanosight nta exosomes analysis visualize-data tidy nanoparticle membrane-vesicles vesicles extracellular-vesicles

tidynano's Introduction

tidyNano

tidyNano is an R package that imports raw NanoSight data and provides a framework to clean, analyze, and visualize nanoparticle analysis data. You can browse the source code on GitHub.

Check out our manuscript in PLOS ONE!

A representative video of NTA data of murine plasma exosomes from our paper.

NTA of murine plasma exosomes

News (7/2020)

Added more reprexes in the README to assist in importing data.

Fixed custom_name argument in nanoimport() function and nanocombine() function.

nanoimport() has just been updated to be more flexible and works with NTA versions 3.0 - 3.4! The function should be able to detect and import your data.

nanolyze() and nanocount() both will ungroup data.

Nomenclature
We recommend naming your files in snake_case so it’s conducive for processing with the nanotidy() function. With each sample we recommend adding important information so you can parse it out during analysis, be sure to influde the dilution value in the sample name if you do not enter it during the dilution entry box during acquisition. For example you can name your files using the general formula SampleID_Treatment_1500_. Be sure to leave a _ at the end so the NTA software will append your files with a numerical count (00,01,02…) which will serve as way to track your technical replicates.

If you already collected you data and don’t have your dilution in your sample name you can simply add the dilution when you use nanoimport(). Simply add the dilution value in the custom_name argument. If you did label your samples and enter in the dilution in the NTA software during acquisition you can make auto_name == TRUE in nanoimport().

Overview

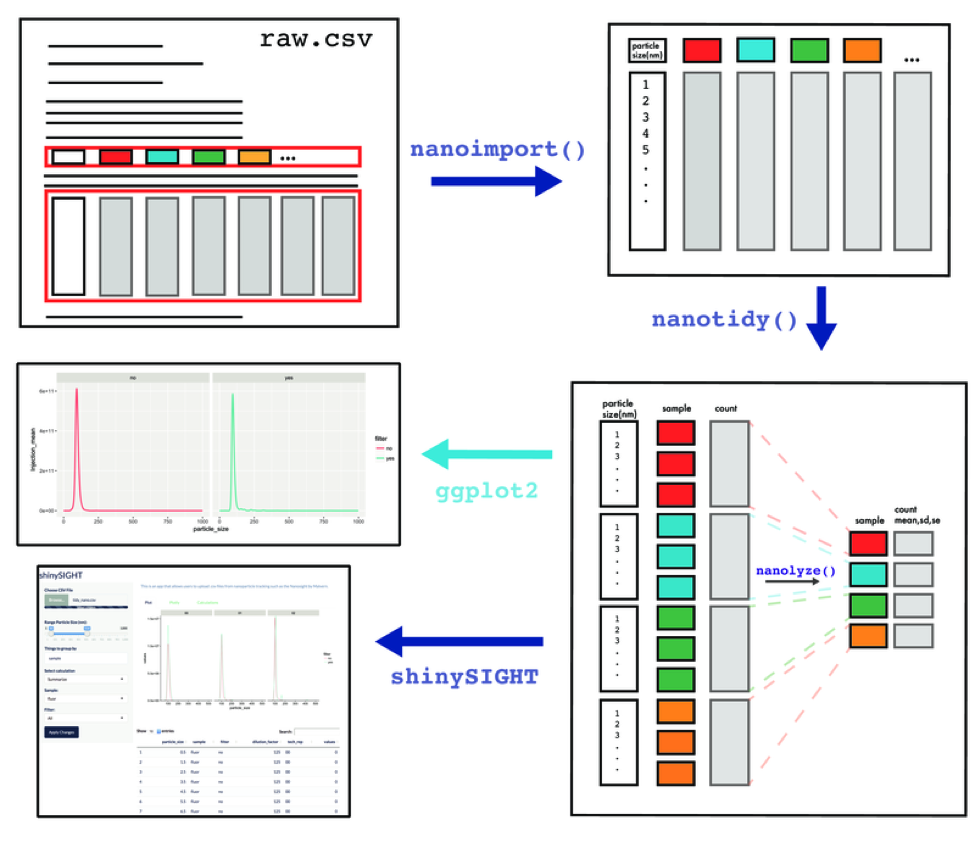
tidyNano functions (Purple) allow for easily extracting and converting raw NTA count data into a tidy dataframe that is suitable for analysis using dplyr and ggplot2. tidyNano also provides a interactive shiny application (shinySIGHT) for visualizing data.

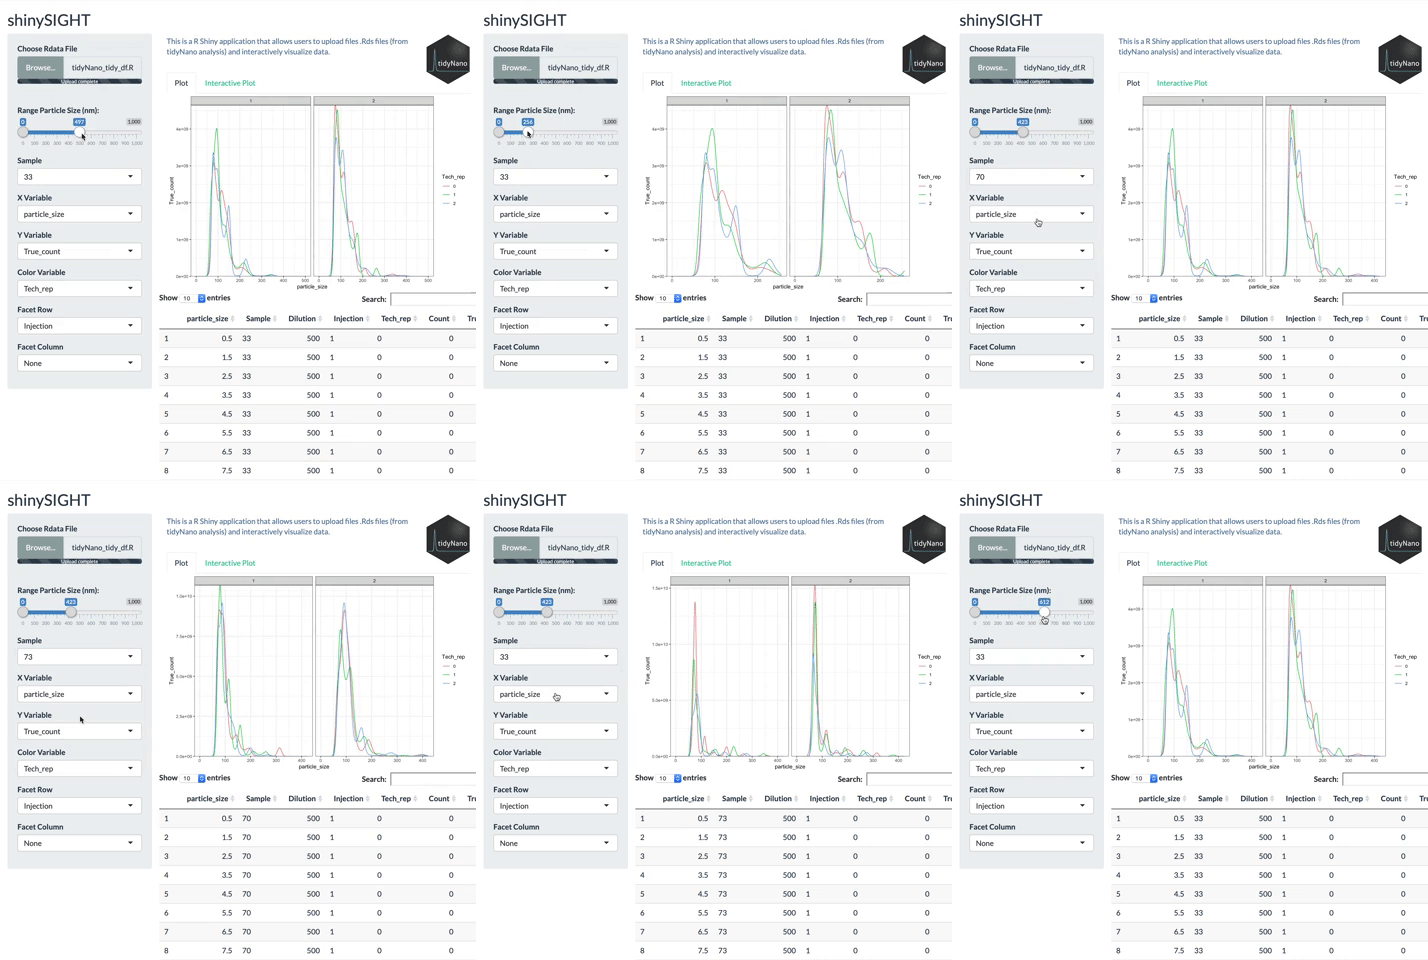
tidyNano also includes a Shiny app named shinySIGHT for interactive visualization of NTA data.

shinySIGHT

Installation

The latest development version can be installed from github:

# install.packages("devtools")

# devtools::install_github("nguyens7/tidyNano")

# tidyNano Example

library(tidyNano)
library(tidyverse)

file <- system.file("extdata", "beads.csv", package = "tidyNano")

data <- nanoimport(file)  

head(data)
#>   particle_size std_10000_yes_2_00 std_10000_yes_2_01 std_10000_yes_2_02
#> 1           0.5                  0                  0                  0
#> 2           1.5                  0                  0                  0
#> 3           2.5                  0                  0                  0
#> 4           3.5                  0                  0                  0
#> 5           4.5                  0                  0                  0
#> 6           5.5                  0                  0                  0
#>   std_10000_no_2_00 std_10000_no_2_01 std_10000_no_2_02 std_10000_yes_1_00
#> 1                 0                 0                 0                  0
#> 2                 0                 0                 0                  0
#> 3                 0                 0                 0                  0
#> 4                 0                 0                 0                  0
#> 5                 0                 0                 0                  0
#> 6                 0                 0                 0                  0
#>   std_10000_yes_1_01 std_10000_yes_1_02 std_10000_no_1_00 std_10000_no_1_01
#> 1                  0                  0                 0                 0
#> 2                  0                  0                 0                 0
#> 3                  0                  0                 0                 0
#> 4                  0                  0                 0                 0
#> 5                  0                  0                 0                 0
#> 6                  0                  0                 0                 0
#>   std_10000_no_1_02
#> 1                 0
#> 2                 0
#> 3                 0
#> 4                 0
#> 5                 0
#> 6                 0

nanoimport is a function that extracts the particle data from raw a nanosight .csv file and creates a dataframe that is suitable for cleaning within R. Note: This assumes you added the dilution factor when you named your samples during acquistion.

data <- nanoimport(file) 
#> NTA version: 3.2
#> Sample name:
#> Dilution line no: 42
#> Warning in function_list[[k]](value): NAs introduced by coercion
#> Dilution factor detected: NA
#> Auto name = FALSE
#> Custom name: NULL
#> Dilution value: 1 (Didn't parse)

head(data)
#>   particle_size std_10000_yes_2_00 std_10000_yes_2_01 std_10000_yes_2_02
#> 1           0.5                  0                  0                  0
#> 2           1.5                  0                  0                  0
#> 3           2.5                  0                  0                  0
#> 4           3.5                  0                  0                  0
#> 5           4.5                  0                  0                  0
#> 6           5.5                  0                  0                  0
#>   std_10000_no_2_00 std_10000_no_2_01 std_10000_no_2_02 std_10000_yes_1_00
#> 1                 0                 0                 0                  0
#> 2                 0                 0                 0                  0
#> 3                 0                 0                 0                  0
#> 4                 0                 0                 0                  0
#> 5                 0                 0                 0                  0
#> 6                 0                 0                 0                  0
#>   std_10000_yes_1_01 std_10000_yes_1_02 std_10000_no_1_00 std_10000_no_1_01
#> 1                  0                  0                 0                 0
#> 2                  0                  0                 0                 0
#> 3                  0                  0                 0                 0
#> 4                  0                  0                 0                 0
#> 5                  0                  0                 0                 0
#> 6                  0                  0                 0                 0
#>   std_10000_no_1_02
#> 1                 0
#> 2                 0
#> 3                 0
#> 4                 0
#> 5                 0
#> 6                 0

nanoimport without dilution factor in the sample name

If you didn’t include your dilution factor in the sample name you can use the argument auto_name == TRUE within the nanoimport() function.

file2 <- system.file("extdata", "beads2.csv", package = "tidyNano")

data2 <- nanoimport(file2, auto_name = TRUE)
#> NTA version: 3.4
#> Sample name:
#> Dilution line no: 44
#> Dilution factor detected: 10000
#> Auto name: _10000
#> Custom name: NULL
#> Dilution value: 10000

head(data2)
#>   particle_size stdv34_00_10000 stdv34_01_10000 stdv34_02_10000 stdv34_03_10000
#> 1           0.5               0               0               0               0
#> 2           1.5               0               0               0               0
#> 3           2.5               0               0               0               0
#> 4           3.5               0               0               0               0
#> 5           4.5               0               0               0               0
#> 6           5.5               0               0               0               0
#>   stdv34_04_10000
#> 1               0
#> 2               0
#> 3               0
#> 4               0
#> 5               0
#> 6               0

You can even add a custom name to append extra information to your sample columns using the custom_name() argument.

custom_name_data2 <- nanoimport(file2, auto_name = TRUE, custom_name = "YourLabelHere")
#> NTA version: 3.4
#> Sample name:
#> Dilution line no: 44
#> Dilution factor detected: 10000
#> Auto name: _YourLabelHere_10000
#> Custom name: YourLabelHere
#> Dilution value: 10000

head(custom_name_data2)
#>   particle_size stdv34_00_YourLabelHere_10000 stdv34_01_YourLabelHere_10000
#> 1           0.5                             0                             0
#> 2           1.5                             0                             0
#> 3           2.5                             0                             0
#> 4           3.5                             0                             0
#> 5           4.5                             0                             0
#> 6           5.5                             0                             0
#>   stdv34_02_YourLabelHere_10000 stdv34_03_YourLabelHere_10000
#> 1                             0                             0
#> 2                             0                             0
#> 3                             0                             0
#> 4                             0                             0
#> 5                             0                             0
#> 6                             0                             0
#>   stdv34_04_YourLabelHere_10000
#> 1                             0
#> 2                             0
#> 3                             0
#> 4                             0
#> 5                             0
#> 6                             0
tidy_data <- data  %>% 
  nanotidy(sep_var = c("Sample", "Dilution","Filter","Injection","Tech_rep"))

head(tidy_data)
#>   particle_size Sample Dilution Filter Injection Tech_rep Count True_count
#> 1           0.5    std    10000    yes         2        0     0          0
#> 2           1.5    std    10000    yes         2        0     0          0
#> 3           2.5    std    10000    yes         2        0     0          0
#> 4           3.5    std    10000    yes         2        0     0          0
#> 5           4.5    std    10000    yes         2        0     0          0
#> 6           5.5    std    10000    yes         2        0     0          0
tidy_data %>% 
  ggplot(aes(x = particle_size, y = True_count, color = Tech_rep)) +
  geom_line(size = 1) +
  facet_wrap(Injection ~ Filter)
tidynano's People

Contributors

soohyuna avatar

Stargazers

 avatar  avatar  avatar  avatar  avatar

Watchers

 avatar  avatar  avatar

Forkers

soohyuna noormu

tidynano's Issues

Nanocombine not working in conjuction with Nanotidy()

Error: Names must be unique. x These names are duplicated: * "particle_size" at locations 91, 122, and 243. Run rlang::last_error() to see where the error occurred.

I am attempting to combine multiple csv files exported from the nanosight. When I add use the nanocombine function, all the data is merged into one DF, but it pulls particle size from each csv resulting in redundant columns names. I believe this is incompatible with the subsequent nanotidy function.

Error thrown by nanoShapiro function

Hi there,

First of all, thanks for creating this useful package.

I was having trouble getting the nanoShapiro function to work. When I was using it on a total exosome count table similar to Fig 6A in your preprint it would throw the following error.

Error in mutate_impl(.data, dots) : 
  Column `broom::glance` is of unsupported type function

I made a tiny adjustment to the function which fixed the issue.

Original nanoShapiro

function (df, ..., value) {
  group_var <- rlang::quos(...)
  value <- enquo(value)

  df %>% 
    dplyr::group_by(!!! group_var) %>% 
    tidyr::nest() %>% 
    dplyr::mutate(
        Shapiro = purrr::map(data, ~stats::shapiro.test(pull(.x, quo_name(value)))), 
        glance = purrr::map(Shapiro, broom::glance)) %>% 
    tidyr::unnest(broom::glance, .drop = TRUE) %>% 
    dplyr::mutate(Normal_dist = dplyr::case_when(p.value > 0.05 ~ TRUE, 
                                                 p.value < 0.05 ~ FALSE), 
                  Statistical_test = dplyr::case_when(Normal_dist == TRUE ~ "Perform parametric test",
                                                      Normal_dist == FALSE ~ "Perform non-parametric test"))
}

Adjusted nanoShapiro

function (df, ..., value) {
  group_var <- rlang::quos(...)
  value <- enquo(value)

  df <- df %>% 
    dplyr::group_by(!!! group_var) %>% 
    tidyr::nest() %>% 
    dplyr::mutate(
        Shapiro = purrr::map(data, ~stats::shapiro.test(pull(.x, quo_name(value)))), 
        glance = purrr::map(Shapiro, broom::glance)) %>% 
    tidyr::unnest(broom::glance, .drop = TRUE) %>% 
    dplyr::mutate(Normal_dist = dplyr::case_when(p.value > 0.05 ~ TRUE, 
                                                 p.value < 0.05 ~ FALSE), 
                  Statistical_test = dplyr::case_when(Normal_dist == TRUE ~ "Perform parametric test",
                                                      Normal_dist == FALSE ~ "Perform non-parametric test"))
  return(df)
}

Hopefully that helps anyone else having a similar problem.

Cheers,
Charlotte

object '[Data Included]' not found

Hi there, thanks for writing the package.

I installed and followed your instructions, trying the example first which imports the data like it should. When I go to import my own data i get the following error:

data.file <- "~/Caseinate_NTA/Caseinates_Nanosight/A1A1/A1_35.csv"
data <- nanoimport(data.file)
NTA version: 3
Sample name: Sample 35 caseinates 1500x dil
Error in .f(.x[[i]], ...) : object '[Data Included]' not found

I checked my file and it looks exactly like your example file, and the [Data Included] line is
my file. Help!

I attach my file as a .txt so I could upload it. Just change it back to .csv to use.

A1_35 - Copy.txt

nanotidy and nanoimport

Hello,

I am having a problem while using nanotidy() function. My samples are uploaded with nano import (but each sample on which 5 trials were done on NTA) is uploaded separately and then i merged them. I am having a problem of seeing the dilution, technical replicate information, etc. when i upload these files.

do you have a more detailed vignette or more explanations on what parameters could be used in these two functions with some examples?
In the publication & the Readme file, the uploaded .csv file contains all the samples, whereas normally, typical NTA data comes in separate .csv file for each sample.
thank you
best

Recommend Projects

  • React photo React

    A declarative, efficient, and flexible JavaScript library for building user interfaces.

  • Vue.js photo Vue.js

    🖖 Vue.js is a progressive, incrementally-adoptable JavaScript framework for building UI on the web.

  • Typescript photo Typescript

    TypeScript is a superset of JavaScript that compiles to clean JavaScript output.

  • TensorFlow photo TensorFlow

    An Open Source Machine Learning Framework for Everyone

  • Django photo Django

    The Web framework for perfectionists with deadlines.

  • D3 photo D3

    Bring data to life with SVG, Canvas and HTML. 📊📈🎉

Recommend Topics

  • javascript

    JavaScript (JS) is a lightweight interpreted programming language with first-class functions.

  • web

    Some thing interesting about web. New door for the world.

  • server

    A server is a program made to process requests and deliver data to clients.

  • Machine learning

    Machine learning is a way of modeling and interpreting data that allows a piece of software to respond intelligently.

  • Game

    Some thing interesting about game, make everyone happy.

Recommend Org

  • Facebook photo Facebook

    We are working to build community through open source technology. NB: members must have two-factor auth.

  • Microsoft photo Microsoft

    Open source projects and samples from Microsoft.

  • Google photo Google

    Google ❤️ Open Source for everyone.

  • D3 photo D3

    Data-Driven Documents codes.