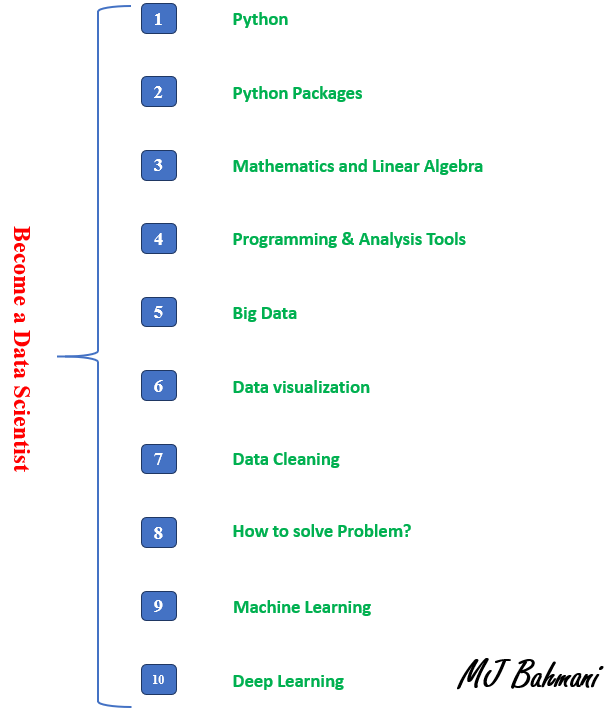
- [Python]
- [Python Packages]
- [Mathematics and Linear Algebra]
- [Programming & Analysis Tools]
- [Big Data]
- [Data visualization]
- [Data Cleaning]
- [How to solve Problem?]
- [Machine Learning]
- [Deep Learning]
If you Read and Follow Job Ads to hire a machine learning expert or a data scientist, you find that some skills you should have to get the job. In this Kernel, I want to review 10 skills that are essentials to get the job
In fact, this kernel is a reference for ten other kernels, which you can learn with them, all of the skills that you need.
for Reading this section please fork and upvote this kernel:
numpy-pandas-matplotlib-seaborn-scikit-learn
As machine learning engineer I would like to compare 4 machine learning programming languages(tools). Let's take this a bit deeper. Since most of us are concerned with ML and analysis being a big part of why we are using these programs. I want to list a few advantages and disadvantages of each for who want to start learning them as a data scientist. ##1-1-1 R R is a language and environment for statistical computing and graphics. It is a GNU project which is similar to the S language and environment which was developed at Bell Laboratories (formerly AT&T, now Lucent Technologies) by John Chambers and colleagues. R can be considered as a different implementation of S. There are some important differences, but much code written for S runs unaltered under R. ###1-1-1-1 Advantages of R
- End To End development to execution (some brokers packages allows execution, IB)
- Rapid development speed (60% fewer lines vs python, ~500% less than C)
- A large number of Open Source Packages
- Mature quantitative trading packages( quantstrat, quantmod, performanceanalyitics, xts)
- Largest Community
- Can integrate into C++/C with rcpp
- Slow vs Python especially in iterative loops and non vectorized functions
- Worse plotting than Matlab and difficult to implement interactive charts
- Limited capabilities in creating stand-alone applications
Python is an interpreted high-level programming language for general-purpose programming. Created by Guido van Rossum and first released in 1991, Python has a design philosophy that emphasizes code readability, notably using significant whitespace. It provides constructs that enable clear programming on both small and large scales.
- End To End development to execution (some brokers packages allows execution, IB)
- Open source packages( Pandas, Numpy, scipy)
- Trading Packages(zipline, pybacktest, pyalgotrade)
- best for general programming and application development
- can be a "glue" language to connect R, C++, and others (python)
- Fastest general speed especially in iterative loops
- immature packages especially trading packages
- some packages are not compatible with others or contain overlap
- smaller community than R in finance
- More code required for same operations vs R or Matlab
- Silent errors that can take a very long time to track down (even with visual debuggers / IDE
MATLAB (matrix laboratory) is a multi-paradigm numerical computing environment. A proprietary programming language developed by MathWorks, MATLAB allows matrix manipulations, plotting of functions and data, implementation of algorithms, a creation of user interfaces, and interfacing with programs written in other languages, including C, C++, C#, Java, Fortran, and Python. Although MATLAB is intended primarily for numerical computing, an optional toolbox uses the MuPAD symbolic engine, allowing access to symbolic computing abilities. An additional package, Simulink, adds graphical multi-domain simulation and model-based design for dynamic and embedded systems.
Fastest mathematical and computational platform especially vectorized operations/ linear matrix algebra Commercial level packages for all fields of mathematics and trading Very short scripts considering the high integration of all packages Best visualization of plots and interactive charts Well tested and supported due to it being a commercial product Easy to manage multithreaded support and garbage collection Best debugger
Can not execute - must be translated into another language Expensive ~1000 per license and 50+ per additional individual package Can not integrate well with other languages Hard to detect biases in trading systems (it was built for math and engineering simulations) so extensive testing may be required. EG. look ahead bias Worst performance for iterative loops Can not develop stand-alone applications at all.
Octave is sort of the GNU answer to the commercial language MATLAB. That is, it is a scripting matrix language, and has a syntax that is about 95% compatible with MATLAB. It's a language designed by engineers, and thus is heavily loaded with routines commonly used by engineers. It has many of the same time series analysis routines, statistics routines, file commands, and plotting commands of the MATLAB language.
First of all, there is no robust Octave compiler available and this is not really necessary either since the software can be installed free of charge. Looking at the language element the two packages are identical except for some particularities like nested functions. Octave is under constant active development and every deviation from the Matlab syntax is treated as a bug or at least an issue to be resolved. There are also plenty of toolboxes available for octave and as long as a program does not require graphical output there is a good chance that it runs under Octave just like under Matlab without considerable modification. Graphics capabilities are clearly an advantage of Matlab. The latest versions include a GUI designer on top of excellent visualization features. Octave uses either GNU Plot or JHandles as graphics packages, where the latter is somehow closer to what Matlab provides. However, there are no Octave equivalents to a GUI designer and the visualization mechanisms are somehow limited and not Matlab compatible. The same holds for an integrated development environment. There is a project called QTOctave but it is still at an early stage. Looking at the collaborate efforts taking place around the Octave community it is likely that this software will soon provide better and possibly even compatible graphics and GUI capabilities and it is well worth a look before buying Matlab.
it just a free open source of MATLAB and don't bring us anything new


- Numpy
- Pandas
- Matplotlib
- Seaborn

numpy-pandas-matplotlib-seaborn-scikit-learn
for Reading this section please fork and upvote this kernel:
for Reading this section please fork and upvote this kernel:
for Reading this section please fork and upvote this kernel:
A-Comprehensive-Deep-Learning-Workflow-with-Python
we will release the full version of Deep Learning Coming Soon
we will release the full version of Deep Learning Coming Soon
Data Science has so many techniques and procedures that can confuse anyone.
Step 1: Translate your business problem statement into technical one
Analogous to any other software problem, data science aims at solving a business problem. Most of the times, business problem statements are vague and can be interpreted in multiple ways. This occurs mostly because we generally use qualitative words in our language which cannot be directly translated into a machine readable code.
Eg. Let’s say we need to develop a solution to reduce crime rate of a city. The term “reduce” can be interpreted as:
Decreasing crime rate of areas with high crime rate Decreasing crime rate of the most common type of crime It is a good practice to circle back with the client or the business team who define the problem to decide on the right interpretation.
Step 2: Decide on the supervised learning technique
The end goal of almost every data science problem is usually classification or regression. Deciding the supervised technique for the problem will help you get more clarity on the business statement.
Eg. Let’s look at our problem of reducing crime rate. While the problem of reducing crime rate is more of a policy decision, depending on the choice above, we would have to decide if we need to do classification or regression.
If we need to decrease crime rate of areas with high crime rate, we would need to determine the crime rate rate of an area. This is a regression problem. If we need to decrease crime rate of most common type of crime, we would need to determine the most common type of crime in an area. This is a classification problem. Again it is a good practice to circle back with the client or the business team who define the problem requirements to clarify on the exact requirement.
Step 3: Literature survey
Literature Survey is one of the most important step (and often most ignored step) to approach any problem. If you read any article about components of Data Science, you will find computer science, statistics / math and domain knowledge. As it is quite inhuman for someone to have subject expertise in all possible fields, literature survey can often help in bridging the gaps of inadequate subject expertise.
After going through existing literature related to a problem, I usually try to come up with a set of hypotheses that could form my potential set of features. Going through existing literature helps you understand existing proofs in the domain serving as a guide to take the right direction in your problem. It also helps in interpretation of the results obtained from the prediction models.
Eg. Going back to our problem of reducing crime rate, if you want to predict crime rate of an area, you would consider factors from general knowledge like demographics, neighboring areas, law enforcement rules etc. Literature survey will help you consider additional variables like climate, mode of transportation, divorce rate etc.
Step 4: Data cleaning
If you speak with anyone who has spent some time in data science, they will always say that most of their time is spent on cleaning the data. Real world data is always messy. Here are a few common discrepancies in most data-sets and some techniques of how to clean them:
Missing values Missing values are values that are blank in the data-set. This can be due to various reasons like value being unknown, unrecorded, confidential etc. Since the reason for a value being missing is not clear, it is hard to guess the value.
You could try different techniques to impute missing values starting with simple methods like column mean, median etc. and complex methods like using machine leaning models to estimate missing values.
Duplicate records The challenge with duplicate records is identifying a record being duplicate. Duplicate records often occur while merging data from multiple sources. It could also occur due to human error. To identify duplicates, you could approximate a numeric values to certain decimal places and for text values, fuzzy matching could be a good start. Identification of duplicates could help the data engineering team to improve collection of data to prevent such errors.
Incorrect values Incorrect values are mostly due to human error. For Eg. If there is a field called age and the value is 500, it is clearly wrong. Having domain knowledge of the data will help identify such values. A good technique to identify incorrect values for numerical columns could be to manually look at values beyond 3 standard deviations from the mean to check for correctness.
Step 5: Feature engineering
Feature Engineering is one of the most important step in any data science problem. Good set of features might make simple models work for your data. If features are not good enough, you might need to go for complex models. Feature Engineering mostly involves:
Removing redundant features
If a feature is not contributing a lot to the output value or is a function of other features, you can remove the feature. There are various metrics like AIC and BIC to identify redundant features. There are built in packages to perform operations like forward selection, backward selection etc. to remove redundant features.
Transforming a feature A feature might have a non linear relationship with the output column. While complex models can capture this with enough data, simple models might not be able to capture this. I usually try to visualize different functions of each column like log, inverse, quadratic, cubic etc. and choose the transformation that looks closest to a normal curve.
Step 6: Data modification
Once the data is cleaned, there are a few modifications that might be needed before applying machine learning models. One of the most common modification would be scaling every column to the same range in order to give same weight to all columns. Some of the other required modifications might be data specific Eg. If output column is skewed, you might need to up-sample or down-sample.
Steps 7 through 9 are iterative.
Step 7: Modelling
Once I have the data ready, I usually start with trying all the standard machine learning models. If it is a classification problem, a good start will beLogistic Regression, Naive Bayes, k-Nearest Neighbors, Decision Tree etc. If it is a regression problem, you could try linear regression, regression tree etc. The reason for starting with simple models is that simple models have lesser parameters to alter. If we start with a complex model like Neural Network orSupport Vector Machines, there are so many parameters that you could change that trying all options exhaustively might be time consuming.
Each of the machine learning models make some underlying assumptions about the data. For Eg. Linear Regression / Logistic Regression assumes that the data comes from a linear combination of input parameters. Naive Bayes makes an assumption that the input parameters are independent of each other. Having the knowledge of these assumptions can help you judge the results of the different models. It is often helpful to visualize the actual vs predicted values to see these differences.
Step 8: Model comparison
One of the most standard technique to evaluate different machine learning models would be through the process of cross validation. I usually choose 10-fold cross validation but you may choose the right cross validation split based on the size of the data. Cross validation basically brings out an average performance of a model. This can help eliminate choosing a model that performs good specific to the data or in other words avoid over-fitting. It is often a good practice to randomize data before cross validation.
A good technique to compare performance of different models is ROC curves. ROC curves help you visualize performance of different models across different thresholds. While ROC curves give a holistic sense of model performance, based on the business decision, you must choose the performance metric like Accuracy, True Positive Rate, False Positive Rate, F1-Score etc.
Step 9: Error analysis
At this point, you have tried a bunch of machine learning models and got the results. It is a good usage of time to not just look at the results like accuracy or True Positive Rate but to look at the set of data points that failed in some of the models. This will help you understand the data better and improve the models faster than trying all possible combinations of models. This is the time to try ensemble models like Random Forest, Gradient Boosting or a meta model of your own [Eg. Decision tree + Logistic Regression]. Ensemble models are almost always guaranteed to perform better than any standard model.
Step 10: Improving your best model
Once I have the best model, I usually plot training vs testing accuracy [or the right metric] against the number of parameters. Usually, it is easy to check training and testing accuracy against number of data points. Basically this plot will tell you whether your model is over-fitting or under-fitting. This articleDetecting over-fitting vs under-fitting explains this concept clearly.
Understanding if your model is over-fitting or under-fitting will tell you how to proceed with the next steps. If the model is over-fitting, you might consider collecting more data. If the model is under-fitting, you might consider making the models more complex. [Eg. Adding higher order terms to a linear / logistic regression]
Step 11: Deploying the model
Once you have your final model, you would want the model to be deployed so that it automatically predicts output for new data point without retraining. While you can derive a formula for simple models like Linear Regression, Logistic Regression, Decision Tree etc. , it is not so straight forward for complex models like SVM, Neural Networks, Random Forest etc. I’m not very familiar with other languages but Python has a library called pickle which allows you to save models and use it to predict output for new data.
Step 12: Adding feedback
Usually, data for any data science problem is historical data. While this might be similar to the current data up-to a certain degree, it might not be able to capture the current trends or changes. For Eg. If you are using population as an input parameter, while population from 2015–2016 might vary slightly, if you use the model after 5 years, it might give incorrect results.
One way to deal with this problem is to keep retraining your model with additional data. This might be a good option but retraining a model might be time consuming. Also, if you have applications in which data inflow is huge, this might need to be done at regular intervals. An alternative and a better option would be to use active learning. Active learning basically tries to use real time data as feedback and automatically update the model. The most common approaches to do this are Batch Gradient Descent and Stochastic Gradient Descent. It might be appropriate to use the right approach based on the application.
Concluding remarks
The field of data science is really vast. People spend their lifetime researching on individual topics discussed above. As a data scientist, you would mostly have to solve business problems than researching on individual subtopics. Additionally, you will have to explain the technical process and results to business teams who might not have enough technical knowledge. Thus, while you might not need a very in-depth knowledge of every technique, you need to have enough clarity to abstract the technical process and results and explain it in business terms.3
for Reading this section please fork and upvote this kernel:
A Comprehensive ML Workflow with Python
for Reading this section please fork and upvote this kernel:
Fork and Run this kernel on GitHub:
