Check it in my potfolio: https://neelanjan-chakraborty.github.io/project1.html
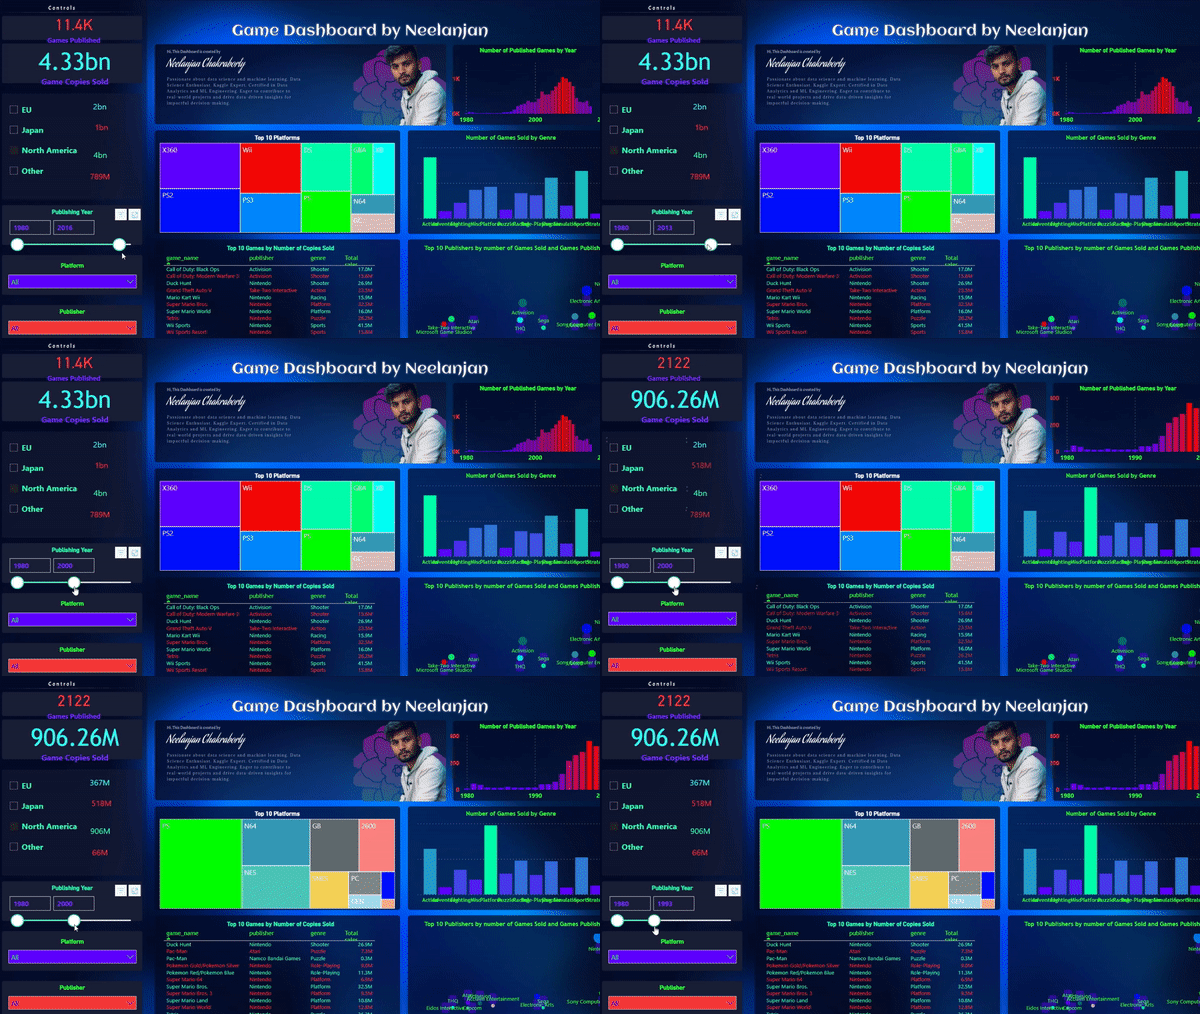
🔹 Project Objective: Develop a powerful Power BI dashboard to analyze and visualize computer game sales and popularity across various genres and time stamps.
🔹 Dashboard Features:
- Interactive Charts: Utilize visually appealing charts and graphs to display sales and popularity data.
- Genre Comparison: Compare game sales and popularity across different genres to identify trends and patterns.
- Time Stamps: Incorporate time-based filters to examine the performance of games over specific periods.
- Sales Metrics: Showcase key sales metrics, such as revenue, units sold, and average price per game.
- Popularity Ranking: Implement a ranking system to highlight the most popular games in each genre.
- Historical Analysis: Enable users to explore historical data to identify long-term performance trends.
🔹 Data Integration:
- Data Sources: Integrate data from various sources, including game sales databases, genre classifications, and timestamp records.
- ETL Processes: Implement Extract, Transform, Load (ETL) processes to clean and transform the data for efficient analysis.
- Data Refresh: Schedule regular data refreshes to ensure the dashboard reflects the most up-to-date information.
🔹 User-Friendly Interface:
- Responsive Design: Create a responsive dashboard layout that adapts to different screen sizes and devices.
- Intuitive Filters: Provide user-friendly filters for genre selection, time range, and sorting options.
- Tooltips and Interactivity: Incorporate tooltips and interactive elements to enhance the user experience.
🔹 Insights and Decision-Making:
- Game Performance Analysis: Gain insights into which genres have the highest sales and popularity.
- Seasonality Patterns: Identify seasonal trends and understand which genres perform better during specific times of the year.
- Investment Opportunities: Discover potential investment opportunities by examining underperforming genres or emerging trends.
- Marketing Strategy: Develop effective marketing strategies based on the popularity and sales performance of specific games.
🔹 Deliverables:
- Power BI Dashboard: A fully functional Power BI dashboard that presents game sales and popularity across genres and time stamps.
- Documentation: Comprehensive documentation explaining the data sources, ETL processes, dashboard functionalities, and user guide.
🚀 This Computer Game Dashboard project harnesses the power of Power BI to provide game developers, marketers, and stakeholders with valuable insights for making data-driven decisions in the ever-evolving computer game industry. Let the numbers guide your gaming success! 📈🎮💡


