Coder Social home page Coder Social logo

nbrown02 / flowviz Goto Github PK

View Code? Open in Web Editor NEW
187.0 25.0 49.0 241.34 MB

A Power BI template that provides easy to understand, actionable flow metrics and predictive analytics for your agile teams using Azure DevOps, Azure DevOps Server and/or TFS.

Home Page: https://flowviz.thinkific.com/courses/fundamentals

License: MIT License

metrics vsts dataviz vsts-extension powerbi datavisualization dashboard visualization azure-boards azure-metrics

flowviz's Introduction

FlowViz - Metrics for teams using Azure DevOps

What is it?

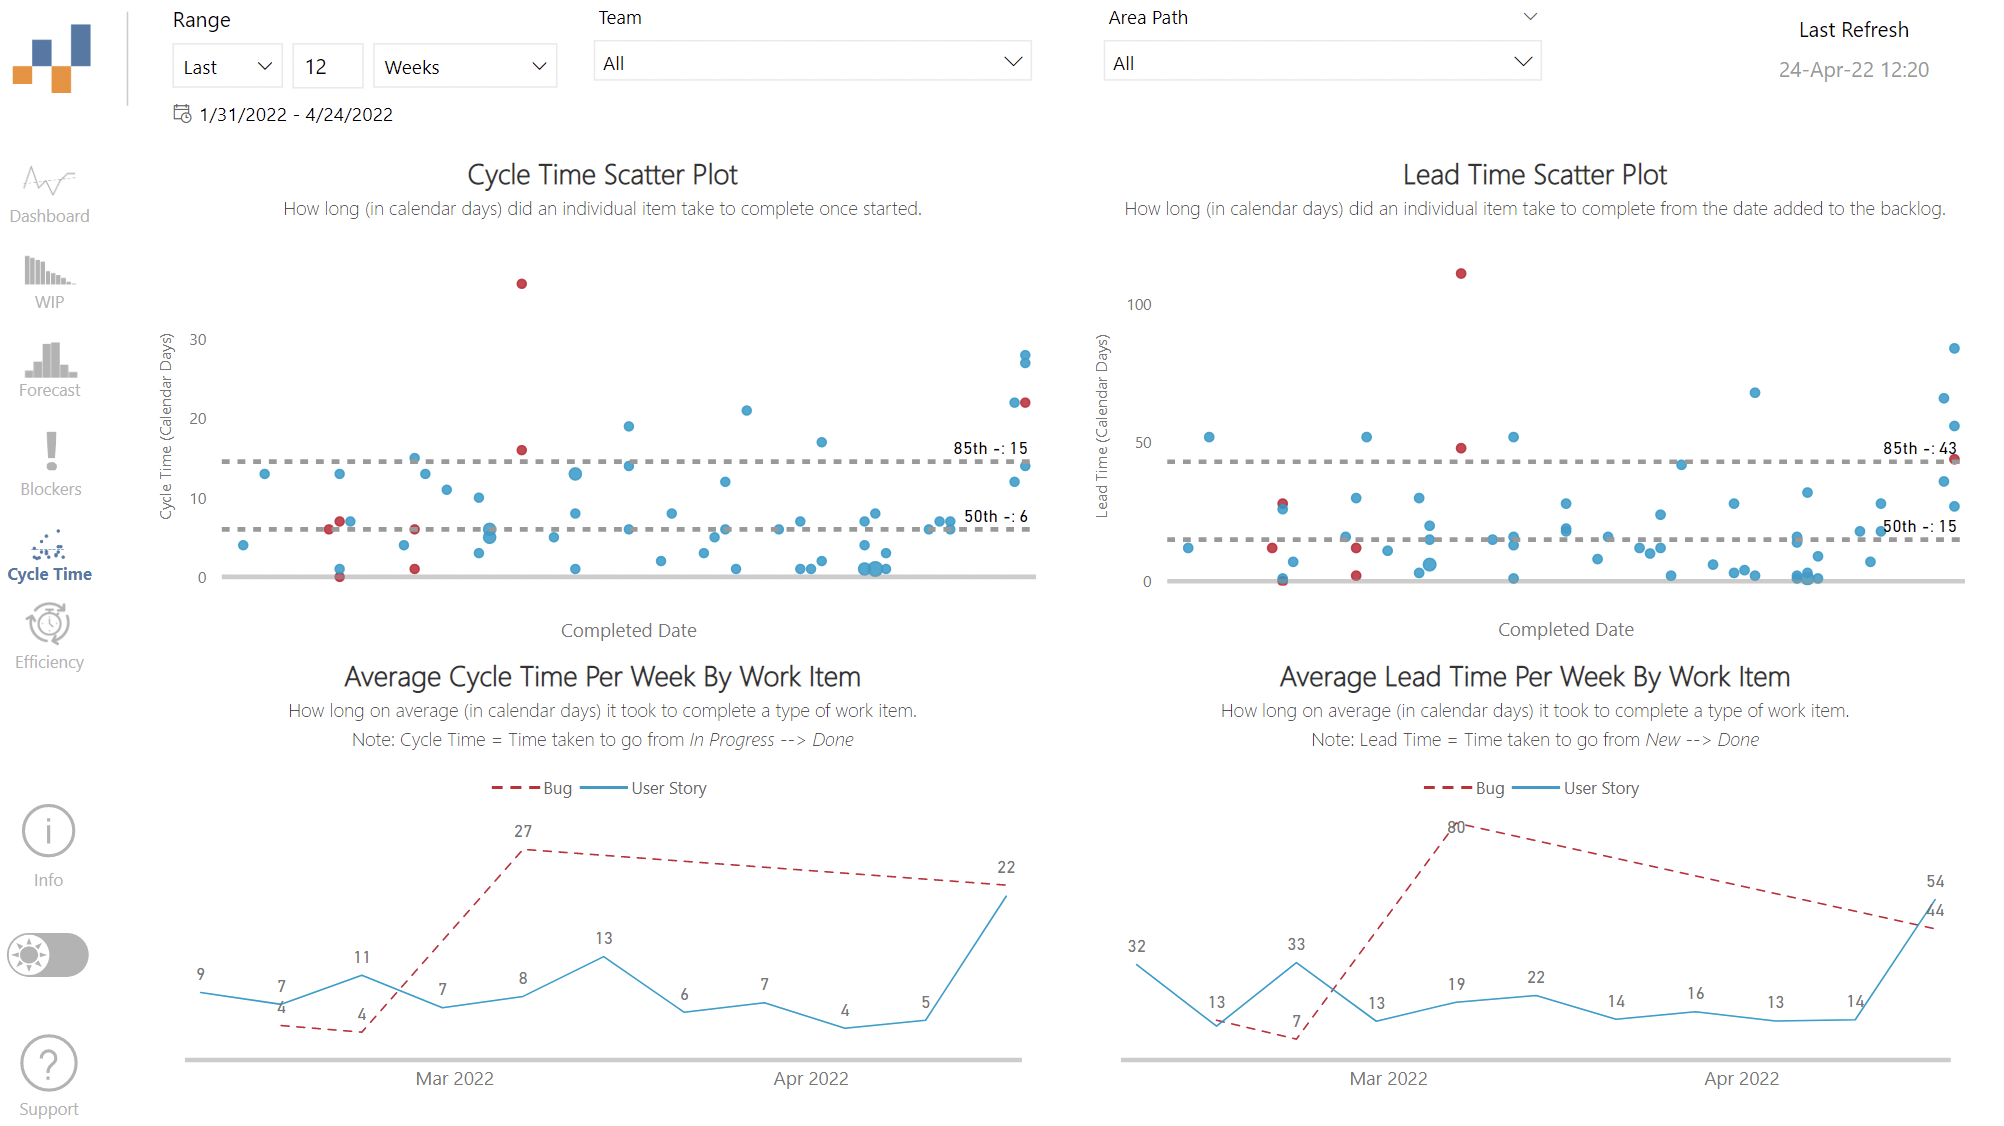
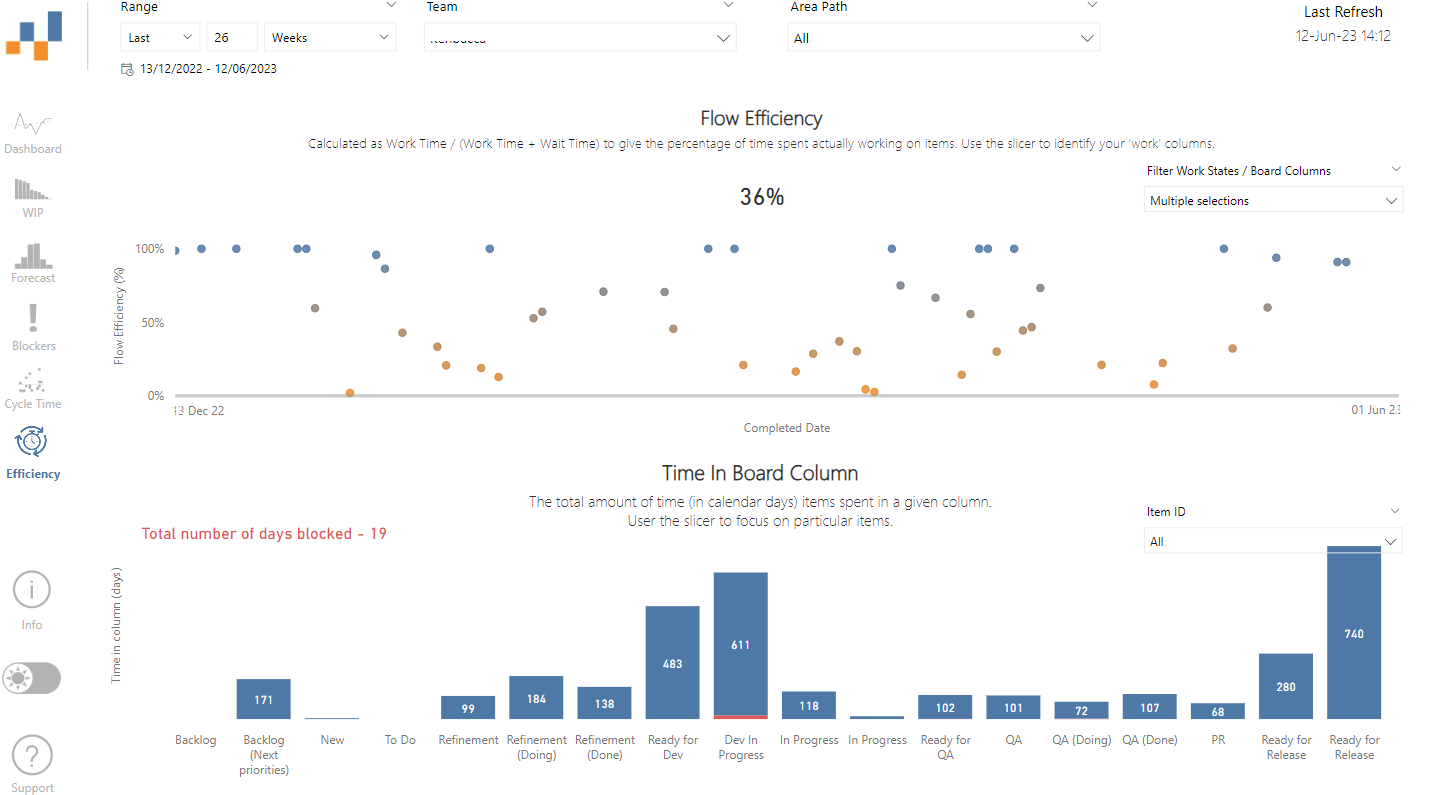
This dashboard is for all Agile teams using Azure DevOps, Azure DevOps Server and/or TFS, who want to leverage their data to have better conversations and make more informed decisions. It was built due to years of frustration with 'velocity' and other traditional agile metrics. These are centered on flow, as well as providing forecasting techniques you can use to give customers greater confidence/transparency in your delivery.

Prerequisites

Connectivity

  • Open the .pbit file
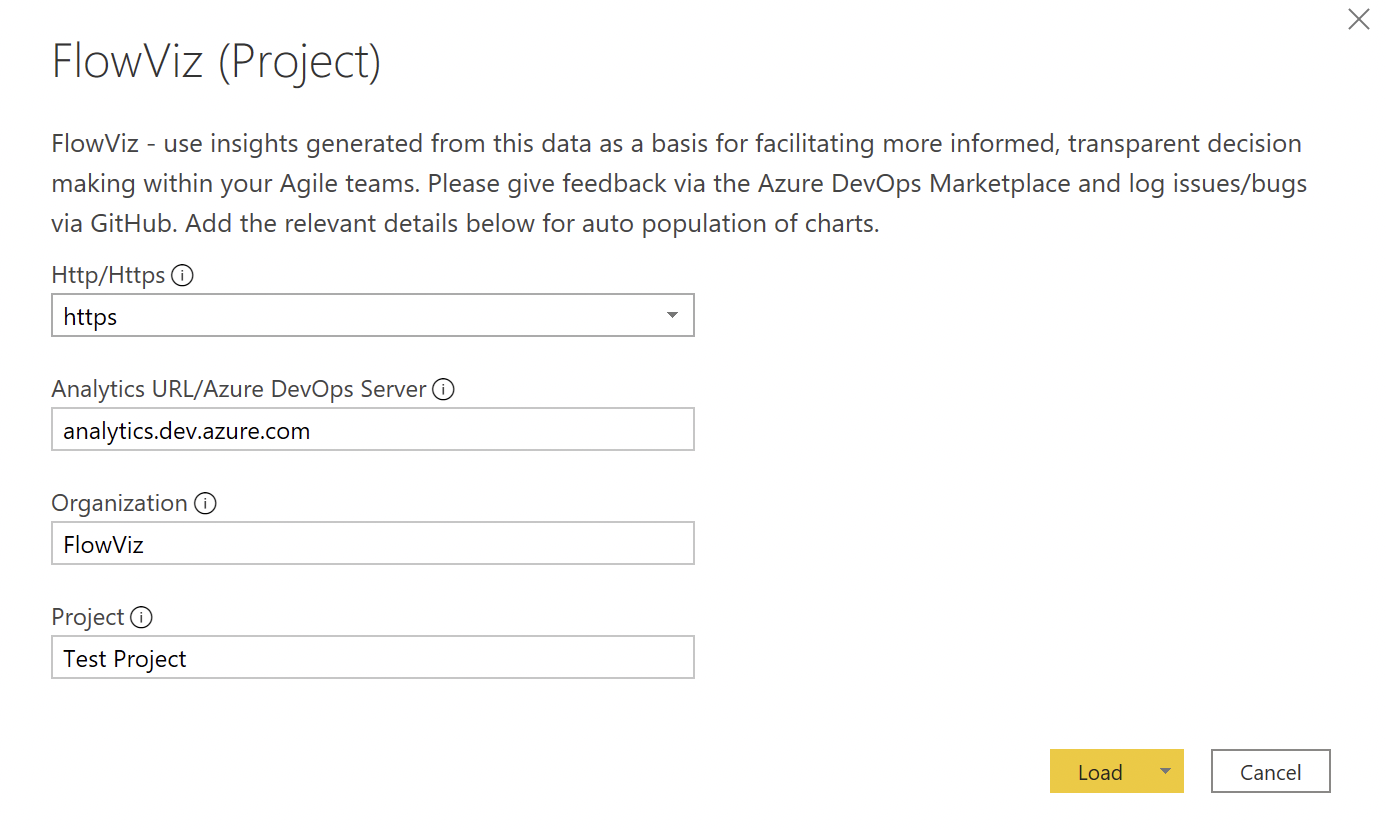
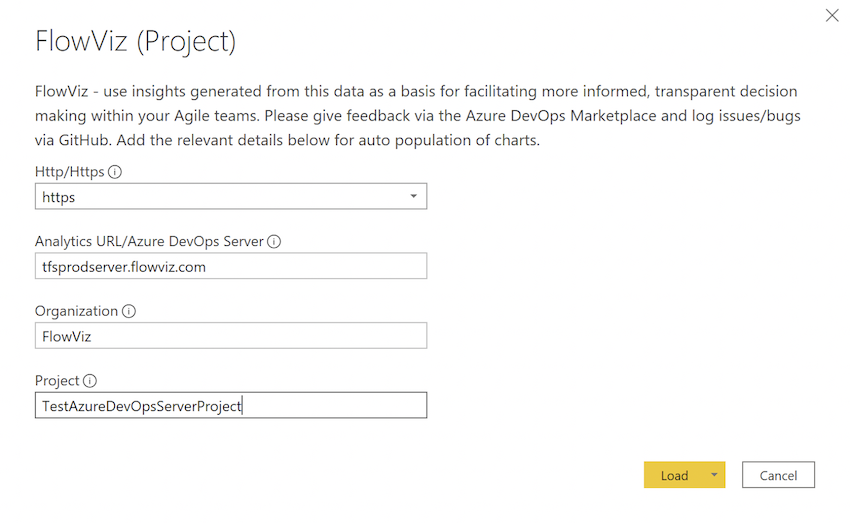
  • Select http/https (only choose http if your Azure DevOps Server is HTTP)
  • Add the Analytics / Azure DevOps Server URL - for Azure DevOps services enter 'analytics.dev.azure.com' / for Azure DevOps Server enter your server details
  • Add your organization and project name

Don't confuse the team name with the project name, a common mistake. If the URL you use is "http://dev.azure.com/Microsoft-UK/AzureDevOpsTeam/Database", then Microsoft-UK is the Organization Name, AzureDevOpsTeam is the Project name, Database is the team name.

  • It should then look something like this:

Azure DevOps Services: alt text

Azure DevOps Server: alt text

  • Hit 'Load'

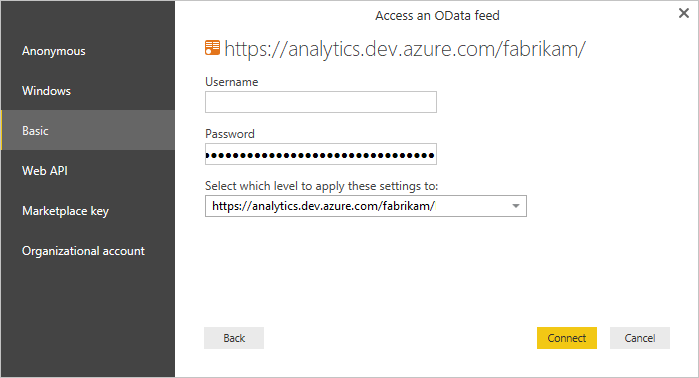
  • If you are prompted for a login, you can choose:

    • 'Organizational' and enter your Organization email/password (if required) and sign in
    • 'Basic' and use a Personal Access Token (PAT) to login, entering it in the password field (user can be left as blank - make sure it has 'Read' access to Analytics)

    alt text

  • Once signed in hit 'Load' and wait for your charts to populate!

What do these charts mean? How can I learn more?

There is a FlowViz Fundamentals course now available

For questions on charts, how to use them and other questions check out the Wiki.

If you want to embed these charts into Azure DevOps, check out this brilliant blog for guidance.

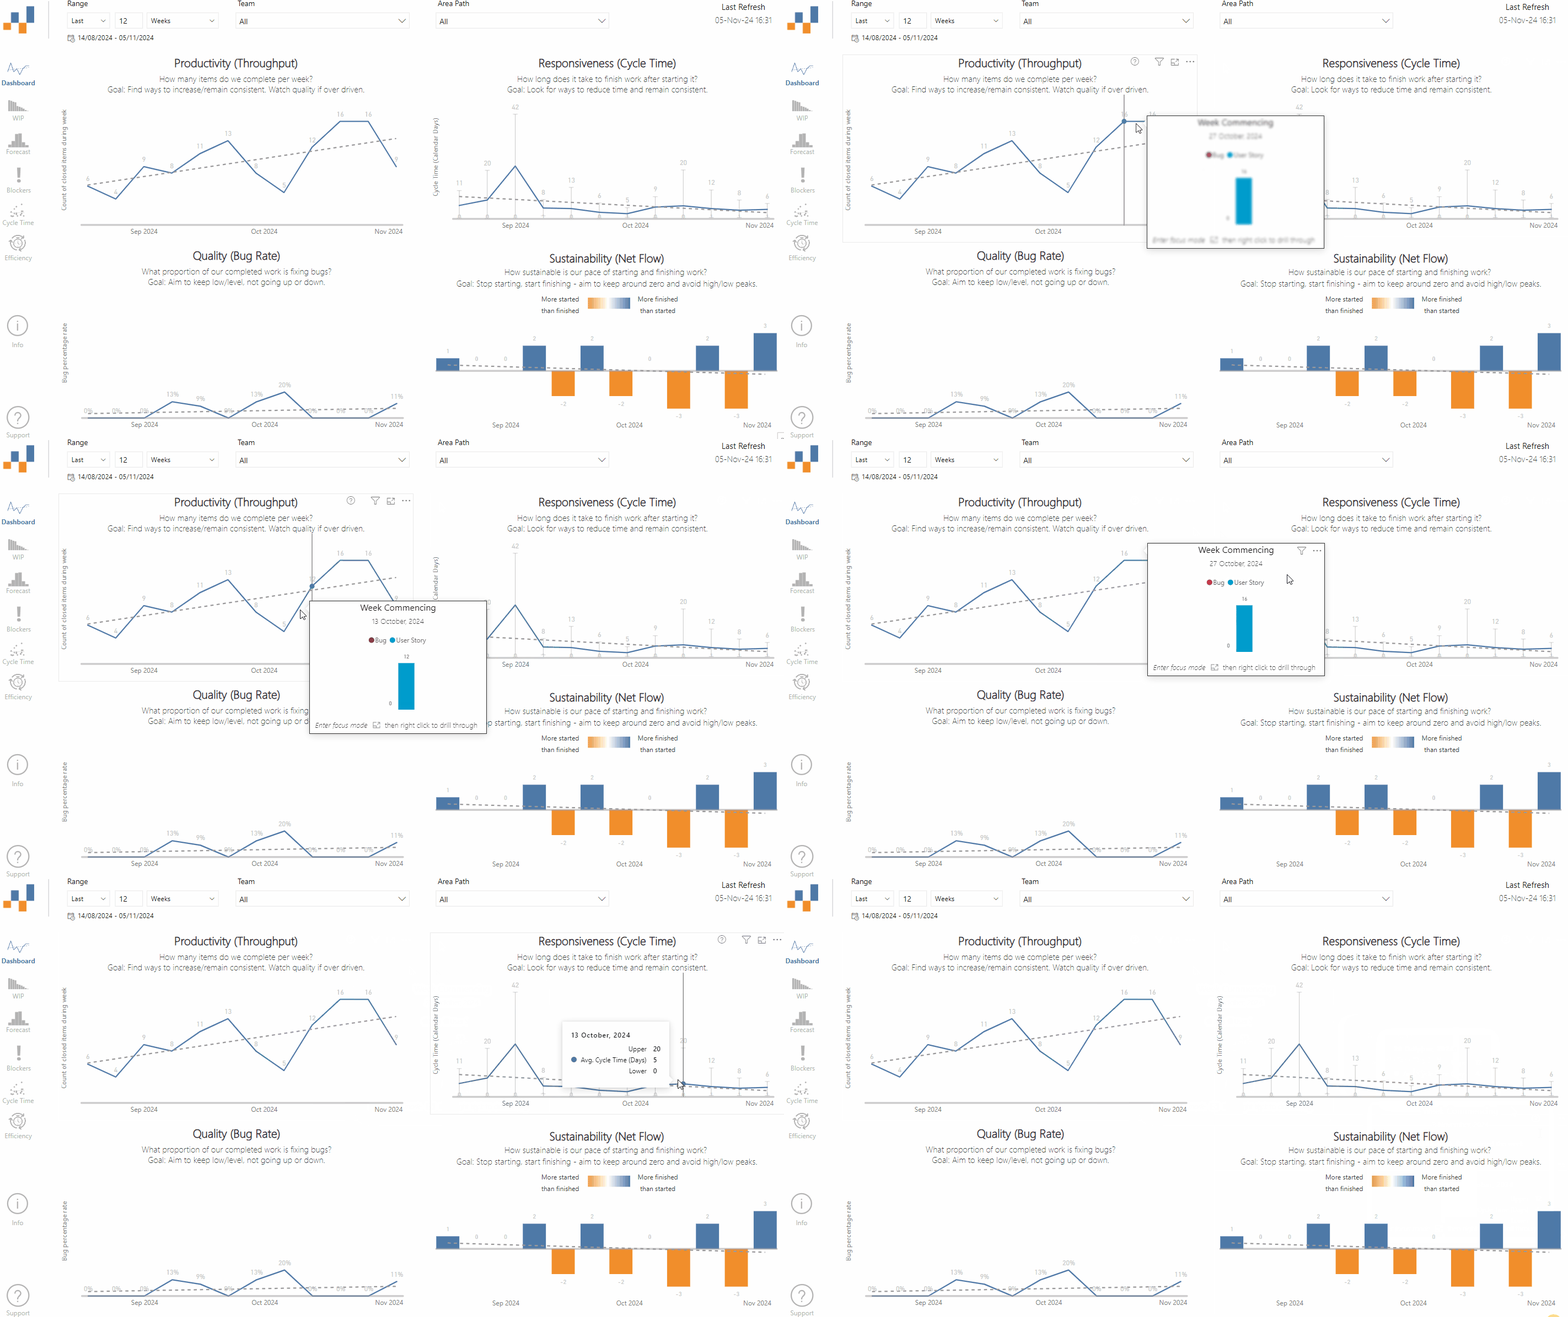
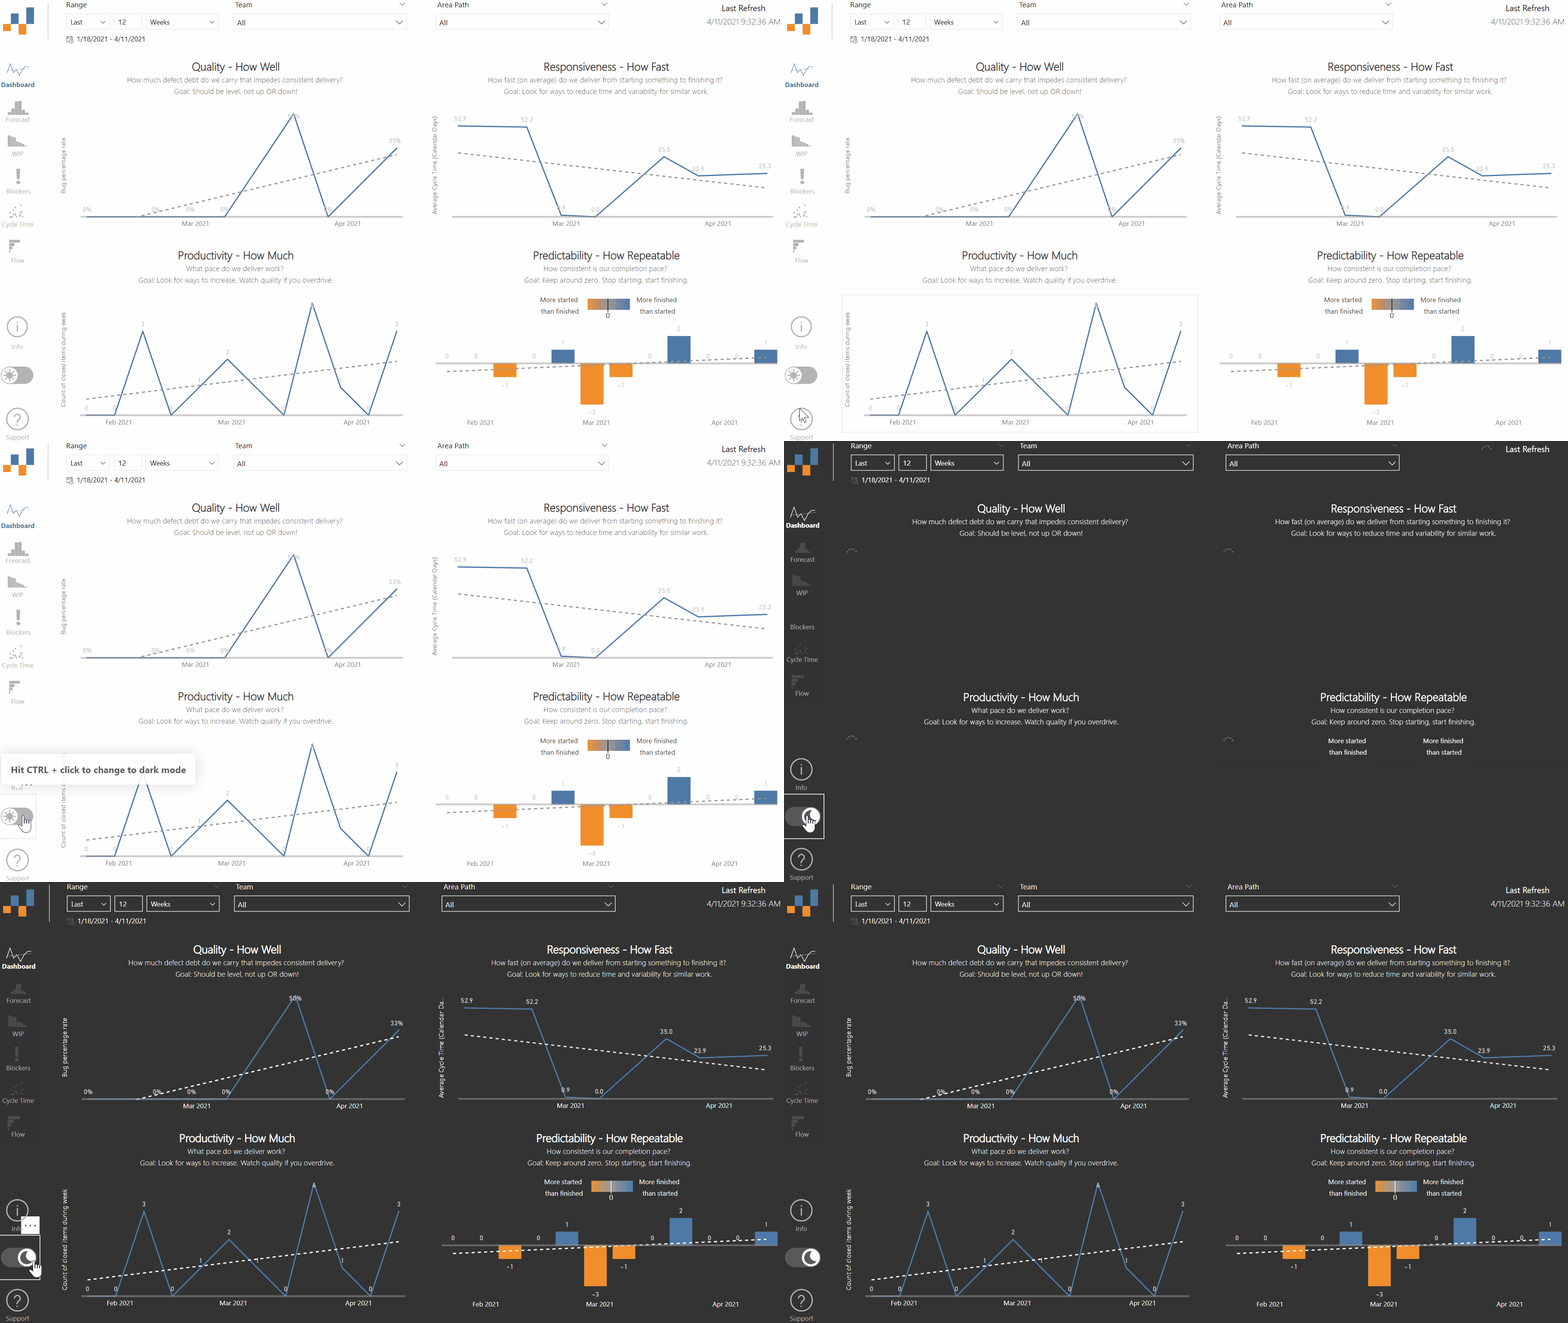
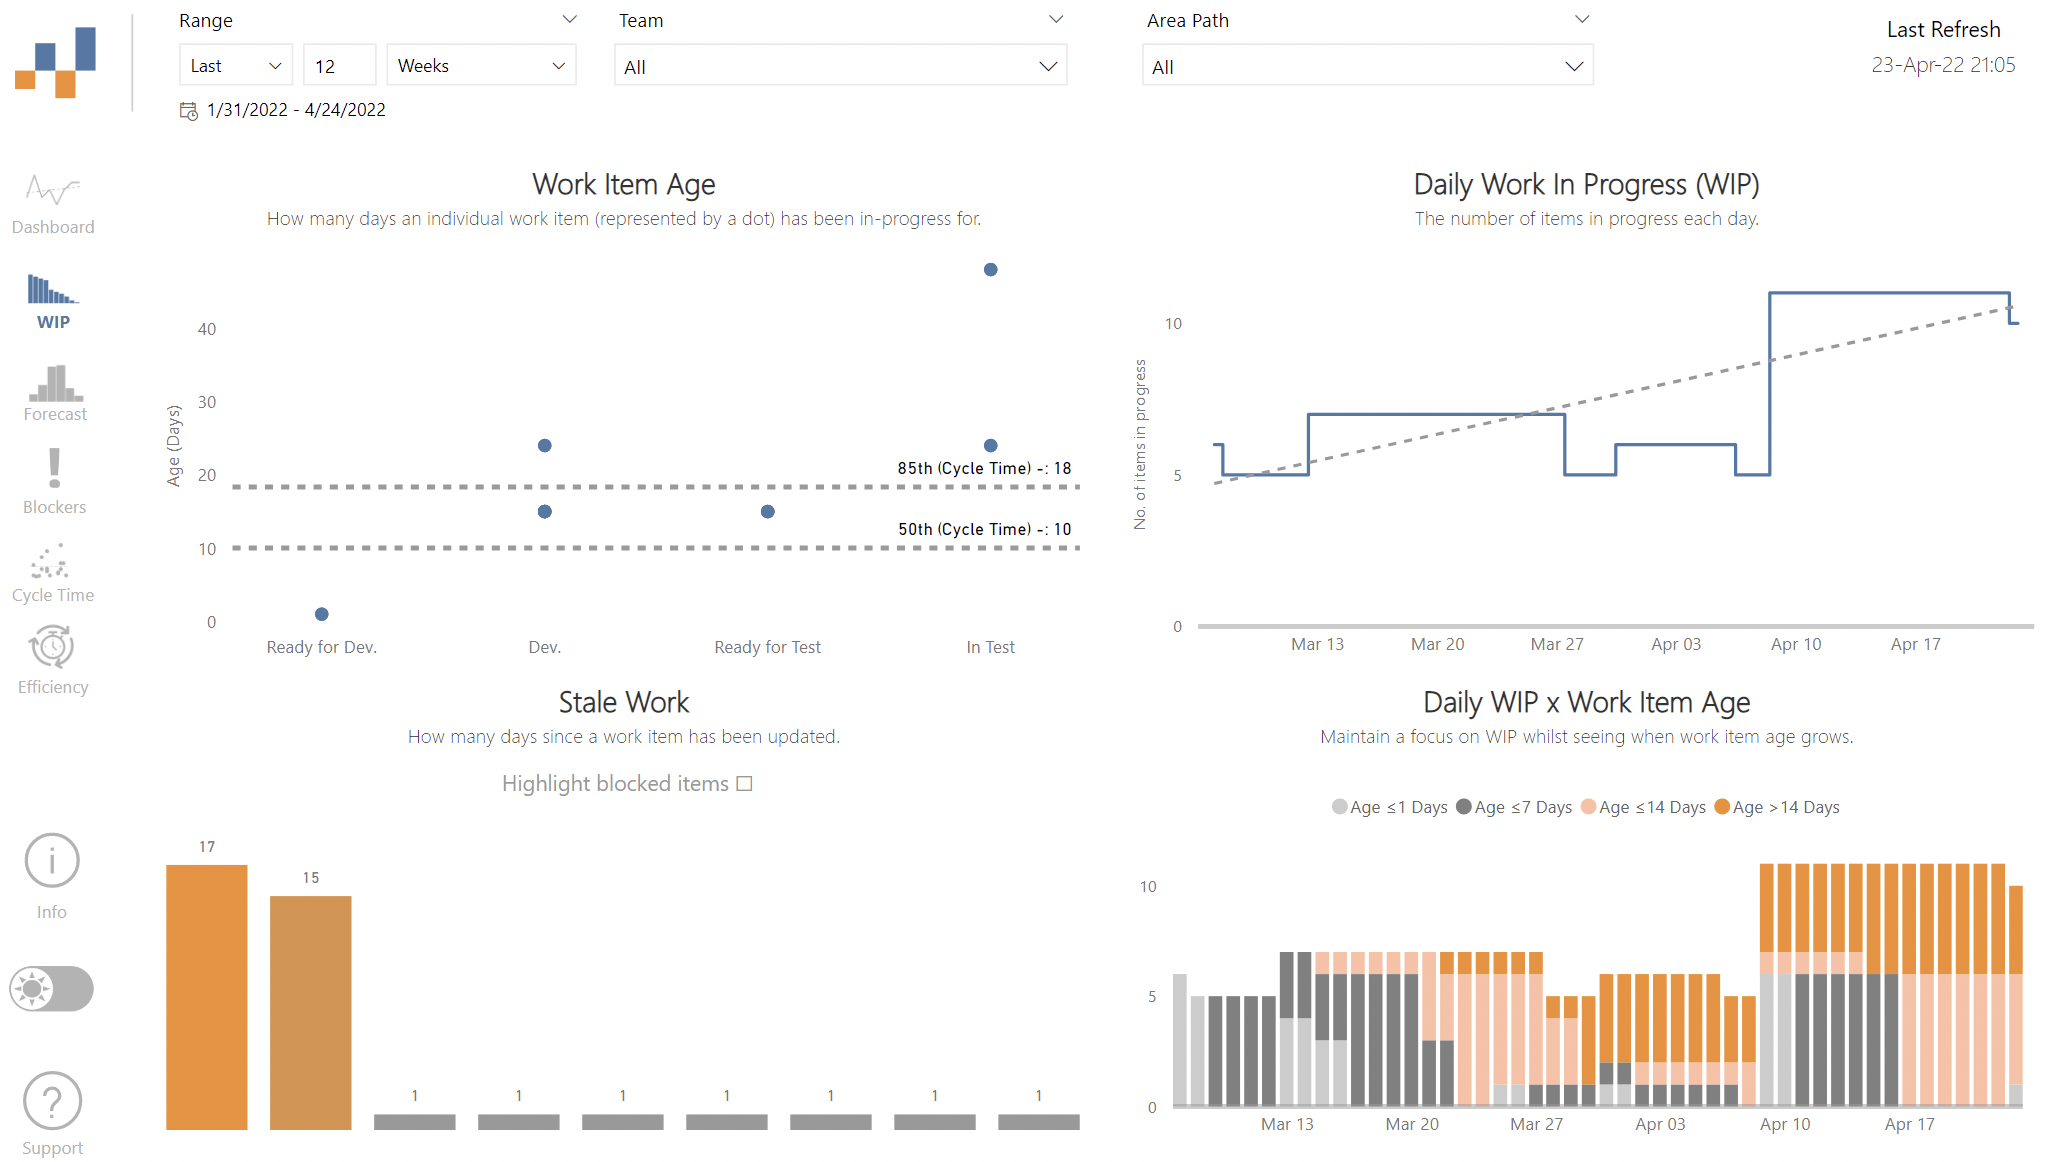
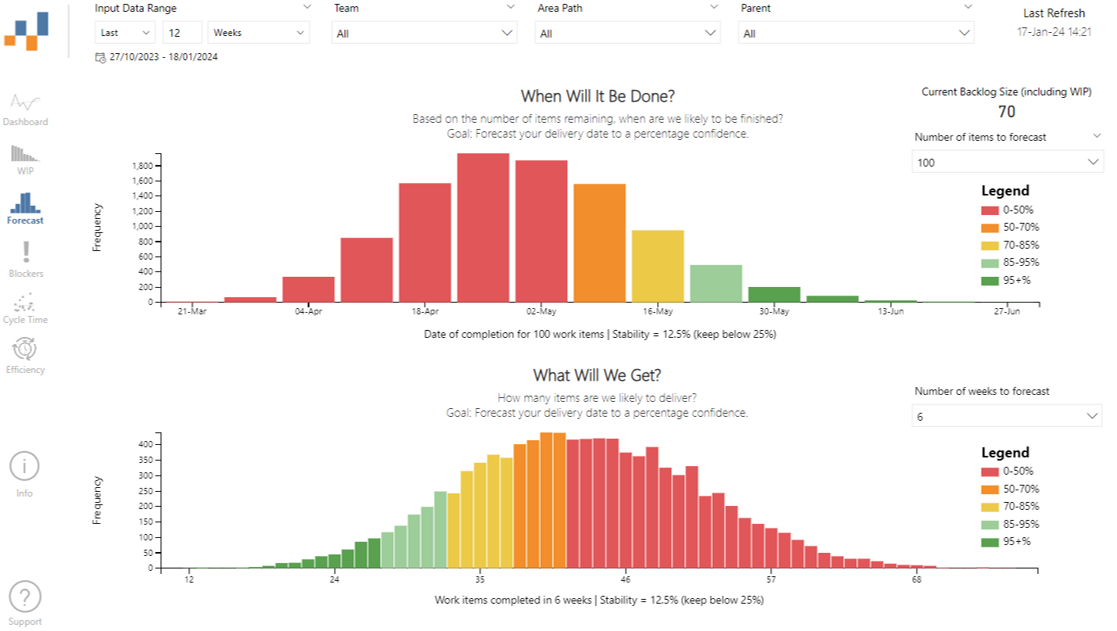
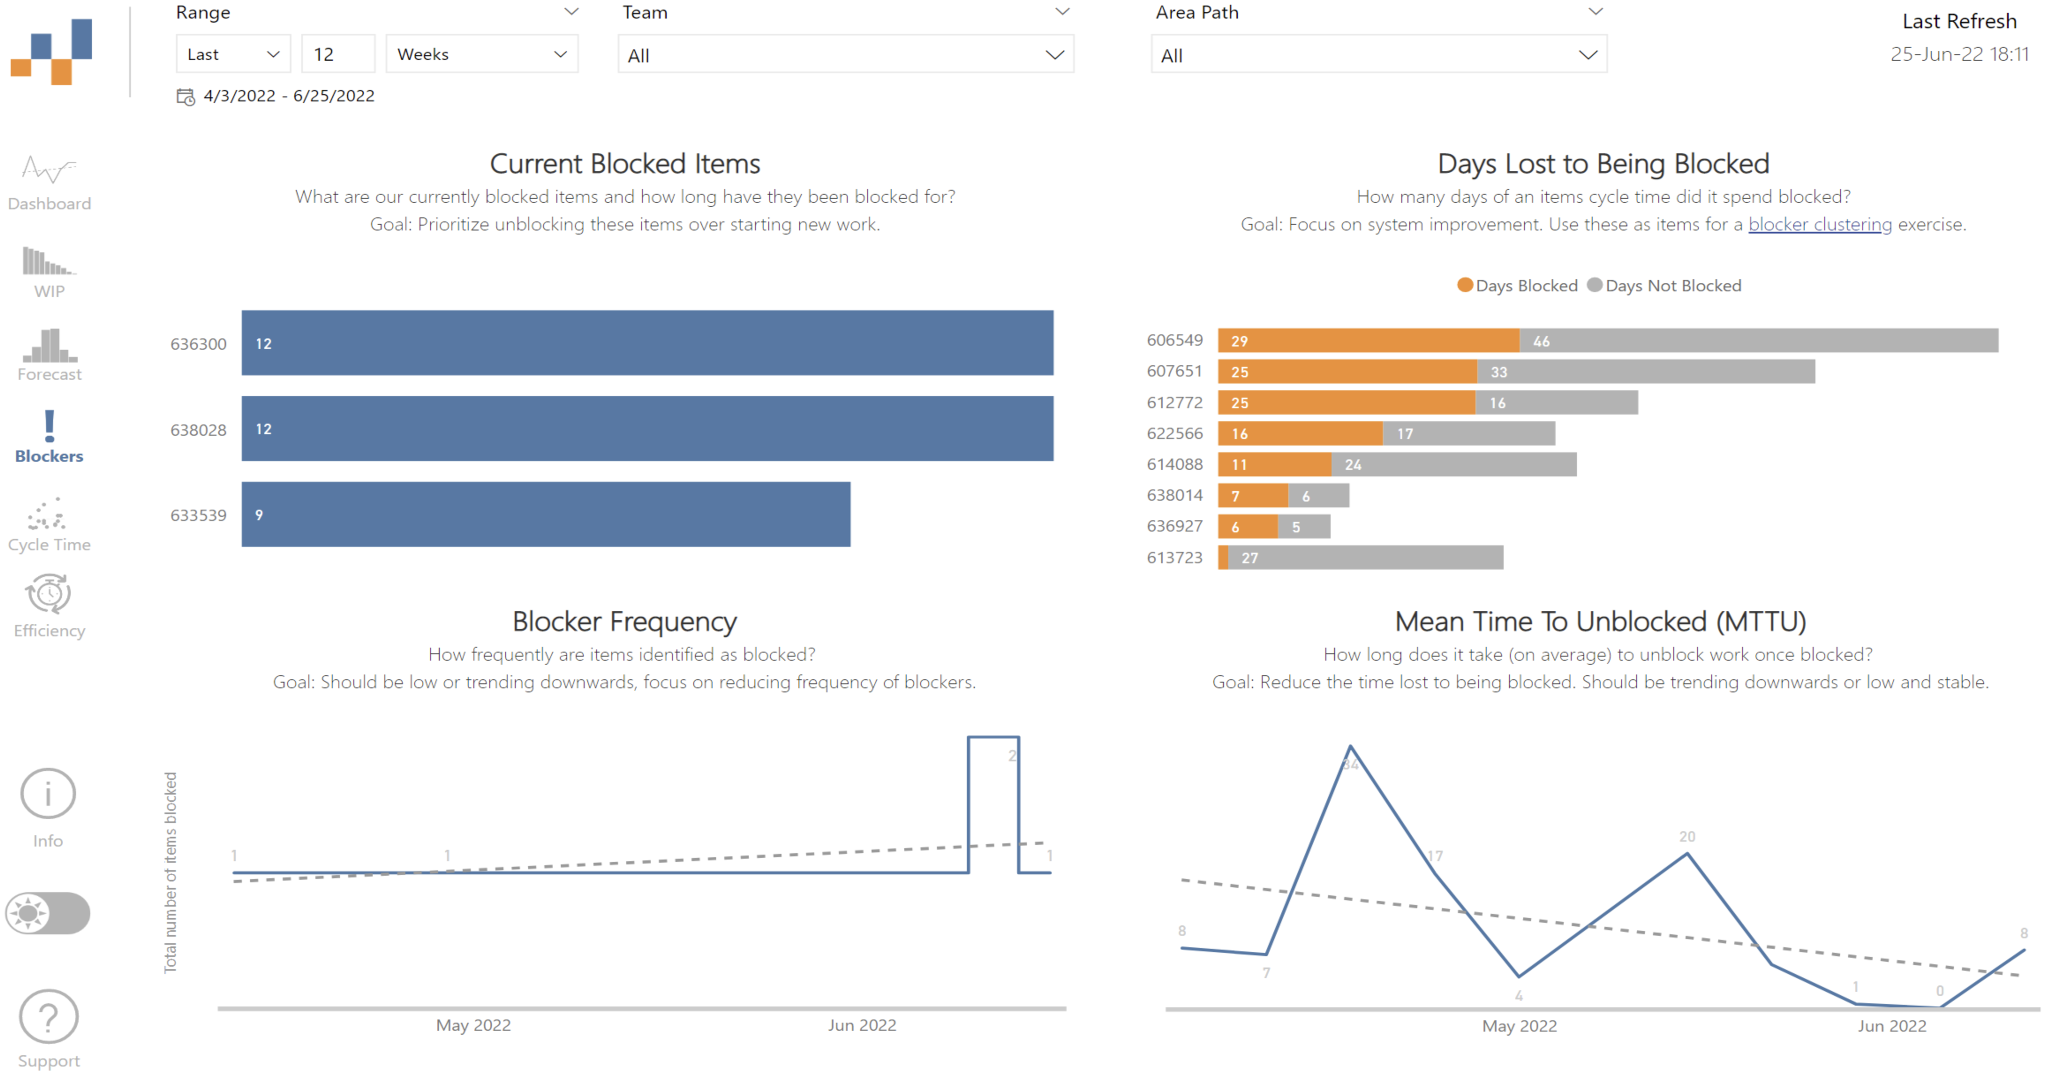
Screenshots

alt text

alt text

alt text

alt text

alt text

alt text

alt text

Feedback

FlowViz is built and maintained by Nicolas Brown and is published using Agile Extensions for assistance (big thank you to them!) Please email [email protected] for ideas, improvements and feedback.

You can also ask in the #flowviz channel in the Azure DevOps Club Slack community:

Image

Thank you

Thank you to all the people who helped inspire and/or build this, providing feedback and answering my questions especially:

flowviz's People

Contributors

nbrown02 avatar seriousm avatar

Stargazers

 avatar  avatar  avatar  avatar  avatar  avatar  avatar  avatar  avatar  avatar  avatar  avatar  avatar  avatar  avatar  avatar  avatar  avatar  avatar  avatar  avatar  avatar  avatar  avatar  avatar  avatar  avatar  avatar  avatar  avatar  avatar  avatar  avatar  avatar  avatar  avatar  avatar  avatar  avatar  avatar  avatar  avatar  avatar  avatar  avatar  avatar  avatar  avatar  avatar  avatar  avatar  avatar  avatar  avatar  avatar  avatar  avatar  avatar  avatar  avatar  avatar  avatar  avatar  avatar  avatar  avatar  avatar  avatar  avatar  avatar  avatar  avatar  avatar  avatar  avatar  avatar  avatar  avatar  avatar  avatar  avatar  avatar  avatar  avatar  avatar  avatar  avatar  avatar  avatar  avatar  avatar  avatar  avatar  avatar  avatar  avatar  avatar  avatar  avatar  avatar

Watchers

 avatar  avatar  avatar  avatar  avatar  avatar  avatar  avatar  avatar  avatar  avatar  avatar  avatar  avatar  avatar  avatar  avatar  avatar  avatar  avatar  avatar  avatar  avatar  avatar  avatar

flowviz's Issues

Azure DevOps Server - TagNames not found

Hi - couple of follow ups:
Yep, 3.0 on it's own does not work. It returns:
{"$id":"1","innerException":null,"message":"VS403500: The v3.0 OData endpoint for Analytics is not supported. VS403503: Information on the latest recommended version is available here: https://go.microsoft.com/fwlink/?linkid=856818.","typeName":"Microsoft.VisualStudio.Services.Analytics.UnsupportedODataModelVersionException, Microsoft.VisualStudio.Services.Analytics.Server","typeKey":"UnsupportedODataModelVersionException","errorCode":0,"eventId":3000}

v3.0-preview does return a dataset.

The workitems query has a problem after I've update the url.

DataSource.Error: Microsoft.Mashup.Engine1.Library.Resources.HttpResource: Request failed: 
OData Version: 3 and 4, Error: The remote server returned an error: (400) Bad Request. (VS403483: The query specified in the URI is not valid: VS403494: No datetime offset was specified.  Please use either of these formats YYYY-MM-ddZ to specify everything since midnight or yyyy-MM-ddThh:mm-hh:mm(ISO 8601 standard representation of dates and times) to specify the offset..)
OData Version: 4, Error: The remote server returned an error: (400) Bad Request. (VS403483: The query specified in the URI is not valid: VS403494: No datetime offset was specified.  Please use either of these formats YYYY-MM-ddZ to specify everything since midnight or yyyy-MM-ddThh:mm-hh:mm(ISO 8601 standard representation of dates and times) to specify the offset..)
Details:
    DataSourceKind=OData
    DataSourcePath=http://{server}/tfs/Integration/{Project}/_odata/v3.0-preview/WorkItemSnapshot

If I just use the URL before the query parameters, it will return a dataset.

Last question - where would you like to continue this conversation? Please move to whatever location you feel is appropriate.
Cheers

Originally posted by @geoandrew in https://github.com/nbrown02/FlowViz/discussions/25#discussioncomment-418729

NOTE: not being reported by all Azure DevOps Server users

How to allow FlowViz in my organization

The visuals built using D3JSVisual don't work if we publish the pbix on our power BI service because these are not certified.
The way to allow uncertified visuals on an organization is by setting AppSource visuals or .pbiviz files as organization visuals, but on this case it is not possible to do so, because we don't have the .pbivis.

Can you help me?

Cannot Access DevOps from PowerBI file

Hi there,

Hope you are doing well.

I was just wondering if you can help with the following issue I'm having. I'm new to both Power BI and DevOps and I'm trying to get FlowViz up and running which looks amazing and will help us tremendously.

I'm opening the files that I downloaded (https://marketplace.visualstudio.com/items?itemName=agile-extensions.flowviz&ssr=false#overview) and it asks for my login details. When trying to log in with my Organisational Account, I get the following:

The WWW-Authenticate header doesn't contain a valid authorization URI. Header value: 'Basic realm="https://xxxxxxxxxxx.app.analytics.visualstudio.com/",Bearer,TFS-Federated'.

However when I copy and paste the URL (https://analytics.dev.azure.com/company/project/_odata/v3.0/WorkItems (or Area or Date etc) in a browser, I get results.

I have also tried logging in with a Personal Access Token which does not work, BUT it does work when I create an odata query from Power BI.

I have installed the latest and greatest version of Power BI.

Is there something that needs to be set at the Azure DevOps level?

Your help will be much appreciated or if you could point me in the right direction that would be great.

On premise platform with custom team field

I've tried FlowVis a few times with no results closely following instructions. I'm not sure but I think this may be the issue.

I have a on premises server instance 2019.1 with a custom team field replacing the use of the area path as the team organizer. I know this is a common adaptation and supported in the ADO process config but does FlowVis allow for that and how do I configure for it? Is it possible for me to edit the report to allow for that?

Forecast tab crash when you try to turn of focus mode.

Describe the bug
Forecast tab crash when you try to turn of focus mode.

To Reproduce
Steps to reproduce the behavior:

  1. Go to forecast tab on the Flowviz 'project'
  2. Click on on Forecast tab
  3. click on focus
  4. causes powerbi to crash. I have also tried duplicate the tab to look at predicting effort points however when I tried to delete a field it causes powerbi to crash as well.

Expected behavior
Should open in focus mode

Desktop (please complete the following information):
desktop version. this chart also doesnt work in the web view either. all other charts work

Any help you could give on this would be greatly appreciated. over all thou great template thank you.

.pbit file is incompatible with latest version of Power BI

Feedback Type:
Frown (Error)

Timestamp:
2020-01-14T16:15:15.7587810Z

Local Time:
2020-01-14T16:15:15.7587810+00:00

Session ID:
80249391-1f91-4747-98d5-1eef0ad02f55

Release:
January 2019

Product Version:
2.65.5313.1562 (18.12) (x86)

Error Message:
'\***\users*\Downloads\FlowViz - Agile Process Template.pbit' is incompatible with your current version of Microsoft Power BI Desktop. Please install the latest version and try opening the document again.

Stack Trace:
at Microsoft.PowerBI.Client.Windows.Services.ReportFactory.ValidateVersion(String part, Version version, Version supportedVersion, Action1 logTelemetry, ReportVersionCompatibilityFlags& versionCompatibility) at Microsoft.PowerBI.Client.Windows.Services.ReportFactory.DeserializeReportDocument(IStreamablePowerBIPackagePartContent streamablePowerBIPackagePartContent, IPowerBITelemetryService powerBITelemetryService, ReportVersionCompatibilityFlags& versionCompatibility) at Microsoft.PowerBI.Client.Windows.Services.ReportFactory.CreateReportFromPowerBIPackage(IPowerBIPackage powerBIPackage, String pbixFilePath, Byte[] securityBindings, Boolean requiresConversionToReportLayout, PowerBIPackageOpenOptions options, IPowerBITelemetryService powerBITelemetryService, IAnalysisServicesService analysisServices, PackageValidationResult& mashupValidationResult) at Microsoft.PowerBI.Client.Windows.Services.PowerBIPackagingService.Open(FileStream fileStream, IPowerBIWindowService windowService, Nullable1 entryPoint, PowerBIPackageOpenOptions options, Boolean& allCredentialsSatisfied)
at Microsoft.PowerBI.Client.Windows.Services.TemplateManager.TryImportTemplate(IPowerBIWindowService windowService, IQueryServices queryServices, IExceptionHandler exceptionHandler, TelemetryUserActionId entryPoint, Boolean& editQueries, String filePath)

Stack Trace Message:
5.2.0 is newer than the supported version (3.21.0) for report document package part

Invocation Stack Trace:
at Microsoft.Mashup.Host.Document.ExceptionExtensions.GetCurrentInvocationStackTrace()
at Microsoft.Mashup.Client.UI.Shared.StackTraceInfo..ctor(String exceptionStackTrace, String invocationStackTrace, String exceptionMessage)
at Microsoft.Mashup.Client.UI.Shared.FeedbackErrorInfo..ctor(String message, Exception exception, Nullable1 stackTraceInfo, String messageDetail) at Microsoft.PowerBI.Client.Windows.Services.TemplateManager.TryImportTemplate(IPowerBIWindowService windowService, IQueryServices queryServices, IExceptionHandler exceptionHandler, TelemetryUserActionId entryPoint, Boolean& editQueries, String filePath) at Microsoft.PowerBI.Client.Windows.Commands.ApplicationCommands.DataImportCommands.ImportTemplate(IPowerBIWindowService windowService, IExceptionHandler exceptionHandler, ImportTemplateParameters parameters) at Microsoft.PowerBI.Client.Windows.Commands.CommandFactory.<>c__DisplayClass421.<>c__DisplayClass44.b__40()
at Microsoft.Mashup.Host.Document.ExceptionHandlerExtensions.HandleExceptions(IExceptionHandler exceptionHandler, Action action)
at Microsoft.PowerBI.Client.Windows.Commands.CommandFactory.ExecuteWithExceptionHandler(Action executeMethod, IExceptionHandler exceptionHandler, String telemetryCommandName)
at Microsoft.PowerBI.Client.Windows.Commands.CommandFactory.<>c__DisplayClass421.<FromSyncHandlers>b__3f(UICommandParameter1 p)
at Microsoft.Practices.Prism.Commands.DelegateCommand1.<>c__DisplayClass10.<.ctor>b__c(Object o) at Microsoft.Practices.Prism.Commands.DelegateCommandBase.<>c__DisplayClass2.<.ctor>b__0(Object arg) at Microsoft.Practices.Prism.Commands.DelegateCommandBase.<Execute>d__7.MoveNext() at System.Runtime.CompilerServices.AsyncTaskMethodBuilder.Start[TStateMachine](TStateMachine& stateMachine) at Microsoft.Practices.Prism.Commands.DelegateCommandBase.Execute(Object parameter) at Microsoft.Practices.Prism.Commands.DelegateCommand1.d__12.MoveNext()
at System.Runtime.CompilerServices.AsyncTaskMethodBuilder.Start[TStateMachine](TStateMachine& stateMachine)
at Microsoft.Practices.Prism.Commands.DelegateCommand1.Execute(T parameter) at Microsoft.PowerBI.Client.Windows.Commands.CompositeCommand1.Execute(ICommand command, Object parameter)
at Microsoft.Practices.Prism.Commands.CompositeCommand.Execute(Object parameter)
at Microsoft.PowerBI.Client.Windows.Commands.CompositeCommand1.Execute(T parameter) at Microsoft.PowerBI.Client.Windows.MainWindow.ImportTemplate(TelemetryUserActionId entryPoint, String filePath) at Microsoft.PowerBI.Client.Windows.MainWindow.OpenDocument(TelemetryUserActionId entryPoint, String testFilePath) at Microsoft.PowerBI.Client.Windows.MainWindow.OpenDocument(TelemetryUserActionId entryPoint) at Microsoft.PowerBI.Client.Windows.Ribbon.ApplicationRibbonCommandActionHandler.HandleCommand(UInt32 commandId) at Microsoft.Mashup.Client.UI.Shared.UICommands.CommandActionHandlerBase.CommandAction(UInt32 commandId) at Microsoft.Mashup.Client.UI.Windows.Ribbon.RibbonCommandHandler.Execute(UInt32 commandId, CommandExecutionVerb verb, PropertyKeyRef keyRef, PropVariantRef currentValue, IUISimplePropertySet commandExecutionProperties) at System.Windows.Forms.UnsafeNativeMethods.DispatchMessageW(MSG& msg) at System.Windows.Forms.Application.ComponentManager.System.Windows.Forms.UnsafeNativeMethods.IMsoComponentManager.FPushMessageLoop(IntPtr dwComponentID, Int32 reason, Int32 pvLoopData) at System.Windows.Forms.Application.ThreadContext.RunMessageLoopInner(Int32 reason, ApplicationContext context) at System.Windows.Forms.Application.ThreadContext.RunMessageLoop(Int32 reason, ApplicationContext context) at System.Windows.Forms.Application.RunDialog(Form form) at System.Windows.Forms.Form.ShowDialog(IWin32Window owner) at Microsoft.Mashup.Client.UI.Windows.DialogWindowBase.ShowModal(IWindowHandle windowHandle) at Microsoft.Mashup.Client.UI.Shared.WebDialogs.WebDialog.<>n__FabricatedMethod8(IWindowHandle ) at Microsoft.Mashup.Client.UI.Shared.WebDialogs.WebDialog.<>c__DisplayClass6.<ShowModal>b__5() at Microsoft.Mashup.Client.UI.Shared.WindowManager.ShowModal[T](T dialog, Func1 showModalFunction)
at Microsoft.Mashup.Client.UI.Shared.WebDialogs.WebDialog.ShowModal(IWindowHandle owner)
at Microsoft.PowerBI.Client.Program.<>c__DisplayClass10.

b__0()
at Microsoft.PowerBI.Client.Windows.IExceptionHandlerExtensions.<>c__DisplayClass7.b__6()
at Microsoft.Mashup.Host.Document.ExceptionHandlerExtensions.HandleExceptions(IExceptionHandler exceptionHandler, Action action)
at Microsoft.PowerBI.Client.Windows.IExceptionHandlerExtensions.HandleExceptionsWithNestedTasks(IExceptionHandler exceptionHandler, Action action)
at Microsoft.PowerBI.Client.Program.Main(String[] args)

OS Version:
Microsoft Windows NT 10.0.17763.0 (x64 en-US)

CLR Version:
4.7 or later [Release Number = 461814]

Peak Virtual Memory:
1.36 GB

Private Memory:
360 MB

Peak Working Set:
454 MB

IE Version:
11.805.17763.0

User ID:
ed55a78c-9c0c-40ac-a226-eb38015dc99b

Workbook Package Info:
1* - en-GB, Query Groups: 0, fastCombine: Disabled, runBackgroundAnalysis: True.

Telemetry Enabled:
True

Model Default Mode:
Empty

Disabled Preview Features:
PBI_shapeMapVisualEnabled
MIntellisense
PBI_SpanishLinguisticsEnabled
PBI_PdfImport
PBI_ColumnProfiling
PBI_variationUIChange
PBI_PythonSupportEnabled
PBI_showIncrementalRefreshPolicy
PBI_showManageAggregations
PBI_FuzzyMatching
PBI_EnableWebDiagramView
PBI_improvedFilterExperience
PBI_qnaLiveConnect

Disabled DirectQuery Options:
TreatHanaAsRelationalSource

Cloud:
GlobalCloud

DPI Scale:
150%

Supported Services:
Power BI Report Server, Power BI

Formulas:

section Section1;

Error- Data not loading into PowerBI

Hello,

I am trying to connect FlowViz PowerBI (Project) report, I am able to successfully make the connection.

On the other hand, while the data is loading it gives an error with the details mentioned in the images below:

I have cleared all caches to avail the memory space in powerbi.

Can you please let us know what the possible solution to the given problem might be.

Appreciate your help and response.

Thank you

image

image

image

Not compatible with newest PowerBI Desktop (2.84.701.0)

Version: 2.84.701.0 64-bit (August 2020) gives an error loading the FlowViz - Agile Template.

To Reproduce
Open template FlowViz - Agile Template.pbit
add
https://analytics.dev.azure.com/DocuShareHP/Desktop/_odata/v3.0-preview

click [load], get the below failures
Areas
Loading blocked by failures with other queries.
WorkItems Completed
The column 'ResolvedReason' of the table wasn't found.
Dates
Loading blocked by failures with other queries.
WorkItems In Progress WIP
The column 'ResolvedReason' of the table wasn't found.
Number of remaining items
Loading blocked by failures with other queries.
WorkItems (Count of InProgress)
The column 'ResolvedReason' of the table wasn't found.
Number of weeks to forecast
Loading blocked by failures with other queries.
Data Refresh
Loading blocked by failures with other queries.

click [ok]

Error: report has not been upgraded...

PowerBI is then locked, with no way to shut it down except in Task Manager

Expected behavior
Update data model to match

Screenshots
screen shot here:
image

Unable to Connect FlowViz to my organization or Project

Hi Team - I am a newbie to Azure Devops world and I was trying to integrate FlowViz with my current organization/Project, however even after multiple attempts I am receiving the attached error. Also, It did not let me sign in using my Devops email. Request someone to please look at this and help me set this up.

Thank you in advance!
FlowViz Error

Feature Request - Provide a forecast in days and dates

At the moment the forecast will always output weeks.
in addition it would be nice to also have days and dates so I don't have to calculate dates from from weeks.
And especially for small projects days would be nice.

What version of Power Bi?

I have installed Power Bi (the version released in May 2019) on my computer. Your Power Bi template cannot be opened due to version compatibility.

Installed Power Bi Product Version:
2.69.5467.1801 (19.05) (x64)

Error Message:
'..\FlowViz - Agile Template.pbit' is incompatible with your current version of Microsoft Power BI Desktop. Please install the latest version and try opening the document again.

Feature Request - Inputs for forecast: should be able to base it on a query / epic / feature

At the moment the input is based on a date range, project, team and area.
Also the "Number of items to forecast" is based on a number.

It would be helpful if one / both of these could be based on a query, an epic or a feature.

Let's say, I have a side-project under Feature X which I know will be handled by developers A, B and C.
Then I would create a query which would just return work items, done by A, B and C and use a feature to provide the number of items.

In addition matching of items by Tag would also be nice:
If i have tagged my items with something like "UI", "API", "Database" and the new feature needs 1 item "UI", "API", 2 items "Database" and 1 item "Bug", the simulation could be based on these tags, so the simulation for the "UI" and "API" item would run on the past items with the same tags. As there is no "Bug" tag in the historic data, the simulation for this item would run on all past items.

Forecast page freezes in Power BI Desktop

Most of the FlowViz report pages seem to work correctly: Dashboard, WIP, Flow, Cycle Time and all working correctly.
However when I click the Forecast page of the report in Power BI, the report page graphs remain blank, the slicers don't respond to clicks and also the tabs for switching to other report pages don't respond anymore. The whole report area freezes

image

Blocked items in scrum template do not show on Blockers tab

Describe the bug
The default scrum template includes a field "Blocked", which is "Yes" or "No". Items flagged with this do not show in the count of blocked work.

To Reproduce
Steps to reproduce the behavior:

  1. In a project in the standard scrum template
  2. Mark an item as blocked
  3. Run FlowViz
  4. Go to Blockers tab
  5. Work item does not appear

Expected behavior
Work items marked as blocked using the standard field are counted in statistics. Not just ones marked with a Block tag.

Forecast Issue

Describe the bug
I'm trying to update the Forecast data to use a custom Completed date. However, when adding the custom Completed date the visual will go blank. I then try to Edit the visual and I get an error message.

To Reproduce
Steps to reproduce the behavior:

  1. Go to the Forecast tab
  2. Click on first visual (D3JSVisual)
  3. Change the count of Completed Date to count of another date
  4. Visual blanks out
  5. Click the ellipses
  6. Click Edit
  7. See error in screenshot and log details under Additional Context

Expected behavior
I should be able to change the Date for the visual and be able to Edit the visual.

Screenshots
When trying to edit the first D3JSVisual:
image

Desktop (please complete the following information):

  • OS: Windows 11
  • Version: 2.110.1161.0 64-bit (October 2022)

Additional context
Log information: FrownSnapShot210252b4-c068-42b1-8d4e-1b6f59052139.zip

OData Request Failed

I am getting this error when trying to load the data.

image

I have tried going through the closed issues to see if there were any solutions already presented, but I have yet to see anything related to my issue. I think it may have to do with the way I logged in but I'm not sure how to re-do that process. I tried to re-download and start the process over, but that did not help. If you could provide some assistance, that would be much appreciated! Thank you!

Steps for downloading pbit file

Hi,
I'm new to both Azure DevOps (Cloud) and PowerBI Desktop. I'm trying to follow the steps on this site for Prerequisites setup. However, I'm a bit lost on the step 3 part which mention

"Download the .pbit files based on your Azure DevOps template (Scrum or Agile - inherited processes also work fine)"

Can you elaborate the step that needs to be down here? Thanks

404 Error Trying to Load Data

Hi,

I have double checked everything, including the documentation, but continue to get an error when trying to Load data from Azure DevOps. Any suggestions on something I may have overlooked?

image

Thanks.

David

Error on refreshing data in workspace

Firstly, FlowViz is an incredible offering. I'm impressed at the capability provided and the support offered in this template. I've lost track of the hours expended attempting to mine ADO data in PBI and then I see this does such an incredible job off the shelf. Wow!

I have no problems through the PBI Desktop and will spend many a happy hour analysing project data over the next few days.

However, if I publish to PBI Cloud I initially get no problem. But if I try to refresh data, either manually or scheduled, I get a duplicate value reported:

Data source error: Column 'Date' in Table 'Dates' contains a duplicate value '3/27/2022' and this is not allowed for columns on the one side of a many-to-one relationship or for columns that are used as the primary key of a table.
Cluster URI: WABI-EUROPE-NORTH-B-redirect.analysis.windows.net
Activity ID: 7d69b1b1-39ad-43dc-b574-f8da030f314e
Request ID: d3dd2660-cb1a-939e-866c-e4f5da568551
Time: 2022-10-20 16:28:37Z

I've looked in the Dates table and there is no such duplicate record seen. Looking at the data query in the template I see nothing to address duplicates so am at a loss to understand why these appear in refreshing the data.

I've checked data source credentials for the published dataset. I can reproduce the error each time. It occurs on the first refresh of data published to the cloud.

I'm using the last published version of FlowViz from a couple of days ago, 1.1.6841, PBI 2.109.1021.0 64-bit (September 2022)

The above was on the free tier but I've just started a Pro trial and observe the same behaviour.

400 Bad request- blocked is not available

I've downloaded the latest version and when authenticating i am getting the below issue. Is this soemthing youve ever come across before?

Microsoft.Mashup.Engine1.Library.Resources.HttpResource: Request failed:
OData Version: 3 and 4, Error: The remote server returned an error: (400) Bad Request. (VS403483: The query specified in the URI is not valid: VS403522: The property 'Blocked' is not available on the specified Project(s). Please remove 'Blocked' from your query and try again..)
OData Version: 4, Error: The remote server returned an error: (400) Bad Request. (VS403483: The query specified in the URI is not valid: VS403522: The property 'Blocked' is not available on the specified Project(s). Please remove 'Blocked' from your query and try again..)

WorkItems Daily Blocked Count missing data

WorkItems Daily Blocked Count is being restricted to 10K rows in the Org Template version. I fixed it using the following query:

let
Source = OData.Feed(#"Http/Https" & "://" & #"Analytics URL/Azure DevOps Server" & "/" & Organization & "/_odata/v3.0-preview/WorkItemSnapshot?%20$apply=filter(%20StateCategory%20eq%20%27InProgress%27%20and%20WorkItemType%20ne%20%27Issue%27%20and%20WorkItemType%20ne%20%27Task%27%20and%20WorkItemType%20ne%20%27Test%20Case%27%20and%20WorkItemType%20ne%20%27Test%20Plan%27%20and%20WorkItemType%20ne%20%27Shared%20Parameter%27%20and%20WorkItemType%20ne%20%27Shared%20Steps%27%20and%20WorkItemType%20ne%20%27Test%20Suite%27%20and%20WorkItemType%20ne%20%27Impediment%27%20and%20WorkItemType%20ne%20%27Epic%27%20and%20WorkItemType%20ne%20%27Feature%27%20and%20DateValue%20ge%202021-08-01Z%20)
/groupby(%20(Blocked,DateValue,DateSK,AreaSK,IterationSK,TagNames),%20aggregate($count%20as%20Count)%20)", null, [Implementation="2.0"]),
#"Filtered Rows" = Table.SelectRows(Source, each true),
#"Changed Type" = Table.TransformColumnTypes(#"Filtered Rows",{{"DateValue", type date}})
in
#"Changed Type"

Please let me know if you see any issues with this query change.

Data loading fails in Organization template (All projects using Agile process template)

Describe the bug
When trying to load the data in the Organization version, the following error is thrown:

Microsoft.Mashup.Engine1.Library.Resources.HttpResource: Request failed: OData Version: 3 and 4, Error: The remote server returned an error: (400) Bad Request. (VS403483: The query specified in the URI is not valid: VS403522: The property 'Blocked' is not available on the specified Project(s). Please remove 'Blocked' from your query and try again..) OData Version: 4, Error: The remote server returned an error: (400) Bad Request. (VS403483: The query specified in the URI is not valid: VS403522: The property 'Blocked' is not available on the specified Project(s). Please remove 'Blocked' from your query and try again..)

The project version is working without any problems.

To Reproduce
Steps to reproduce the behavior:

  1. Use the latest Organization version (I also tested the last 3 versions with the same outcome)
  2. Enter analytics.dev.azure.com and your organization and click Load.
  3. Error is thrown

Expected behavior
Data is loaded and no error.

Desktop (please complete the following information):

  • OS: Windows 10
  • FlowViz version 3e18fcb
  • Power BI Desktop Version 2.96.1061.0 64-bit (August 2021)

Additional context
FlowViz Organization version from 2020-12-14 is working without errors.

Pipeline Analytics support

Is there an intention for this project to continue? There hasn't been recent activity.

There are a lot of great analytics being added for pipelines now as well. Any plans to tackle this support with an example?

I'm really glad I found this template, it's made it so much easier than manually creating myself.

Thanks,

Work item types to include Tasks

Is your feature request related to a problem? Please describe.
For our SCRUM project, we would like to track the work items to the level of tasks. Currently, we are unable to see 'tasks' under work item types.

Describe the solution you'd like
Include 'Tasks' work item type to all the queries.

Describe alternatives you've considered
None

Additional context
image

Forecast using effort instead of number of items

First, I want to thank you for all the work you've done for this project. It's so helpful for our team.

I was wondering if it is possible or even makes sense to forecast using effort rather than number of items? We have differently sized items in our backlog (user stories 1-20 story points). Can the forecasting charts be adjusted to use this number instead?

Forecast against story points?

Is your feature request related to a problem? Please describe.
no

Describe the solution you'd like
A burn down chart related to effort? you have done an excellent forecast for completed items however do you think you will be able to create a forecast against effort/story points?

Current backlog size on Forecast tab not correct

Describe the bug
I've noticed that the Current Backlog Size (including WIP) counter in the top right of the Forecast tab isn't correct. I've had a look at the query and it looks this is caused by the fact that it performs a Count on the WorkItemID on the WorkItems In Progress2 table which includes the same work item multiple times, once for each state it has had (I think). By changing the visual to use Count (Distinct) I'm getting a more accurate number, although it also doesn't seem to take the Team into account.

To Reproduce
Steps to reproduce the behavior:

  1. Go to Forecast
  2. See the current backlog size in the top right
  3. Compare this to the actual backlog in Azure DevOps
  4. See that these numbers do not match up

Expected behavior
I expect this to match the number of backlog items I actually have on my backlog

Screenshots
Backlog in Azure DevOps:

Screenshot 2021-07-20 at 15 02 28

Current Backlog Size in FlowViz:

Screenshot 2021-07-20 at 15 02 06

Desktop (please complete the following information):

  • OS: [e.g. iOS] macOS
  • Browser [e.g. chrome, safari] Edge
  • Version [e.g. 22] Latest version downloaded from GitHub

Additional context
As I mentioned changing the visual to use Count (Distinct) I get a number that matches with Azure DevOps (off by one, but I guess there might be a synchronization delay for Analytics, not sure). It also doesn't take the Team dimension into account, but I'll file a separate issue for that.

Ideas for improve loading times

Problem
The slowest loading tables seem to be "WorkItems Bl0cked" and "WorkItems Daily Bl0cked Count". I believe this is related to the sheer amount of data that has to be acted on when transformations are done directly to the WorkItemRevisions endpoint. Specifically this is happening due to the "Removed Columns" action right after the OData feed. This action is just selecting the only 6 columns needed in both tables because the WorkItemRevisions endpoint returns a lot of more columns (aka more data). This is not needed since the endpoint accepts a column selection parameter.

Solution
In both tables instead of querying the endpoint with a filter, do it with a select and a filter and then remove the subsequent Removed Columns (select columns) action.
Instead of:

(...)/WorkItemRevisions?$filter=(...)

Do:

(...)/WorkItemRevisions?$select=WorkItemId,Title,AreaSK,Blocked,CycleTimeDays,ChangedDate,ChangedDateSK,TagNames,CompletedDateSK,CompletedDate&$filter=(...)

This removes the need for a subsequent select action in the BI side.

I've tested this approach and it cuts loading time for those tables in about 75%

Datasource connection fails with Feb 2021 template on Server 2019

Describe the bug
I have been using an older version (7/9/2020) of the template successfully for some time. It still functions correctly.
I downloaded the latest version (2/9/2021) of the template and now error out on connection.

To Reproduce

  1. Open fresh template
  2. Enter connection string
  3. Load
Organization
Loading blocked by failures with other queries.
Number of remaining items
Loading blocked by failures with other queries.
Number of weeks to forecast
Loading blocked by failures with other queries.
Data Refresh
Loading blocked by failures with other queries.
WorkItems Completed
Microsoft.Mashup.Engine1.Library.Resources.HttpResource: Request failed: OData Version: 3 and 4, Error: The remote server returned an error: (400) Bad Request. OData Version: 4, Error: The remote server returned an error: (400) Bad Request. OData Version: 3, Error: The remote server returned an error: (400) Bad Request.
WorkItems In Progress WIP
Microsoft.Mashup.Engine1.Library.Resources.HttpResource: Request failed: OData Version: 3 and 4, Error: The remote server returned an error: (400) Bad Request. OData Version: 4, Error: The remote server returned an error: (400) Bad Request. OData Version: 3, Error: The remote server returned an error: (400) Bad Request.
Dates
Microsoft.Mashup.Engine1.Library.Resources.HttpResource: Request failed: OData Version: 3 and 4, Error: The remote server returned an error: (400) Bad Request. OData Version: 4, Error: The remote server returned an error: (400) Bad Request. OData Version: 3, Error: The remote server returned an error: (400) Bad Request.
Project
Loading blocked by failures with other queries.
Areas
Microsoft.Mashup.Engine1.Library.Resources.HttpResource: Request failed: OData Version: 3 and 4, Error: The remote server returned an error: (400) Bad Request. OData Version: 4, Error: The remote server returned an error: (400) Bad Request. OData Version: 3, Error: The remote server returned an error: (400) Bad Request.
WorkItems (Count of InProgress)
Microsoft.Mashup.Engine1.Library.Resources.HttpResource: Request failed: OData Version: 3 and 4, Error: The remote server returned an error: (400) Bad Request. OData Version: 4, Error: The remote server returned an error: (400) Bad Request. OData Version: 3, Error: The remote server returned an error: (400) Bad Request.
WorkItems Blocked (since 1st Jan 20) - Do Not Edit
Microsoft.Mashup.Engine1.Library.Resources.HttpResource: Request failed: OData Version: 3 and 4, Error: The remote server returned an error: (400) Bad Request. OData Version: 4, Error: The remote server returned an error: (400) Bad Request. OData Version: 3, Error: The remote server returned an error: (400) Bad Request.
Daily Blocked Count
Microsoft.Mashup.Engine1.Library.Resources.HttpResource: Request failed: OData Version: 3 and 4, Error: The remote server returned an error: (400) Bad Request. OData Version: 4, Error: The remote server returned an error: (400) Bad Request. OData Version: 3, Error: The remote server returned an error: (400) Bad Request.

Using Power BI Desktop - Version: 2.88.1682.0 64-bit (December, 2020)
Internally hosted Azure DevOps Server 2019

Allow filters to retain selection while switching view

Is your feature request related to a problem? Please describe.
Losing team backlog analysis effectiveness when switching view, because the team selected is not reapplied on views.

Describe the solution you'd like
For example, while on Dashboard view and selecting a team in the filter, when switching to another view (e.g. WIP), have that same team selected

Describe alternatives you've considered
I implemented on my side, but it needs to be reconfigured with each new release.

Additional context
Is configured in PowerBI Desktop, see MS article

Improve version control

Problem
When something is changed in the report templates due to an improvement or a fix its not always easy to determine what the change was by reading the git logs. This makes it difficult for people who are using your templates but adding some small tweaks or in the mid of trying new features that they might want to merge with the new change. It also makes it harder to contribute to your project because it is difficult to merge changes in pbit files.

Solution
Instead of storing the whole pbit file in version control, unpack it and store it in version control unpacked (the pbit and pbix files are just zip files really). Then use an automation process (GitHub actions, Azure DevOps pipelines, etc.) to build (repack) the files when a new change is added to your master branch and make that a downloadable release. Users will download the pbit they need from the releases section, developers will clone your repo or fork it or branch it out.

Limitation
The DataMashup and SecurityBindings files inside the pack are encrypted so merging changes in those is not possible, developers will still have to take them as whole files.
Inside the pack, under .\Report\StaticResources\RegisteredResources there are images and other binary resources, these will have to be treated as whole files too.

Screenshot of the content of one of the pbit files
image

Projects Missing From WorkItems WIP Age

Data for only 6 of or 33 projects is appearing in WorkItems WIP Age so nothing appears on the Daily WIP panels. All 33 projects appear in WorkItems In Progress and WorkItems In Progress2. All 33 projects are using the same AzDO Process and the In Progress states are Active and Resolved.

Please let me know how to troubleshoot how data gets into WorkItems WIP Age.

Page filter on Blockers tab different between dark mode and regular copy

Describe the bug
The page filter on the Blockers page for WorkItemType is different between the dark mode template and the light mode & organizational templates.

To Reproduce
Open each template, look at the filters on the blockers page.

Expected behavior
Filters are all the same, and work regardless of whether you are using scrum or agile process template.

Screenshots
If applicable, add screenshots to help explain your problem.
image
vs
image

Additional context
The Blockers page filter appears to be different from the other pages of the light mode template as well. I like the filter by exclusion better, as otherwise Product Backlog Items are excluded.

Latest version unable to setup auto refresh

Hi Nick

Have downloaded the latest version to use which is working as normal (i can enter the parameters and it connects and retrieves data fine). After publishing the report i am unable to setup auto refresh as it says Data Source for Query1 is not supported.

Capture

Looked in the data sources and there is the warning triangle about some of them being hand authored which i havent seen before

Capture1

Is anyone else experiencing this? Older versions i have are still working fine

Recommend Projects

  • React photo React

    A declarative, efficient, and flexible JavaScript library for building user interfaces.

  • Vue.js photo Vue.js

    🖖 Vue.js is a progressive, incrementally-adoptable JavaScript framework for building UI on the web.

  • Typescript photo Typescript

    TypeScript is a superset of JavaScript that compiles to clean JavaScript output.

  • TensorFlow photo TensorFlow

    An Open Source Machine Learning Framework for Everyone

  • Django photo Django

    The Web framework for perfectionists with deadlines.

  • D3 photo D3

    Bring data to life with SVG, Canvas and HTML. 📊📈🎉

Recommend Topics

  • javascript

    JavaScript (JS) is a lightweight interpreted programming language with first-class functions.

  • web

    Some thing interesting about web. New door for the world.

  • server

    A server is a program made to process requests and deliver data to clients.

  • Machine learning

    Machine learning is a way of modeling and interpreting data that allows a piece of software to respond intelligently.

  • Game

    Some thing interesting about game, make everyone happy.

Recommend Org

  • Facebook photo Facebook

    We are working to build community through open source technology. NB: members must have two-factor auth.

  • Microsoft photo Microsoft

    Open source projects and samples from Microsoft.

  • Google photo Google

    Google ❤️ Open Source for everyone.

  • D3 photo D3

    Data-Driven Documents codes.