ImageJ macros and scripts written at the imaging facility MRI. Have a look at the project's wiki to get more information about the image analysis tools.
 Analyze the clustering behavior of nuclei in 3D images. The centers of the nuclei are detected. The nuclei are filtered by the presence of a signal in a different channel. The clustering is done with the density based algorithm DBSCAN. The nearest neighbor distances between all nuclei and those outside and inside of the clusters are calculated.
 The Adipocytes Tools help to analyze fat cells in images from histological section.
 The tool uses the Directionality plugin to measure the main direction of the structures in the image and the dispersion. It is used in this context to analyze to which degree the muscles in the image are vertically aligned. The tool allows to run the Directionality plugin in batch-mode on a series of images. The direction-histograms and the measurements are exported as csv-files.
 Analyze images from second harmonics microscopy of cardiac muscle cells (cardiomyocytes). The tool measures the length of the sarcomeres using the FFT of the image and the degree of organization of the sarcomeres by using the dispersion provided by the Directonality command of FIJI. Although the input images can be stacks only the middle slice is used for the analysis.
 The tool measures the areal number density of comets in cells.
 This tool allows to analyze morphological characteristics of complex roots. While for young roots the root system architecture can be analyzed automatically, this is often not possible for more developed roots. The tool is inspired by the Sholl analysis used in neuronal studies. The tool creates a binary mask and the Euclidean Distance Transform from the input image. It then allows to draw concentric circles around a base point and to extract measures on or within the circles. Instead of circles, which present the distance from the base point, horizontal lines can be used, which present the distance in the soil from the base-line.
 The tool counts the spots per protoplast. If a third channel is provided it is used to filter out detected protoplasts that do not have exactly one nucleus.
 The Arabidopsis Seedlings Tool allows to measure the surface of green pixels per well in images containing multiple wells. It can be run in batch mode on a series of images. It writes a spreadsheet file with the measured area per well and saves a control image showing the green surface that has been detected per well.
 Analyze the clustering behavior of nuclei in DAPI stained images. The nuclei are detected as the maxima in the image. Using a threshold intensity value, maxima below the threshold are eliminated. The resulting points are clustered using the DBSCAN algorithm. The nearest neighbor distances between all nuclei, and those outside and inside of the clusters are calculated.
 The aim of this tool is to count the hair cells in sections of 200µm from the apex of the cochlear to its base. The tool needs two types of input images: the 3d stack of the hair cells and a binary mask created from this stack by using the spot detection algorithm of Imaris (Bitplane). After the detection of the spots the background has been set to 0 and the volumes of the spots to 255 and the image has been exported as a tif-series. The tool allows to make the MIP-projections of the two kinds of input images in batch mode.
 Count the number of axonal projections that cross a given line. The tool detects and counts the maxima along a line-selection, for example a segmented line.
 The tool detects and counts the neurons and the neurons with satellite cells.
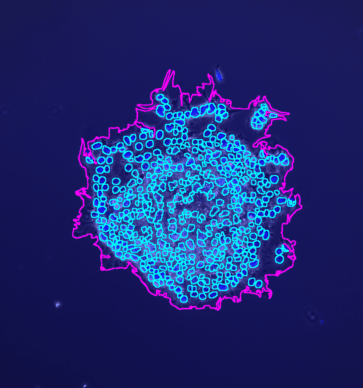
 The tool detects and and counts the spots (or blobs) in an image. It has been created for the counting of bacteria colonies in in Petri-dishes. It separates the spots into two populations and counts each population individually. The populations are separated by the area of the spots. The tool uses expectation maximisation clustering from the weka software.
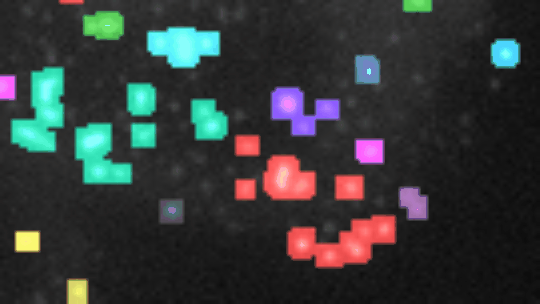
 The tool creates images of 2D-spots for the evaluation and benchmarking of spot detection tools. Two populations of spots with different means and variations of the size can be created in the same image.
 Measure the relative area of sirius red stained fibrosis. The tool uses the colour deconvolution plugin from Gabriel Landini.
 The tool count filaments and measure their areas and forms. It specially measures the geodesic diameter of the objects and its curvature, counts the branches and measures their lengths.
 Calculate the area-fraction of the image filled with (septin) filaments.

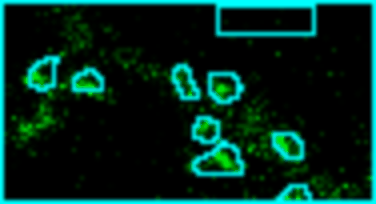
 The tool detects, counts and measures the foci per nucleus. It reports the number of small, medium sized and big fosci per nucleus. It also measures the area and mean intensity of the nuclei.
 In images from transmission electron microscopy of the optic nerve, calculate the g-ratio of the axons. The pg-factor and the ag-factor will be measured. The pg-factor is the inner perimeter of the neuron divided by the outer perimeter including the myelin. The ag-factor is the square-root of the area of the inner surface divided by the area of the outer surface including the myelin.
 The Growth Cone Visualizer Software is an imageJ-marco toolset that visualizes the morphological variability of neuronal growth cones.
 The tools help to compare the height in the z-dimension of the signals in different channels. It calculates the heights normalized by the maximum height in a reference channel. Only places where the signal is not zero and the reference channel maximal are taken into account.
 The tool segments the nuclei in the dapi or hoechst channel of the image and measures the mean intensity per nuclei in the other channels of the image. The macro can be applied recursively to all images in a folder and its subfolders.
 The tool calculates the ratio of the intensity in the nuclei and the cytoplasm. It needs two images as input: the cytoplasm channel and the nuclei channel. The nuclei channel is used to segment the nuclei. The measurements are made in the cytoplasm channel after the background intensity has been corrected.
 The tool counts the number of spots (foci) per nucleus and measures the intensity, form, size and position of the spots. It also optionally measures the intensity in the membrane of the nucleus.
 Measure the signal in a channel in areas defined by the stained nuclei in another channel. Remove the bright spots when measuring the signal.
 The toolset helps to segment neurites, measure the distances on the neurites to the closest soma, assign each neurite to a soma and to measure the FISH-signal on the neurites.
 The tool measures the membranes and nuclei, of cells segmented with cellpose, in all channels but the nuclei-channel.
 The tool allows to segment cells in non fluorescent microscopy images using the trainable WEKA segmentation. It allows to run a preprocessing that crops and converts images, to apply a classifier created with the Trainable Weka Segmentation plugin to a folder containing images and to open the images in a folder as a stack in the "Trainable Weka Segmentation plugin" to create a classifier.
 Calculate the first derivative of a plot and the zero-crossings of the derivate.
 The tool allows to measure the diameter of the root and the density of the root hair.
 The Skin Tools allow to analyze masks of skin tissue that touch the right and left border of the image. The length of the lower border line is measured. For each extremum on the lower border line of the mask the length of a vertical line across the mask is measured. The advanced analysis allows to measure the interdigitation index and the filaggrin thickness. The filaggrin thickness is calculated using a number of random lines perpendicular to the border across the mask.
 The tools allow to semi-automatically segment dendritic spines in 3D+t images and to measure their volumes and the intensities of the signal within in different channels over time.
 The tool counts the number of co-localized spots in two channels over time. It also exports the intensity of each spot over time.
 The tool detects spots and measures the nearest neighbour distances between the spots in the image.
 The tool allows to simulate particles moving away from a center, moving towards a center or particles diffusing around a center.
 The tool allows to track the ends of fluorescently labelled microtubules, which are becoming shorter and to measure the speed of the movement of each end. It also creates kymograms and plots distance-per-time.
 The tool helps to measure the transfection efficiency. It reports the percentage of transfected cells in the image. It has tools to manually correct the segmented nuclei (merge and split).
 Tools to estimate the width-profile of an object given as a binary mask image. Calculate the width profile of the object as local thickness, as voronoi distance between two parts of the contour-line, perpendicular to the axis of inertia or at regular distances using rays perpendicular to a centerline segment.
 The Wound Healing Coherency Tool can be used to analyze scratch assays. It measures the area of a wound in a cellular tissue on a stack of images representing a time-series.
 The MRI Wound Healing Tool can be used to analyze scratch assays. It measures the area of a wound in a cellular tissue on a stack of images representing a time-series.
![]() Because of the big size of the images the microscope cuts images along the time dimension into multiple files each with a number of frames. This tool will for each position and wavelength convert the image. It will do a z-projection, concatenate all time-chunks and save the resulting image. The user has to provide the number of slices in the z-dimension. The pixel size and time interval can automatically be set when provided by the user.
Because of the big size of the images the microscope cuts images along the time dimension into multiple files each with a number of frames. This tool will for each position and wavelength convert the image. It will do a z-projection, concatenate all time-chunks and save the resulting image. The user has to provide the number of slices in the z-dimension. The pixel size and time interval can automatically be set when provided by the user.
![]() The tool converts images taken with the Opera into hyperstacks. The image names are in the form
The tool converts images taken with the Opera into hyperstacks. The image names are in the form r02c04f01p01-ch1sk1fk1fl1.tiff where r is the row, c the column, f the field, p the z-position and ch the channel. The tool converts all images in the input folder.
![]() The tools allow to convert .lei or .lif and .lsm files to tif-files. It works on a folder containing the input images. Results are written into a sub-folder
The tools allow to convert .lei or .lif and .lsm files to tif-files. It works on a folder containing the input images. Results are written into a sub-folder tif. Each channel of a multi-channel file is saved separately. Besides this an rgb-snapshot of the image is saved. A z-projection can optionally be applied to the images.
![]() The tool allows to open for each image a second image with the same name from another folder. It displays the two images next to each other. It provides navigation through the list of images.
The tool allows to open for each image a second image with the same name from another folder. It displays the two images next to each other. It provides navigation through the list of images.
 Randomly copy files from a number of input folders to create a test dataset.
 The Muvi-SPIM-Convert_Tools help to convert your hdF5 files comming from a MuVi-SPIM setup.
![]() The tools converts images in the .nd format to ImageJ hyperstacks. The user selects an .nd file. An image can consist of multiple positions, frames, z-slices and channels. Each position is converted into an ImageJ hyperstack and written into a subfolder of the folder containing the input image.
The tools converts images in the .nd format to ImageJ hyperstacks. The user selects an .nd file. An image can consist of multiple positions, frames, z-slices and channels. Each position is converted into an ImageJ hyperstack and written into a subfolder of the folder containing the input image.
![]() The tool exports rectangular regions, defined with the NDP.view 2 software from the highest resolution version of the image and saves them as tif-files.
The tool exports rectangular regions, defined with the NDP.view 2 software from the highest resolution version of the image and saves them as tif-files.
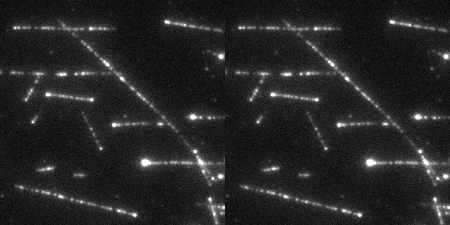
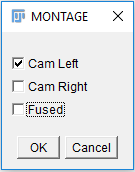
![]() The tool stitches images from the Opera Phenix HCS System. It reads the Index.idx.xml file to pre-arrange the images and then stitches and fuses them using the Grid/Collection stitching-plugin. Images are stitched by plane and channel. Z-stacks and multi-channel images can optionally be created. Projections can also be create.
The tool stitches images from the Opera Phenix HCS System. It reads the Index.idx.xml file to pre-arrange the images and then stitches and fuses them using the Grid/Collection stitching-plugin. Images are stitched by plane and channel. Z-stacks and multi-channel images can optionally be created. Projections can also be create.
 The tool calculates the discrete histogram entropy H(X), where w is the width of the i-th histogram bin and f the frequency of the value xi.
 The tool measures the mean distance between the minima in the profile plot.
 The DoG-filter is a bandpass filter. It is calculated as: Gauss_s1(img) - Gauss_s2(img) where img is the input image, Gauss_s1 is a Gaussian-filter with sigma s1 and Gauss_s2 is a Gaussian-filter with sigma s2 (s2>s1).
 The tool finds the background intensity value and subtract it from the current image. It searches for the maximum intensity value around pixels that are below or equal to the minimum intensity in the image plus an offset.
 The tool allows to create a sub-population of your data by randomly copying a configurable portion of lines from the active table to a new table.
![]() The tool reverses the order of the frames in a hyperstack.
The tool reverses the order of the frames in a hyperstack.
 Allows to segment a batch of mitotic spindles and extract measurements from a microtubules staining.
 The tool copies the images in a stack into a new image and places them in a spiral order, i.e. the first image is in the middle, the second right of the first, the third above the second, the fourth left of the third, and so on.
 The macro calls the Measure Roi plugin for each selected ROI in the roi-manager or for all the ROIs in the roi-manager, if none are selected.