mne-tools / mne-qt-browser Goto Github PK
View Code? Open in Web Editor NEWA new backend for the 2D data browser in MNE-Python
License: BSD 3-Clause "New" or "Revised" License
A new backend for the 2D data browser in MNE-Python
License: BSD 3-Clause "New" or "Revised" License


![dependabot[bot] avatar](https://avatars.githubusercontent.com/in/29110?v=4 "dependabot[bot]")


![pre-commit-ci[bot] avatar](https://avatars.githubusercontent.com/in/68672?v=4 "pre-commit-ci[bot]")


Apologies if I'm missing something very obvious, but when executing raw.plot(), the browser doesn't open a window, even behind other windows. I'm running the script in the tutorial here on an Intel mac with Big Sur:
The horizontal line of the crosshair (keyboard-shortcut x) moves with dizzying speed and should be better replaced with a small dot.
To make use of this amazing package, I have to refer to it as pyqtgraph backend in MNE-Python. This is super technical and its name has nothing to do with the name of this package (well, of course, except for the qt bit)
Any chance we could simply name the backend qt or so? At least in the public API?
cc @larsoner
Hi,
When I try to use this with an Epochs object, it returns an error because it's trying to get the annotations field from Epochs which doesn't exist. Here's the error:
Loading data for 21 events and 2001 original time points ...
Traceback (most recent call last):
  File "/Users/sportsnoah14/opt/miniconda3/envs/ieeg/lib/python3.7/site-packages/IPython/core/interactiveshell.py", line 3457, in run_code
    exec(code_obj, self.user_global_ns, self.user_ns)
  File "<ipython-input-10-96c8a116aab9>", line 6, in <module>
    group_by='original'
  File "/Users/sportsnoah14/opt/miniconda3/envs/ieeg/lib/python3.7/site-packages/mne/epochs.py", line 1143, in plot
    group_by=group_by)
  File "/Users/sportsnoah14/opt/miniconda3/envs/ieeg/lib/python3.7/site-packages/mne/viz/epochs.py", line 904, in plot_epochs
    fig = _get_browser(**params)
  File "/Users/sportsnoah14/opt/miniconda3/envs/ieeg/lib/python3.7/site-packages/mne/viz/_figure.py", line 613, in _get_browser
    browser = backend._init_browser(**kwargs)
  File "/Users/sportsnoah14/opt/miniconda3/envs/ieeg/lib/python3.7/site-packages/mne_qt_browser/_pg_figure.py", line 3852, in _init_browser
    browser = PyQtGraphBrowser(**kwargs)
  File "/Users/sportsnoah14/opt/miniconda3/envs/ieeg/lib/python3.7/site-packages/mne_qt_browser/_pg_figure.py", line 2201, in __init__
    self.mne.new_annotation_labels = self._get_annotation_labels()
  File "/Users/sportsnoah14/opt/miniconda3/envs/ieeg/lib/python3.7/site-packages/mne/viz/_figure.py", line 136, in _get_annotation_labels
    return sorted(set(self.mne.inst.annotations.description) |
AttributeError: 'Epochs' object has no attribute 'annotations'
I could be missing something and not passing in the arguments as I should.
Running
import mne
mne.viz.set_browser_backend('pyqtgraph')  # TODO: MNE_BROWSE_ but set_browser (r)
fname = mne.datasets.sample.data_path() + '/MEG/sample/sample_audvis_filt-0-40_raw.fif'
raw = mne.io.read_raw_fif(fname)
for _ in range(10):
    raw.plot()
I get a bunch of plots that show up, some of which are correct:

And a bunch of which never finish loading:

I suspect that this is a threading problem.
when looking at EEG data in a clinical context it's important for me to know in absolute time when the data was collected. The viewer shows time in seconds and I would love to see the time in datetime format. For this you need to look at the info['meas_date']

@marsipu do you have time to look?
MNE_BROWSER_BACKEND=pyqtgraph python -c "import mne; raw = mne.io.read_raw_fif(mne.datasets.sample.data_path() + '/MEG/sample/sample_audvis_raw.fif').plot(bgcolor='k', block=True, verbose=True)"
produces

even after mne-tools/mne-python#10317
MWE:
# %%
import mne

sample_dir = mne.datasets.sample.data_path()
sample_fname = sample_dir / 'MEG' / 'sample' / 'sample_audvis_raw.fif'

raw = mne.io.read_raw_fif(sample_fname)
events = mne.find_events(raw, stim_channel='STI 014')
event_id = {
    'auditory/left': 1, 'auditory/right': 2, 'visual/left': 3,
    'visual/right': 4, 'face': 5, 'buttonpress': 32
}
epochs = mne.Epochs(
    raw=raw,
    events=events,
    event_id=event_id,
    preload=True
)
epochs.plot(block=True)
Produces:

MNE_BROWSE_BACKEND=pyqtgraph mne browse_raw ~/mne_data/MNE-sample-
data/MEG/sample/sample_audvis_raw.fif
I get:

Pressing rightarrow is correct (scrolls right), but pressing downarrow is incorrect as it changes the overview bar mode rather than scrolling down the channels:

In other words, I think the overview bar has keyboard focus on init when it should be the data view.
MWE:
# %%
import mne

sample_dir = mne.datasets.sample.data_path()
sample_fname = sample_dir / 'MEG' / 'sample' / 'sample_audvis_raw.fif'

raw = mne.io.read_raw_fif(sample_fname, preload=True)
raw.pick_types(meg='mag', ecg=True)

epochs = mne.preprocessing.create_ecg_epochs(
    raw=raw.filter(l_freq=0.1, h_freq=30)
)

ecg_proj, _ = mne.preprocessing.compute_proj_ecg(
    raw=raw,
    n_mag=1
)

epochs.add_proj(ecg_proj)
epochs.plot(n_channels=5, n_epochs=5)
I generate ERF images by right-clicking on a channel name, with and without the ECG projector active.
Expected behavior would be that the generated ERF image is based on what I can see in the browser, i.e. the traces with the ECG artifact removed via the projection.
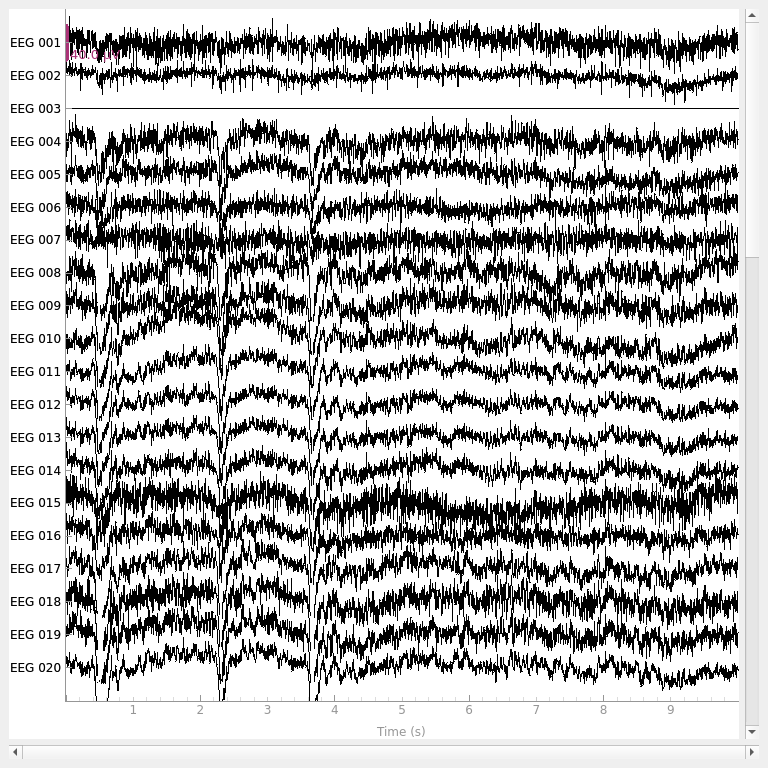
Hi, Thanks for this awesome addition to MNE-Python. I am running into a weird visualization issue that I'd like to report. On the pyqtgraph backend, I see thick black horizontal lines that I don't see on the matplotlib backend. Do you have any idea where they might come from?


Either executing the matplotlib cell or the pyqtgraph cell. I could share the raw data, but I have tried two different files and both have this problem, so I don't think it's the data.
"""Inspect the raw data."""

# %%
import mne

from config import get_sourcedata

# %%
# Load and prepare data
vhdr, tsv = get_sourcedata(2, "single")
raw = mne.io.read_raw_brainvision(vhdr, preload=True)

# Set the EOG and ECG channels to their type
raw.set_channel_types({"ECG": "ecg", "HEOG": "eog", "VEOG": "eog"})

# Set a standard montage for plotting later
montage = mne.channels.make_standard_montage("standard_1020")
raw.set_montage(montage)

# Temporarily remove existing annotations for faster interactive plotting
raw.set_annotations(None)

# %%

with mne.viz.use_browser_backend('pyqtgraph'):
    raw.plot(block=True)


# %%
%matplotlib qt

raw.plot(block=True)click details.
Platform:       Linux-5.4.0-89-generic-x86_64-with-glibc2.17
Python:         3.8.12 (default, Oct 12 2021, 13:49:34)  [GCC 7.5.0]
Executable:     /home/stefanappelhoff/miniconda3/envs/ecomp_analysis/bin/python
CPU:            x86_64: 8 cores
Memory:         31.2 GB

mne:            0.24.0
numpy:          1.21.2 {blas=openblas, lapack=openblas}
scipy:          1.7.1
matplotlib:     3.4.3 {backend=Qt5Agg}

sklearn:        1.0.1
numba:          Not found
nibabel:        Not found
nilearn:        Not found
dipy:           Not found
cupy:           Not found
pandas:         1.3.4
mayavi:         Not found
pyvista:        Not found
pyvistaqt:      Not found
ipyvtklink:     Not found
vtk:            Not found
PyQt5:          5.15.6
ipympl:         Not found
mne_qt_browser: 0.1.6
The "Zoom in / out" buttons are kind of arbitrarily labeled, considering that just left of them in the toolbar there are buttons for "zooming in and out" of time and channels.
What these buttons do is increase or decrease the displayed amplitude, and I think we should label them accordingly: "Increase / decrease amplitude". The corresponding icons should be waves with a high and with a flat amplitude.
Currently this uses mkQApp from pyqtgraph, then sets icon, etc. And in #22 more Qt stuff is done regarding QSettings. Ideally we should use a single shared function in MNE-Python for creating a Qt application, deduplicating with
(NB: I think our other Qt application iEEG GUI gets this for free by using https://github.com/mne-tools/mne-python/blob/bdedc788b79f7b620167ba6358965ce312ec51be/mne/gui/_ieeg_locate_gui.py#L154-L155, but that doesn't really apply here)
Earlier today, on an env with the latest dev version of mne and mne_qt_browser on my MacBook, the raw.plot() I opened were in dark mode/theme. And sure I do like dark mode usually, but here it was really not that great and made the examination of the signal a pain.
Feature request:
Bug:
thene='light' in raw.plot() is ignored.I think the MacBook is set up in dark mode at the system-level, which is not the case on the Windows PC I'm using at the moment where the raw.plot() do not display with a dark theme.
Next one, same venv, I wanted to try the sample dataset with the terminal command mne-qt-browser.
This time, I'm getting this traceback:
Using pyopengl with version 3.1.5
C:\Users\Mathieu\Documents\pyvenv\neurotin\lib\site-packages\mne_qt_browser\_pg_figure.py:732: DeprecationWarning: Parsing of hex strings that do not start with '#' isdeprecated and support will be removed in 0.13
  color = mkColor(self.mne.ch_color_dict[ch_type])
Traceback (most recent call last):
  File "C:\Program Files\Python38\lib\runpy.py", line 194, in _run_module_as_main
    return _run_code(code, main_globals, None,
  File "C:\Program Files\Python38\lib\runpy.py", line 87, in _run_code
    exec(code, run_globals)
  File "C:\Users\Mathieu\Documents\pyvenv\neurotin\Scripts\mne-qt-browser.exe\__main__.py", line 7, in <module>
  File "C:\Users\Mathieu\Documents\pyvenv\neurotin\lib\site-packages\mne_qt_browser\__main__.py", line 22, in main
    raw.plot(block=True)
  File "C:\Users\Mathieu\Documents\pyvenv\neurotin\lib\site-packages\mne\io\base.py", line 1528, in plot
    return plot_raw(self, events, duration, start, n_channels, bgcolor,
  File "<decorator-gen-174>", line 24, in plot_raw
  File "C:\Users\Mathieu\Documents\pyvenv\neurotin\lib\site-packages\mne\viz\raw.py", line 367, in plot_raw
    fig = _get_browser(**params)
  File "C:\Users\Mathieu\Documents\pyvenv\neurotin\lib\site-packages\mne\viz\_figure.py", line 613, in _get_browser
    browser = backend._init_browser(**kwargs)
  File "C:\Users\Mathieu\Documents\pyvenv\neurotin\lib\site-packages\mne_qt_browser\_pg_figure.py", line 3722, in _init_browser
    browser = PyQtGraphBrowser(**kwargs)
  File "C:\Users\Mathieu\Documents\pyvenv\neurotin\lib\site-packages\mne_qt_browser\_pg_figure.py", line 2184, in __init__
    overview_bar = OverviewBar(self)
  File "C:\Users\Mathieu\Documents\pyvenv\neurotin\lib\site-packages\mne_qt_browser\_pg_figure.py", line 497, in __init__
    self.set_background()
  File "C:\Users\Mathieu\Documents\pyvenv\neurotin\lib\site-packages\mne_qt_browser\_pg_figure.py", line 732, in set_background
    color = mkColor(self.mne.ch_color_dict[ch_type])
  File "C:\Users\Mathieu\Documents\pyvenv\neurotin\lib\site-packages\pyqtgraph\functions.py", line 289, in mkColor
    g = int(c[2:4], 16)
ValueError: invalid literal for int() with base 16: 'rk'
Traceback (most recent call last):
  File "C:\Users\Mathieu\Documents\pyvenv\neurotin\lib\site-packages\mne_qt_browser\_pg_figure.py", line 1995, in run
    self.sigs.loadProgress.emit(n + 1)
RuntimeError: wrapped C/C++ object of type LoadRunnerSignals has been deleted
On another hand, the same command is working in my venv with mne installed in dev mode from the GitHub repository.. Obviously, both venv differs in several ways. In the one failing, I have another library installed that uses pyqtgraph as a dependency, so it was not updated when I installed the browser. The working venv is running 0.12.3 and the failing venv is running 0.12.2.
When loading and plotting one of my test BDF files, I get a segfault when scrolling a little through the data. Here's the code I type into IPython:
import mne

raw = mne.io.read_raw("S01.bdf")
raw.plot(block=True)
And the full output after the plotting command:
Using qt as 2D backend.
Opening raw-browser...
Free RAM space could not be determined because"psutil" is not installed. Setting precompute to False.
qt.qpa.fonts: Populating font family aliases took 367 ms. Replace uses of missing font family "AnyStyle" with one that exists to avoid this cost.
Fatal Python error: Segmentation fault

Thread 0x000070000d54d000 (most recent call first):
  File "/usr/local/Cellar/[email protected]/3.10.2/Frameworks/Python.framework/Versions/3.10/lib/python3.10/threading.py", line 320 in wait
  File "/usr/local/Cellar/[email protected]/3.10.2/Frameworks/Python.framework/Versions/3.10/lib/python3.10/threading.py", line 600 in wait
  File "/usr/local/lib/python3.10/site-packages/IPython/core/history.py", line 829 in run
  File "/usr/local/lib/python3.10/site-packages/IPython/core/history.py", line 60 in only_when_enabled
  File "/usr/local/lib/python3.10/site-packages/decorator.py", line 232 in fun
  File "/usr/local/Cellar/[email protected]/3.10.2/Frameworks/Python.framework/Versions/3.10/lib/python3.10/threading.py", line 1009 in _bootstrap_inner
  File "/usr/local/Cellar/[email protected]/3.10.2/Frameworks/Python.framework/Versions/3.10/lib/python3.10/threading.py", line 966 in _bootstrap

Current thread 0x0000000116715e00 (most recent call first):
  File "/usr/local/lib/python3.10/site-packages/pyqtgraph/graphicsItems/PlotCurveItem.py", line 563 in paint
  File "/usr/local/lib/python3.10/site-packages/pyqtgraph/debug.py", line 110 in w
  File "/usr/local/lib/python3.10/site-packages/pyqtgraph/widgets/GraphicsView.py", line 143 in paintEvent
  File "/Users/clemens/Repositories/mne-python/mne/viz/backends/_utils.py", line 164 in _qt_app_exec
  File "/Users/clemens/Repositories/mne-python/mne/viz/utils.py", line 153 in _show_browser
  File "/Users/clemens/Repositories/mne-python/mne/viz/_figure.py", line 652 in _get_browser
  File "/Users/clemens/Repositories/mne-python/mne/viz/raw.py", line 353 in plot_raw
  File "<decorator-gen-180>", line 12 in plot_raw
  File "/Users/clemens/Repositories/mne-python/mne/io/base.py", line 1551 in plot
  File "<ipython-input-6-2fe91485cf70>", line 1 in <module>
  File "/usr/local/lib/python3.10/site-packages/IPython/core/interactiveshell.py", line 3251 in run_code
  File "/usr/local/lib/python3.10/site-packages/IPython/core/interactiveshell.py", line 3191 in run_ast_nodes
  File "/usr/local/lib/python3.10/site-packages/IPython/core/interactiveshell.py", line 3012 in run_cell_async
  File "/usr/local/lib/python3.10/site-packages/IPython/core/async_helpers.py", line 129 in _pseudo_sync_runner
  File "/usr/local/lib/python3.10/site-packages/IPython/core/interactiveshell.py", line 2814 in _run_cell
  File "/usr/local/lib/python3.10/site-packages/IPython/core/interactiveshell.py", line 2768 in run_cell
  File "/usr/local/lib/python3.10/site-packages/IPython/terminal/interactiveshell.py", line 604 in interact
  File "/usr/local/lib/python3.10/site-packages/IPython/terminal/interactiveshell.py", line 611 in mainloop
  File "/usr/local/lib/python3.10/site-packages/IPython/terminal/ipapp.py", line 316 in start
  File "/usr/local/lib/python3.10/site-packages/traitlets/config/application.py", line 846 in launch_instance
  File "/usr/local/lib/python3.10/site-packages/IPython/__init__.py", line 123 in start_ipython
  File "/usr/local/bin/ipython", line 8 in <module>

Extension modules: black.const, blib2to3.pgen2.token, blib2to3.pgen2.grammar, blib2to3.pytree, blib2to3.pgen2.tokenize, blib2to3.pgen2.parse, blib2to3.pgen2.pgen, blib2to3.pgen2.driver, blib2to3.pygram, black.mode, black.cache, black.strings, black.nodes, black.brackets, black.lines, black.comments, black.numerics, black.rusty, black.trans, black.linegen, black.handle_ipynb_magics, black.parsing, black, numpy.core._multiarray_umath, numpy.core._multiarray_tests, numpy.linalg._umath_linalg, numpy.fft._pocketfft_internal, numpy.random._common, numpy.random.bit_generator, numpy.random._bounded_integers, numpy.random._mt19937, numpy.random.mtrand, numpy.random._philox, numpy.random._pcg64, numpy.random._sfc64, numpy.random._generator, numpy.linalg.lapack_lite, PyQt5.QtCore, PyQt5.QtGui, PyQt5.QtWidgets, PyQt5.QtTest, matplotlib._c_internal_utils, PIL._imaging, matplotlib._path, kiwisolver, matplotlib._image, PyQt5.QtSvg, scipy._lib._ccallback_c, scipy.sparse._sparsetools, scipy.sparse._csparsetools, scipy.sparse.csgraph._tools, scipy.sparse.csgraph._shortest_path, scipy.sparse.csgraph._traversal, scipy.sparse.csgraph._min_spanning_tree, scipy.sparse.csgraph._flow, scipy.sparse.csgraph._matching, scipy.sparse.csgraph._reordering, scipy.spatial._ckdtree, scipy._lib.messagestream, scipy.spatial._qhull, scipy.spatial._voronoi, scipy.linalg._fblas, scipy.linalg._flapack, scipy.linalg._cythonized_array_utils, scipy.linalg._flinalg, scipy.linalg._solve_toeplitz, scipy.linalg._matfuncs_sqrtm_triu, scipy.linalg.cython_blas, scipy.linalg.cython_lapack, scipy.linalg._decomp_update, scipy.spatial._distance_wrap, scipy.spatial._hausdorff, scipy.special._ufuncs_cxx, scipy.special._ufuncs, scipy.special._specfun, scipy.special._comb, scipy.special._ellip_harm_2, scipy.spatial.transform._rotation, scipy.ndimage._nd_image, _ni_label, scipy.ndimage._ni_label, scipy.sparse.linalg._isolve._iterative, scipy.sparse.linalg._dsolve._superlu, scipy.sparse.linalg._eigen.arpack._arpack, scipy.optimize._minpack2, scipy.optimize._group_columns, scipy.optimize._trlib._trlib, scipy.optimize._lbfgsb, _moduleTNC, scipy.optimize._moduleTNC, scipy.optimize._cobyla, scipy.optimize._slsqp, scipy.optimize._minpack, scipy.optimize._lsq.givens_elimination, scipy.optimize._zeros, scipy.optimize.__nnls, scipy.optimize._highs.cython.src._highs_wrapper, scipy.optimize._highs._highs_wrapper, scipy.optimize._highs.cython.src._highs_constants, scipy.optimize._highs._highs_constants, scipy.linalg._interpolative, scipy.optimize._bglu_dense, scipy.optimize._lsap_module, scipy.integrate._odepack, scipy.integrate._quadpack, scipy.integrate._vode, scipy.integrate._dop, scipy.integrate._lsoda, scipy.interpolate._fitpack, scipy.interpolate.dfitpack, scipy.interpolate._bspl, scipy.interpolate._ppoly, scipy.interpolate.interpnd, scipy.interpolate._rbfinterp_pythran, scipy.special.cython_special, scipy.stats._stats, beta_ufunc, scipy.stats._boost.beta_ufunc, binom_ufunc, scipy.stats._boost.binom_ufunc, nbinom_ufunc, scipy.stats._boost.nbinom_ufunc, hypergeom_ufunc, scipy.stats._boost.hypergeom_ufunc, scipy.stats._biasedurn, scipy.stats._hypotests_pythran, scipy.stats._statlib, scipy.stats._mvn, scipy.stats._sobol, scipy.stats._qmc_cy, scipy.stats._unuran.unuran_wrapper, objc._objc, CoreFoundation._inlines, CoreFoundation._CoreFoundation, Foundation._Foundation, Foundation._inlines (total: 136)
[1]    55701 segmentation fault  ipython
If it's due to some property of the file I'm using (which works fine with the Matplotlib backend), I can try to share it privately (it's pretty large though).
Platform:         macOS-11.6.4-x86_64-i386-64bit
Python:           3.10.2 (main, Feb  2 2022, 08:42:42) [Clang 13.0.0 (clang-1300.0.29.3)]
Executable:       /usr/local/opt/[email protected]/bin/python3.10
CPU:              i386: 8 cores
Memory:           Unavailable (requires "psutil" package)
mne:              1.0.dev0
numpy:            1.22.2 {}
scipy:            1.8.0
matplotlib:       3.5.1 {backend=MacOSX}

sklearn:          1.0.2
numba:            Not found
nibabel:          Not found
nilearn:          Not found
dipy:             Not found
cupy:             Not found
pandas:           1.4.1
pyvista:          Not found
pyvistaqt:        Not found
ipyvtklink:       Not found
vtk:              Not found
PyQt5:            5.15.6
ipympl:           Not found
pooch:            v1.6.0

mne_bids:         Not found
mne_nirs:         Not found
mne_features:     Not found
mne_qt_browser:   0.2.1
mne_connectivity: Not found
$ pip install -e .
Obtaining file:///opt/mne/qt-browser
Requirement already satisfied: numpy in /opt/miniforge3/envs/mnedev/lib/python3.9/site-packages (from mne-qt-browser==0.0.1) (1.21.2)
Requirement already satisfied: scipy in /opt/miniforge3/envs/mnedev/lib/python3.9/site-packages (from mne-qt-browser==0.0.1) (1.7.1)
Requirement already satisfied: matplotlib in /opt/miniforge3/envs/mnedev/lib/python3.9/site-packages (from mne-qt-browser==0.0.1) (3.4.3)
Requirement already satisfied: PyQt5 in /opt/miniforge3/envs/mnedev/lib/python3.9/site-packages (from mne-qt-browser==0.0.1) (5.12.3)
Requirement already satisfied: qtpy in /opt/miniforge3/envs/mnedev/lib/python3.9/site-packages (from mne-qt-browser==0.0.1) (1.11.2)
Requirement already satisfied: mne in /opt/mne/python (from mne-qt-browser==0.0.1) (0.24.dev0)
ERROR: Could not find a version that satisfies the requirement pyqtgraphpyopengl (from mne-qt-browser) (from versions: none)
ERROR: No matching distribution found for pyqtgraphpyopengl
PR to fix coming shortly
Resizing the Window is slowed down by the operations that update the Overview-Bar (recalculating the positions of Annotations-Markers, bad-channels etc.). This could be improved if QGraphicsView could handle somehow the transformation of the scene's child-items on resizing instead of updating them.
Maybe this could be achieved with QGraphicsView.fitInView().
There are some margins left then, which could maybe removed with the solution from here.
In #79 it became apparent that not even very sophisticated and knowledgeable users like @agramfort are not aware of all the cool functionality baked into this tool. This is partially because these features are difficult to discover and only usable via keyboard shortcuts, for which we provide a rather poor table after clicking the Help button.
I propose we add a proper menu that makes for easier discoverability of both the functionality and their associated keyboard shortcuts (as they appear next to the menu entries on most (all?) systems).
I'm just a normal MNE user, and as I like new features, I read through the PR on the main repo. I have at the moment some large datasets (1500-2000 -raw.fif files), and I thought that this new browser could really be beneficial to my projects. And damn, it's impressive!! I can't wait to use it more 😄
A couple of bugs I had on my dataset (64 EEG, 1 EOG, 1 ECG).
raw = mne.io.read_raw('path...', preload=True)

with use_browser_backend('pyqtgraph'):
    raw.plot(block=False)
Making the main window smaller than a full screen (to accentuate the bug) and clicking+holding on the rectangle in the scrollbar, then moving it to the extreme left and then moving the mouse outside the main window cycles the rectangle selection to the right of the scrollbar.
I have some annotations that have been set programmatically on this dataset, and they do render in the scrollbar but not always in the main window.
Depending on the position on the X/Y axis (position of the rectangle on the scrollbar, I get either:

OR

UPDATE: This bug occurs when an annotated segment is not entirely comprised in the viewing window, i.e. when its edges are outside the viewing window. As soon as one of the edges enter the viewing window, the background color comes back on.
Traceback (most recent call last):
  File "C:\Users\Mathieu\Documents\pyvenv\mne_pyqtgraph_backend\lib\site-packages\pyqtgraph\graphicsItems\AxisItem.py", line 608, in paint
    specs = self.generateDrawSpecs(painter)
  File "C:\Users\Mathieu\Documents\pyvenv\mne_pyqtgraph_backend\lib\site-packages\pyqtgraph\graphicsItems\AxisItem.py", line 1057, in generateDrawSpecs
    if tickPositions[i][j] is None:
IndexError: list index out of range
Traceback (most recent call last):
  File "C:\Users\Mathieu\Documents\pyvenv\mne_pyqtgraph_backend\lib\site-packages\pyqtgraph\graphicsItems\AxisItem.py", line 608, in paint
    specs = self.generateDrawSpecs(painter)
I haven't counted but it is probably raised a couple of hundred times 😅
Video:
I understand the motivation for putting the "overview mode" selector at the bottom, because it places it closer to the overview bar. However, it creates a big waste of screen real estate, e.g. here:
I propose to move it up into the toolbar. It's used rarely enough that I think the user experience degradation from having to move the mouse farther is acceptable given the screen space gains for showing traces.
cross-ref mne-tools/mne-python#10481
Also, since the x-axis label is always either "time (sec)" or "epoch", perhaps it makes sense to move the label to the left of the numbers (aligned with the channel labels) or even just remove it altogether. I don't think people will be confused about what is being shown, and it gains us more vertical screen real estate.
Thoughts on these two ideas @marsipu @agramfort @hoechenberger ?
Hi, is there any way that I could take a screenshot of the signals, also could set DPI for it?
Closing the settings dialog gives an error.
import os
import numpy as np
import mne

sample_data_folder = mne.datasets.sample.data_path()
sample_data_raw_file = os.path.join(sample_data_folder, 'MEG', 'sample',
                                    'sample_audvis_filt-0-40_raw.fif')
raw = mne.io.read_raw_fif(sample_data_raw_file)
raw.plot()
Now open and close the settings dialog
No error
I get:
Traceback (most recent call last):
  File "/Users/mainak/anaconda3/envs/mne/lib/python3.9/site-packages/mne_qt_browser/_pg_figure.py", line 4074, in _toggle_settings_fig
    self.mne.fig_help.close()
AttributeError: 'NoneType' object has no attribute 'close'I'm on the latest branch of MNE and last stable install of mne-qt-browser
MWE:
# %%
from pathlib import Path
import mne


sample_dir = Path(mne.datasets.sample.data_path())
sample_fname = sample_dir / 'MEG' / 'sample' / 'sample_audvis_raw.fif'

raw = mne.io.read_raw_fif(sample_fname)
raw.crop(tmax=60)
raw.pick_types(eeg=True, eog=True, stim=True)

events = mne.find_events(raw)
epochs = mne.Epochs(
    raw=raw,
    events=events,
)
epochs.plot()
Produces:

As you can see, I scrolled all the way to the bottom, but there are just no EOG or STIM channels listed there.
The butterfly plot looks like this:

Here, the EOG and STIM channels appear on the y axis tick labels, but there is just no data being shown.
But if I do
epochs.plot(picks='eog')then it becomes clear that there is, in fact, data:

Hello, I cannot find user-focused installation instructions anywhere. Is that intentional, given the current rapid development?
As suggested, I set up CI for the associated tests for the pg-backend.
Currently to run viz-tests for the pg-backend, just the parameter of the fixture browse_backend hast to be set to "pyqtgraph".
My first shot on this was to create conftest.py within this repository for pyqtgraph and to copy the test-files from mne to run them in the directory of this repo (I didn't find a way to pass parameters to pytest when it runs in mne-python to just run "pyqtgraph").
There might be a better solution. WDYT? @agramfort
With this solution we could maybe temporarily remove "pyqtgraph" from browse_backend in MNE-Python in the current integration PR to make it pass the tests (just mpl for now) there and work on passing the tests with pyqtgraph from this repo here.
I updated one of my venv to 0.24.0 and installed mne-qt-browser. It's on a windows PC (same as the one I used to test quickly the backend a couple of days ago).
mne.viz.set_browser_backend('pyqtgraph')
fname = "path-raw.fif"
raw = mne.io.read_raw_fif(fname, preload=True)
raw.plot()  # or with block=True
This code block is failing with the traceback:
Using pyopengl with version 3.1.5
C:\Users\Mathieu\Documents\pyvenv\neurotin\lib\site-packages\mne_qt_browser\_pg_figure.py:529: DeprecationWarning: Parsing of hex strings that do not start with '#' isdeprecated and support will be removed in 0.13
  pen = mkColor(self.mne.ch_color_bad)
Traceback (most recent call last):

  File "C:\Users\Mathieu\AppData\Local\Temp/ipykernel_10132/4118515104.py", line 7, in <module>
    raw.plot()

  File "C:\Users\Mathieu\Documents\pyvenv\neurotin\lib\site-packages\mne\io\base.py", line 1528, in plot
    return plot_raw(self, events, duration, start, n_channels, bgcolor,

  File "<decorator-gen-174>", line 24, in plot_raw

  File "C:\Users\Mathieu\Documents\pyvenv\neurotin\lib\site-packages\mne\viz\raw.py", line 367, in plot_raw
    fig = _get_browser(**params)

  File "C:\Users\Mathieu\Documents\pyvenv\neurotin\lib\site-packages\mne\viz\_figure.py", line 613, in _get_browser
    browser = backend._init_browser(**kwargs)

  File "C:\Users\Mathieu\Documents\pyvenv\neurotin\lib\site-packages\mne_qt_browser\_pg_figure.py", line 3722, in _init_browser
    browser = PyQtGraphBrowser(**kwargs)

  File "C:\Users\Mathieu\Documents\pyvenv\neurotin\lib\site-packages\mne_qt_browser\_pg_figure.py", line 2184, in __init__
    overview_bar = OverviewBar(self)

  File "C:\Users\Mathieu\Documents\pyvenv\neurotin\lib\site-packages\mne_qt_browser\_pg_figure.py", line 502, in __init__
    self.update_bad_channels()

  File "C:\Users\Mathieu\Documents\pyvenv\neurotin\lib\site-packages\mne_qt_browser\_pg_figure.py", line 529, in update_bad_channels
    pen = mkColor(self.mne.ch_color_bad)

  File "C:\Users\Mathieu\Documents\pyvenv\neurotin\lib\site-packages\pyqtgraph\functions.py", line 293, in mkColor
    raise ValueError(f"Unknown how to convert string {c} to color")

ValueError: Unknown how to convert string lightgray to color
I don't have time to look into it today; if you have time to fix it in a PR, I can test the fix for you on my file/setup if you want.
I don't know if this is only on this machine; and I can't test on others right now; but on this one, the browser opens behind my other windows and I have to minimize each before I can reach the browser. On the contrary, the matplotlib backend does pop up in front, which is way more convenient.
This laptop is an intel MacBook running macOS Big Sur and python 3.8.10.
Now I know that this package doesn't use Matplotlib, but based on years of "common user experience", what I'd expect is that after I've run the magic %matplotlib inline, the mne-qt-browser should be disabled (even if set as the default browse backend), and I should get inline Matplotlib-based figures. Same with %matplotlib widget, only that the figures are interactive then.
Running the latest dev version of mne and mne_qt_browser, I got a bug with annotations. The file used in the video below has some annotations setup and when scrolling I get the following error in the console:
>>> Traceback (most recent call last):
  File "c:\users\mathieu\documents\git\mne-qt-browser\mne_qt_browser\_pg_figure.py", line 3518, in _xrange_changed
    self._update_annotations_xrange(xrange)
  File "c:\users\mathieu\documents\git\mne-qt-browser\mne_qt_browser\_pg_figure.py", line 3570, in _update_annotations_xrange
    self.mne.plt.addItem(region)
  File "C:\Users\Mathieu\Documents\pyvenv\mne\lib\site-packages\pyqtgraph\graphicsItems\PlotItem\PlotItem.py", line 535, in addItem
    self.vb.addItem(item, *args, **vbargs)
  File "C:\Users\Mathieu\Documents\pyvenv\mne\lib\site-packages\pyqtgraph\graphicsItems\ViewBox\ViewBox.py", line 407, in addItem
    if item.zValue() < self.zValue():
RuntimeError: wrapped C/C++ object of type AnnotRegion has been deleted
It occurs when I scroll by selecting the box on the overview, when I cross an annotation edge.
Weirdly enough, if I now close the plotting window and do again in the same console raw.plot(), the new browser works as intended and this bug is not present. And second weird point, this bug is not present if I do the same 3 commands in an IPython console. 😕
Reproducible example with MNE dataset:
import mne
fname = mne.datasets.sample.data_path() / 'MEG' / 'sample' / 'sample_audvis_filt-0-40_raw.fif'
raw = mne.io.read_raw_fif(fname, preload=True)
annotations = mne.Annotations([1, 10, 20, 30], [1, 2, 1, 2], ['a', 'b', 'a', 'b'])
raw.set_annotations(annotations)
raw.plot()
Currently, pressing ESC will exit the browser window. However, when I'm in annotations mode, my intuition is that I'd exit this mode, and only after an additional press of ESC the browser would quit.
The current behavior made me quit the browser several times now by accident…
block is needed!Fixed in #39
When running the following script using IPython (from within the VSCode editor), I cannot execute the final cell (containing the plotting call) twice. Instead, it throws an error (pasted below). Do you have any idea why?
# %%
import mne

from config import get_sourcedata

# %%
# Load and prepare data
vhdr, tsv = get_sourcedata(2, "single")
raw = mne.io.read_raw_brainvision(vhdr, preload=True)

# Set the EOG and ECG channels to their type
raw.set_channel_types({"ECG": "ecg", "HEOG": "eog", "VEOG": "eog"})

# Set a standard montage for plotting later
montage = mne.channels.make_standard_montage("standard_1020")
raw.set_montage(montage)

# Temporarily remove existing annotations for faster interactive plotting
raw.set_annotations(None)

# %%

with mne.viz.use_browser_backend('pyqtgraph'):
    raw.plot(block=True)
Extracting parameters from /run/user/1000/gvfs/sftp:host=XXX,user=XXX/home/XXX/Projects/ARC-Studies/eeg_compression/ecomp_data/sourcedata/sub-02/sub-02_stream-single.vhdr...
Setting channel info structure...
Reading 0 ... 2117319 = 0.000 ... 2117.319 secs...
Using pyqtgraph as 2D backend.
Using pyopengl with version 3.1.5
Channels marked as bad: none
Traceback (most recent call last):
File "01_raw_inspection.py", line 32, in <module>
raw.plot(block=True)
File "/home/stefanappelhoff/miniconda3/envs/ecomp_analysis/lib/python3.8/site-packages/mne/io/base.py", line 1528, in plot
return plot_raw(self, events, duration, start, n_channels, bgcolor,
File "<decorator-gen-174>", line 24, in plot_raw
File "/home/stefanappelhoff/miniconda3/envs/ecomp_analysis/lib/python3.8/site-packages/mne/viz/raw.py", line 367, in plot_raw
fig = _get_browser(**params)
File "/home/stefanappelhoff/miniconda3/envs/ecomp_analysis/lib/python3.8/site-packages/mne/viz/_figure.py", line 613, in _get_browser
browser = backend._init_browser(**kwargs)
File "/home/stefanappelhoff/miniconda3/envs/ecomp_analysis/lib/python3.8/site-packages/mne_qt_browser/_pg_figure.py", line 3727, in _init_browser
browser = PyQtGraphBrowser(**kwargs)
File "/home/stefanappelhoff/miniconda3/envs/ecomp_analysis/lib/python3.8/site-packages/mne_qt_browser/_pg_figure.py", line 2065, in __init__
setattr(self.mne, qvalue)
TypeError: setattr expected 3 arguments, got 2
Hello,
I finally found a bit of time to play with the qt-browser and I ran into a number of things that didn't work as expected, or were too hard for me to understand, or which could be improved.
I'm just gonna dump all my observations into a single issue for now.
@marsipu Let me preface this by saying I'm amazed by the work you've done, it's stunning! And please don't feel discouraged by this long list below. Even with these issues, I'm already much happier with mne-qt-browser than with our Matplotlib-based browser!
I worked with EEG data (ERP CORE) on macOS Monterey. The package was installed from conda-forge.
qt-browser via a VS Code Python Interactive window just to make sure my observation was merely the result of a rare fluke?


 For reference, this is what scroll bars looked like on macOS many many years ago (but you don't see this anymore: these arrows are long gone):
 What does work well for me, and actually preserves precious vertical space, is moving the toolbar to the left side. This would in fact be my preferred location! Proposal: Move toolbar to the left side of the screen.
  File "/Users/hoechenberger/Development/mne-python/mne/viz/utils.py", line 962, in plot_sensors
      raise RuntimeError('No valid channel positions found')
  RuntimeError: No valid channel positions found
debug.printExc("Error sending click event:")qt-browser). Proposal: Catch this exception and display a helpful message in a popup window.Annotations -> Select Visible brings up a modal dialog (good!), but clicking on SSP doesn't, so I sometimes "lose" that tiny window behind my main window (bad!) Proposal: Make SSP popup a modal.SSP should be renamed Projectors or Projections, as an Avg. Reference Projector doesn't really have anything to do with SSP, yet appears there.SSP popup looks like for EEG data without an Avg. Reference Projector set:  Proposal: Display an error message, stating that no projectors are in the data.
 Proposal: Allow for a max. precision of 1 ms.
cc @agramfort
Is there a documentation of what the "zscore" and "channels" overview modes are supposed to do?
I am talking about this panel (currently in zscore mode):

I couldn't find any in https://mne.tools/dev/generated/mne.io.Raw.html?highlight=raw#mne.io.Raw.plot
Coming from a suggestion of @larsoner:
Give users some way to use NumPy memmapping to map the preloaded data array to a file on disk. (This basically gives you an object that is a standard ndarray but instead of living in memory, it lives on disk.) We have this available for raw data already with read_raw_fif(..., preload='some_str_path') for example, so I don't think it would be too difficult to implement.
Hi,
It would be nice if we could add/remove the list of channels that apply to each annotation. I've started playing around with it and it seems a QPushButton would need to be added and then an instance of QDialog appears with QTreeWidget embedded that lists channels. Then the channels would be added/removed by accessing fig.mne.inst.annotations where fig is the instance of the browser. I'm new to Qt but I may be able to assist with this. Let me know your thoughts on this.
MWE:
# %%
import mne


sample_dir = mne.datasets.sample.data_path()
sample_fname = sample_dir / 'MEG' / 'sample' / 'sample_audvis_raw.fif'

raw = mne.io.read_raw_fif(sample_fname)
events = mne.find_events(raw, stim_channel='STI 014')
event_id = {
    'auditory/left': 1, 'auditory/right': 2, 'visual/left': 3,
    'visual/right': 4, 'face': 5, 'buttonpress': 32
}
raw.plot(events=events, event_id=event_id, block=True)
Produces:

The events are not labeled by the event_id mapping.
@agramfort ran into this issue:
mcfletch/pyopengl#55
mcfletch/pyopengl#72
It appears to me PyOpenGL maintenance could be in a better shape … I suppose we could monkey-patch it for now?
Sorry, worst bug report ever, because I don't really know what's going on and I cannot reliably reproduce. But I just encountered this problem and immediately recorded a screencast to capture the issue:
Could it have something to do with the visibility of the Annotations widget box?
So this is what it looks like on macOS, makes my eyes bleed:

on my laptop running this code in IPython terminal or jupyter
from pathlib import Path
import mne


sample_dir = Path(mne.datasets.sample.data_path())
sample_fname = sample_dir / 'MEG' / 'sample' / 'sample_audvis_raw.fif'

raw = mne.io.read_raw_fif(sample_fname, preload=True)
raw.crop(tmax=4)

sfreq = raw.info['sfreq']
first_samp = 0
raw = mne.io.RawArray(raw.get_data(),
                      raw.info,
                      first_samp=first_samp)

raw.plot()
gives a bus error:
In [1]: %run debug_bus_error_qt_browser.py
[1]    14095 bus error  ipython --matplotlib=qt --no-banner
can someone replicate? I don't have any problem without the RawArray creation.
from pathlib import Path

import mne

mne.viz.set_browser_backend('pyqtgraph')


directory = Path(mne.datasets.sample.data_path()) / 'MEG' / 'sample'
fname = directory / 'sample_audvis_filt-0-40_raw.fif'
raw = mne.io.read_raw_fif(fname, preload=True)
raw.plot()
A video will be clearer than my explanation:
The browser completely freezes when I try using annotations; I think this is due to a recent change, it was working fine in earlier versions.
Setup:
Platform:       macOS-11.6-x86_64-i386-64bit
Python:         3.8.12 (default, Oct 13 2021, 06:42:42)  [Clang 13.0.0 (clang-1300.0.29.3)]
Executable:     /Users/scheltie/Documents/pyvenv/mne/bin/python3
CPU:            i386: 12 cores
Memory:         32.0 GB

mne:            1.0.dev0
numpy:          1.20.3 {blas=openblas, lapack=openblas}
scipy:          1.8.0rc1
matplotlib:     3.5.1 {backend=Qt5Agg}

sklearn:        1.0.1
numba:          0.54.1
nibabel:        3.2.1
nilearn:        0.8.1
dipy:           1.4.1
cupy:           Not found
pandas:         1.3.5
pyvista:        0.32.1 {OpenGL 4.1 ATI-4.6.20 via AMD Radeon Pro 555X OpenGL Engine}
pyvistaqt:      0.5.0
ipyvtklink:     0.2.1
vtk:            9.1.0
PyQt5:          5.13.2
ipympl:         Not found
mne_qt_browser: 0.1.8.dev0
pooch:          v1.5.2
Following discussions in #20, the current OverviewBar-modes should be reworked.
MWE:
# %%
import mne

sample_dir = mne.datasets.sample.data_path()
sample_fname = sample_dir / 'MEG' / 'sample' / 'sample_audvis_raw.fif'

raw = mne.io.read_raw_fif(sample_fname)
raw.crop(tmax=60)
raw.plot()
We can see channels are ordered as: grad, mag, eeg:

But in butterfly mode, the order is mag, grad, eeg:

This should be harmonized.
When plotting from an interactive Python session (IPython, Jupyter), the plot window opens and freezes unless one passes block=True, which is mentioned in the docs here but not intuitive for our users. It has to do with the Qt event loop.
In fact, I felt the urge to point out this behavior in a service tweet:
https://twitter.com/mne_news/status/1506938707705802753
There must be a way to make this behavior better and work without freezing the window even if block is not passed. @GuillaumeFavelier achieved something like this with Brain, maybe you could share your wisdom here? 🙏
MWE:
# %%
from pathlib import Path
import mne


sample_dir = Path(mne.datasets.sample.data_path())
sample_fname = sample_dir / 'MEG' / 'sample' / 'sample_audvis_raw.fif'

raw = mne.io.read_raw_fif(sample_fname)
raw.crop(tmax=60)

events = mne.find_events(raw, stim_channel='STI 014')
event_id = {'auditory/left': 1, 'auditory/right': 2, 'visual/left': 3,
            'visual/right': 4, 'face': 5, 'buttonpress': 32}

epochs = mne.Epochs(raw, events=events, event_id=event_id,
                    tmin=-0.2, tmax=0.5, baseline=(None, 0),
                    preload=True)

epochs.plot()This problem does not occur with Raw data when opening the channel location window via a right-click on the channel name.
On MacOS when plotting epochs with multiple colors (bad epochs, bad segments from autoreject) without OpenGL (use_opengl=False), on opening the plot or after scrolling a bit a segmentation error is raised and python quits.

import mne
import os
import numpy as np

import faulthandler
faulthandler.enable()

from mne.viz import use_browser_backend

# Load Raw
sample_data_folder = mne.datasets.sample.data_path()
raw_file = os.path.join(sample_data_folder, 'MEG', 'sample',
                        'sample_audvis_raw.fif')
raw = mne.io.read_raw(raw_file)

# Load Events
events_path = os.path.join(sample_data_folder, 'MEG', 'sample',
                           'sample_audvis_raw-eve.fif')
events = mne.read_events(events_path)

# Add test-annotations
onsets = np.arange(2, 8, 2) + raw.first_time
durations = np.repeat(1, len(onsets))
descriptions = ['Test1', 'Test2', 'Test3']
for onset, duration, description in zip(onsets, durations, descriptions):
    raw.annotations.append(onset, duration, description)

epo = mne.Epochs(raw, events)

epoch_col1 = np.asarray(['b'] * len(epo.ch_names))
epoch_col1[::2] = 'r'
epoch_col2 = np.asarray(['r'] * len(epo.ch_names))
epoch_col2[::2] = 'b'
epoch_col3 = np.asarray(['g'] * len(epo.ch_names))
epoch_col3[::2] = 'b'
epoch_colors = np.asarray([['b'] * len(epo.ch_names) for _ in
                           range(len(epo.events))])
epoch_colors[::3] = epoch_col1
epoch_colors[1::3] = epoch_col2
epoch_colors[2::3] = epoch_col3
epoch_colors = epoch_colors.tolist()

epo.info['bads'].append('MEG 0113')

with use_browser_backend('pyqtgraph'):
    epo.plot(block=True, n_epochs=10, events=events, epoch_colors=epoch_colors,
precompute=False, picks=epo.ch_names, use_opengl=True)multiple colors:
For multiple colors additional instances of DataTrace are created. They are equally added to the main plot, just the methods differ depending on wether the trace is a child- or a parent-trace.
MacOS
Why does this bug only appear on MacOS, but not on Ubuntu and Windows?
Data
The multiple colored traces of one channel access the same data-array, BUT the array is copied with np.copy and it is accessed the same way for openGL=True which works.
Platform: macOS-10.15.4-x86_64-i386-64bit
Python: 3.9.10 | packaged by conda-forge | (main, Feb 1 2022, 21:28:27) [Clang 11.1.0 ]
Executable: /Users/martinschulz/opt/anaconda3/envs/mnedev/bin/python3.9
CPU: i386: 8 cores
Memory: 16.0 GB
mne: 1.0.dev0
numpy: 1.22.2 {blas=NO_ATLAS_INFO, lapack=lapack}
scipy: 1.8.0
matplotlib: 3.5.1 {backend=MacOSX}
sklearn: 1.0.2
numba: 0.53.1
nibabel: 3.2.2
nilearn: 0.9.0
dipy: 1.4.1
cupy: Not found
pandas: 1.4.1
pyvista: 0.33.2 {OpenGL 4.1 INTEL-14.5.22 via Intel(R) Iris(TM) Plus Graphics 655}
pyvistaqt: 0.7.0
ipyvtklink: 0.2.2
vtk: 9.0.3
PyQt5: 5.12.3
ipympl: Not found
pooch: v1.6.0
mne_bids: 0.10.dev0
mne_nirs: Not found
mne_features: Not found
mne_qt_browser: 0.2.0
mne_connectivity:0.3dev0
Here are the steps to reproduce:
import os
import numpy as np
import mne

sample_data_folder = mne.datasets.sample.data_path()
sample_data_raw_file = os.path.join(sample_data_folder, 'MEG', 'sample',
                                    'sample_audvis_filt-0-40_raw.fif')
raw = mne.io.read_raw_fif(sample_data_raw_file)
fig = raw.plot()

report = mne.Report()
report.add_figure(fig, 'figure')
and this gives me:
---------------------------------------------------------------------------
TypeError                                 Traceback (most recent call last)
<ipython-input-4-99e4b2a4dd84> in <module>
----> 1 rep.add_figure(fig, 'blah')

~/Documents/github_repos/mne-python/mne/report/report.py in add_figure(***failed resolving arguments***)
   1986         assert figs
   1987         if len(figs) == 1:
-> 1988             img = _fig_to_img(fig=figs[0], image_format=image_format,
   1989                               own_figure=False)
   1990             dom_id = self._get_dom_id()

~/Documents/github_repos/mne-python/mne/report/report.py in _fig_to_img(fig, image_format, own_figure)
    334     import matplotlib.pyplot as plt
    335     from matplotlib.figure import Figure
--> 336     _validate_type(fig, (np.ndarray, Figure, Figure3D), 'fig')
    337     if isinstance(fig, np.ndarray):
    338         # In this case, we are creating the fig, so we might as well

~/Documents/github_repos/mne-python/mne/utils/check.py in _validate_type(item, types, item_name, type_name)
    500                 type_name = ', '.join(type_name)
    501         _item_name = 'Item' if item_name is None else item_name
--> 502         raise TypeError(f"{_item_name} must be an instance of {type_name}, "
    503                         f"got {type(item)} instead.")
    504

TypeError: fig must be an instance of ndarray, Figure, or Figure3D, got <class 'mne_qt_browser._pg_figure.PyQtGraphBrowser'> instead.
I'm reporting this as a bug as this used to work in the matplotlib-based browser and something I'd consider an essential feature ...
This is mentioned in #85.
It seems like the functionality of this sensitivity slider is very similar to what the user might achieve by widening the time window shown in the browser.
Is this the correct behavior?
Please, feel free to close this issue if in fact the sensitivity slider has the correct behavior.
A declarative, efficient, and flexible JavaScript library for building user interfaces.
🖖 Vue.js is a progressive, incrementally-adoptable JavaScript framework for building UI on the web.
TypeScript is a superset of JavaScript that compiles to clean JavaScript output.
An Open Source Machine Learning Framework for Everyone
The Web framework for perfectionists with deadlines.
A PHP framework for web artisans
Bring data to life with SVG, Canvas and HTML. 📊📈🎉
JavaScript (JS) is a lightweight interpreted programming language with first-class functions.
Some thing interesting about web. New door for the world.
A server is a program made to process requests and deliver data to clients.
Machine learning is a way of modeling and interpreting data that allows a piece of software to respond intelligently.
Some thing interesting about visualization, use data art
Some thing interesting about game, make everyone happy.
We are working to build community through open source technology. NB: members must have two-factor auth.
Open source projects and samples from Microsoft.
Google ❤️ Open Source for everyone.
Alibaba Open Source for everyone
Data-Driven Documents codes.
China tencent open source team.