Coder Social home page Coder Social logo

mindrones / timely-dependency-graph Goto Github PK

View Code? Open in Web Editor NEW
48.0 4.0 3.0 1.92 MB

Temporal Dependency Graph

License: GNU General Public License v3.0

JavaScript 65.83% HTML 16.05% CSS 18.12%
dependency-graphs d3js data-visualization temporal-networks foo

timely-dependency-graph's Introduction

As of today, this script create dependency graphs of D3 modules, for d3 version 4+. In the future it might support generic npm modules.

Focusing on a certain release of a d3 module, you can visualize its dependencies tree and the modules that depends on the focused release.

Example: focusing on d3-axis

Usage

Quick usage

Interaction

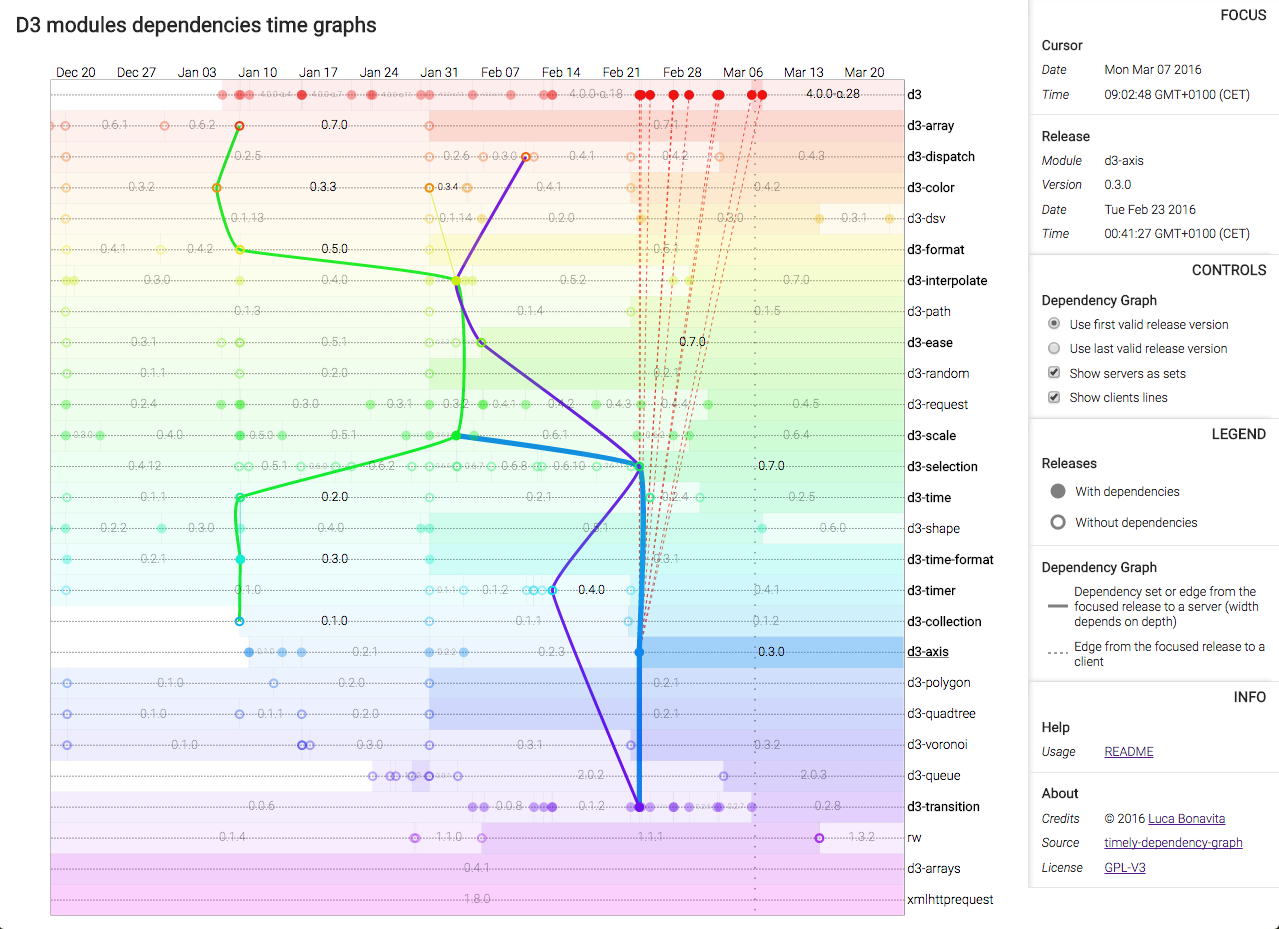
  • With the mouse, hover the release rectangles to show their dependencies graph
  • click on a release: pin/unpin it (then you can change how to display the dependencies graph using sidebar's controls)
  • mouse wheel: zoom in and out
  • mouse drag: pan left-right

UI terminology

  • server: a module the focused release depends on
  • client: a module depending on the hovered release

(this will most certainly change in the future)

Sidebar

FOCUS panel

Shows:

  • the cursor date and time
  • the hovered release name, version, date and time

CONTROLS panel

  • Choose how you want to inspect dependencies release date.

    For example, d3-shape version 0.6.0 depends on d3-path version ~0.1.3. In semver lingo this is a version range meaning >=0.1.3 <0.2.0, hence as of now:

    • the first valid version of d3-path as a dependency of d3-shape 0.6.0 is 0.1.3;
    • the last valid version of d3-path as a dependency of d3-shape 0.6.0 is 0.1.5.

    First and last valid dependency version

  • Choose how to visualize "servers" (dependencies):

    • as "sets" (lines passing through the focused release and all servers);
    • as links between each server and the focused release.

    Show dependencies as sets or links

    Note that dependencies graph is a tree (because dependencies have their own dependencies):

    • since a set is basically a subtree, the color of a set is the color of the module originating that subtree;
    • links, instead, gets the color of the dependency.
  • Choose if you want to see "client lines", links between the focused release and its clients.

    Show or hide clients

LEGEND panel

Shows graphs elements representation associated with their meaning. Well, it's a legend :)

To run it locally

Install dependencies:

  • [optional] install node and npm on your system
  • cd <your work directory>
  • clone [email protected]:mindrones/timely-dependency-graph.git
  • cd timely-dependency-graph
  • npm install

Run:

timely-dependency-graph's People

Contributors

mindrones avatar

Stargazers

 avatar  avatar  avatar  avatar  avatar  avatar  avatar  avatar  avatar  avatar  avatar  avatar  avatar  avatar  avatar  avatar  avatar  avatar  avatar  avatar  avatar  avatar  avatar  avatar  avatar  avatar  avatar  avatar  avatar  avatar  avatar  avatar  avatar  avatar  avatar  avatar  avatar  avatar  avatar  avatar  avatar  avatar  avatar  avatar  avatar  avatar  avatar  avatar

Watchers

 avatar  avatar  avatar  avatar

timely-dependency-graph's Issues

Better support for releases not sorted by time

For example in d3-queue.json you can see that releases are not sorted by time:

  ...
  "time": {
    "modified": "2016-03-03T17:18:21.214Z",
    "created": "2016-01-23T05:00:32.836Z",
    "1.2.0": "2016-01-23T05:00:32.836Z",
    "1.2.1": "2016-01-25T05:38:16.791Z",
    "1.2.2": "2016-01-25T21:20:04.839Z",
    "2.0.0": "2016-01-27T18:12:57.616Z",
    "1.2.3": "2016-01-29T17:28:25.517Z",
    "2.0.1": "2016-01-29T17:35:39.783Z",
    "2.0.2": "2016-02-02T01:09:47.285Z",
    "2.0.3": "2016-03-03T17:18:21.214Z"
  },
  ...

Loader strategy

If the dependency chain is very long, fetching all modules data can take a lot of time.

We can:

  • simply add a loader and draw when done fetching them all,
  • redraw at each fetched module,
  • stop fetching at depth 1 or 2,
  • or?

Modules sorting

Right now modules order depends on the fetching order, hence connected releases can be distant from each others in the chart.

Implement one or more sorting strategy:

  • based on modules "distance"
  • based on focused release "distance" with servers (dependency releases) and clients (dependent releases)
  • alphabetical
  • date of module creation?
  • else?

Choose a solution to show a long list of modules

If the dependency chain is very log, simply forcing all modules to fit in the screen will make release versions unreadable or even hidden if they are too small.
Also, colors of adjacent modules would be too similar.

Choose a good solution:

  • add scroll,
  • color only modules in the current depgraph?
  • ?

Support generic npm modules

  • support all types of version range (#1)
  • support releases not sorted by time (#3)
  • implement a loader strategy (#4)
  • choose a solution to show a long list of modules (#5)
  • add a router to detect module name (#6)

Better semver ranges support

As of version 1.0.0 it only supports ranges in the form ~1.2.3 as it seems to be the only kind of range used in d3 modules.

For example, if instead of

var MODULE_NAME = 'd3'

we use

var MODULE_NAME = 'backbone'

we get an error when processing a range like >=1.1.2 which I'm not supporting at the moment.

Recommend Projects

  • React photo React

    A declarative, efficient, and flexible JavaScript library for building user interfaces.

  • Vue.js photo Vue.js

    ๐Ÿ–– Vue.js is a progressive, incrementally-adoptable JavaScript framework for building UI on the web.

  • Typescript photo Typescript

    TypeScript is a superset of JavaScript that compiles to clean JavaScript output.

  • TensorFlow photo TensorFlow

    An Open Source Machine Learning Framework for Everyone

  • Django photo Django

    The Web framework for perfectionists with deadlines.

  • D3 photo D3

    Bring data to life with SVG, Canvas and HTML. ๐Ÿ“Š๐Ÿ“ˆ๐ŸŽ‰

Recommend Topics

  • javascript

    JavaScript (JS) is a lightweight interpreted programming language with first-class functions.

  • web

    Some thing interesting about web. New door for the world.

  • server

    A server is a program made to process requests and deliver data to clients.

  • Machine learning

    Machine learning is a way of modeling and interpreting data that allows a piece of software to respond intelligently.

  • Game

    Some thing interesting about game, make everyone happy.

Recommend Org

  • Facebook photo Facebook

    We are working to build community through open source technology. NB: members must have two-factor auth.

  • Microsoft photo Microsoft

    Open source projects and samples from Microsoft.

  • Google photo Google

    Google โค๏ธ Open Source for everyone.

  • D3 photo D3

    Data-Driven Documents codes.