Coder Social home page Coder Social logo

azuremonitorcommunity's Introduction

Azure Monitor Community

License

This public repo serves the Azure Monitor community. It contains log queries, workbooks, and alerts, shared to help Azure Monitor users make the most of it.

Contents

Queries - copy and paste queries to your Log Analytics environment, or run on the Log Analytics Demo Environment

Workbooks - the workbooks in this repo can be deployed as ARM templates to your Azure Monitor environment

Alerts - the alerts in this repo are log-based, meaning they are in fact log queries. You can run them on the Log Analytics Demo Environment or use them to create and test alerts on your own environment

Contributing

Anyone can contribute to the repo, you don't need to be a pro. Have an interesting query or workbook? fork this repo, add your content to your fork and submit a pull request. See Contributing for more details.

Top Contributor

The October top contributor is Avatar Bruno Gabrielli (Brunoga-MS). Thanks Bruno!

What's new this month?

Great workbooks were added, such as AntiMalware Assessment and Azure Inventory (based on Azure Resource Graph), as well as a lot of new queries for many Azure services. For more details see our Wiki.

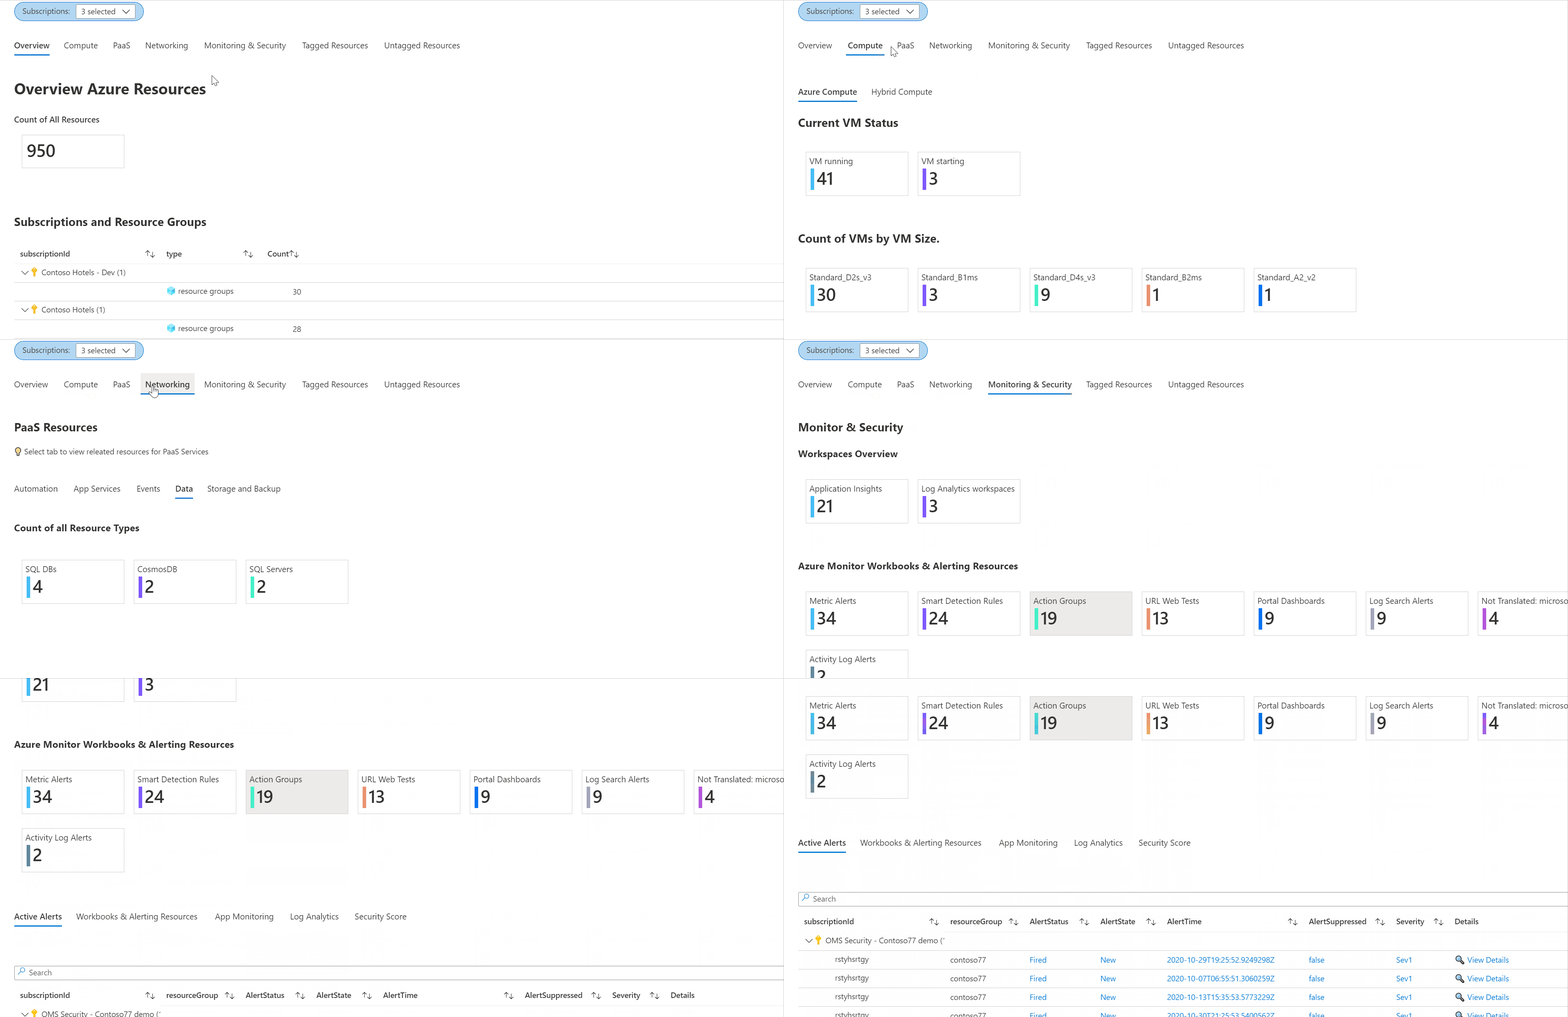
Check out the Azure Inventory workbook (based on Azure Resource Graph)

Azure Inventory with Azure Resource Graph


and the AntiMalware Assessment workbook

Malware Assessment

Top asks

Here are some ideas on what other users are looking for.

Structure

File/folder Description
Azure services Queries, workbooks and alerts for specific Azure services
Scenarios Queries, workbooks and alerts to handle common "How to's
Solutions Queries, workbooks and alerts organized by solutions
CONTRIBUTING.md On how to contribute to this repo
LICENSE The license for this repo
README.md This README file

We use KQL

The content in this repo uses KQL (Kusto Query Language). To get started with queries see this article.

Need help writing queries?

This repo has many examples that you may want to edit to fit your exact scenario. If you're not sure how to do that - post your question on our community forum.

Have a wish or a question?

Use Issues to call us out on missing content or something else we should improve on, and check out the FAQ page for common questions & answers.

Redistribution

Upon redistribution of this repo, please be respectful of the readers and authors of this documentation, and include a link to the original repo master branch.

azuremonitorcommunity's People

Contributors

afstonebharfon avatar aliyoussefi avatar ankychow avatar aravindsundaram avatar arvindharinder1 avatar brunoga-ms avatar chupark avatar clivew-msft avatar cyrille-visser avatar ehrnst avatar eiurbach avatar elanshudnow avatar helderpinto avatar lb4368 avatar lukeorellana avatar martinpankraz avatar microsoftopensource avatar mortenlerudjordet avatar murtazakhambaty avatar noakup avatar pantalones411 avatar rcarboneras avatar seanluce avatar shayoniseth avatar shijatsu avatar slavizh avatar vanessabruwer avatar vpidatala94 avatar wernerrall147 avatar wkahnza avatar

Stargazers

 avatar  avatar  avatar  avatar  avatar  avatar  avatar  avatar  avatar  avatar  avatar  avatar  avatar  avatar  avatar  avatar  avatar  avatar  avatar  avatar  avatar  avatar  avatar  avatar  avatar  avatar  avatar  avatar  avatar  avatar  avatar  avatar  avatar  avatar  avatar  avatar  avatar  avatar  avatar  avatar  avatar  avatar  avatar  avatar  avatar  avatar  avatar  avatar  avatar  avatar  avatar  avatar  avatar  avatar  avatar  avatar  avatar  avatar  avatar  avatar  avatar  avatar  avatar  avatar  avatar  avatar  avatar  avatar  avatar  avatar  avatar  avatar  avatar  avatar  avatar  avatar  avatar  avatar  avatar  avatar  avatar  avatar  avatar  avatar  avatar  avatar  avatar  avatar  avatar  avatar  avatar  avatar  avatar  avatar  avatar  avatar  avatar  avatar  avatar  avatar

Watchers

 avatar  avatar  avatar  avatar  avatar  avatar  avatar  avatar  avatar  avatar  avatar  avatar  avatar  avatar  avatar  avatar  avatar  avatar  avatar  avatar  avatar  avatar  avatar  avatar  avatar  avatar  avatar  avatar  avatar  avatar  avatar  avatar  avatar  avatar  avatar  avatar  avatar  avatar  avatar  avatar  avatar  avatar  avatar  avatar  avatar  avatar  avatar  avatar  avatar  avatar  avatar  avatar  avatar  avatar  avatar  avatar  avatar  avatar  avatar  avatar  avatar  avatar  avatar  avatar  avatar  avatar  avatar  avatar  avatar  avatar  avatar  avatar  avatar  avatar  avatar  avatar  avatar  avatar  avatar  avatar  avatar  avatar  avatar

azuremonitorcommunity's Issues

Shared ALZ logs cost - query that runs too long

In a shared Azure Landing Zone infrastructure, we are running a dozen or so SW applications, and we must report the cost of LAW ingestion of all the Azure resources allocated to each application (we call them "Outcomes") in this environment. We built a workbook and in it fashioned some queries, one of them "by outcome" and it takes a loooooong time to complete (I have never seen it complete) based on several TiB of data ingested over the last 30 days.

Screenshot_Outcome_query_edit1
Screenshot_Outcome_query_runs

The Kusto Query

Parameter Query :- (Scoped to Subscription)

ResourceContainers
| where type=='microsoft.resources/subscriptions/resourcegroups'
| extend Tag = todynamic(tags)
| extend TeamName = Tag["TEAM NAME"]
| where isnotempty(TeamName)
| project Owner = strcat("'",name,'#',tostring(TeamName),"'")

Actual Query :- (Scoped to Log Analytics Workspace)

let OutcomeTable = datatable(ResourceGroupOwner:string) {ResourceGroupOwnerList};
find where TimeGenerated {TimeRange:value} project _ResourceId, _BilledSize, _IsBillable, TimeGenerated
| where _IsBillable == true
| extend ResourceGroup = case(isempty(_ResourceId),"Infrastructure",tostring(split(_ResourceId, '/')[4]))
| where isnotempty(ResourceGroup)
| summarize IngestedData = sum(_BilledSize) by ResourceGroup
| join kind=leftouter (OutcomeTable | extend ResourceGroup = tostring(split(ResourceGroupOwner,'#')[0]), Owner = tostring(split(ResourceGroupOwner,'#')[1]) | project ResourceGroup, Owner) on ResourceGroup
| project Owner = case(isempty(Owner),ResourceGroup,Owner), IngestedData
| summarize sum(IngestedData) by Owner

Azure Monitor - InsightsMetrics - populate custom tag, or pod name

Azure Monitor - InsightsMetrics

Hello,

We need some way to filter metrics scraped from our services in Azure Kubernetes that are injected into InsightsMetrics.
It seems that labels/annotations from pods are droped, we did not find a way to populate pod name with metrics...

How should we plot a graph of requests per second per pod, in Azure Monitor, if we cannot filter out by a pod?

https://learn.microsoft.com/en-us/azure/azure-monitor/essentials/prometheus-metrics-scrape-configuration
Azure/iotedge#6141

Example record from InsightsMetrics
12/3/2022, 10:32:00.000 AM aks-default-12500777-vmss000000 container.azm.ms/telegraf prometheus keycloak_response_errors 3 {"code":"500","container.azm.ms/clusterId":"/subscriptions/xxxxxx-5fa9-493e-9256-xxxxxx/resourceGroups/RG-dev/providers/Microsoft.ContainerService/managedClusters/aks-dev","container.azm.ms/clusterName":"aks-dev","hostName":"aks-default-12500777-vmss000000","method":"GET","resource":"realms,realms/center/protocol/openid-connect","scrapeUrl":"https://identity.dev.net/realms/center/metrics"} xxxxxx-9e53-4d70-9df1-xxxxxxxxxx

image

UI bug when rendering azure metrics workbook

Case 1:
image

Case 2:
image

The above graphs are depicting amount of data being ingested by data collection rules in Azure metrics workbook.

Bug is clear from case 1, where graph is incorrectly rendering count as 888 instead of being close to 0.
Whereas in case 2, graph shows 91 as expected when user hovers on a peak.

Disable Alerts after 7 days?

I have a question related to behaviour as seen below.

We deploy about 300 alerts for our customers which are mostly based upon log searches.

I gave read that when an alert rule is failing for 7 days it gets disabled automatically.

As I understood the documentation this also happens when the syntax of the query is ok but if the table/column does not yet exist in log analytics.

Since we bootstrap our environments with all these alerts it could obviously be that a customer will not deploy all the resources that have an alert within a 7 day period. It could take months for somebody to actually deploy an AKS cluster for example.

Is the "7 day disable automation by MS" applicable to:

  • v1 and v2 alert rules

Is there a way to prevent this from happening?

Did I understand the mechanism correctly?

"alert 123 is disabled by the System due to : Alert has been failing consistently with the same exception for the past week"

[Help Wanted] Hide all example queries

As I'm not finding any docs on this, and this seems to be the right place to ask this question:
What do I have to do to permanently hide all example queries from my logs analytics workspace?
They tend to clutter the UI and make it harder to find the desired queries.

Deduplicating Alerts

Hi team, currently I have this setup:

  • Prometheus rule group with scope of Azure Monitor Workspace
  • The rules in the rule group have an action group associated, which will call a HTTP based slack webhook to send alerts

What I'm trying to achieve:

  • When the condition is met for a certain rule, I expected the alert to fire once and subsequent evaluations to the rule to either do nothing or update to the existing alert

Current reality of my setup:

  • When the condition is met for a certain rule, new alerts will keep firing on each subsequent evluation of the rule

I've tried looking for configuration that will help me achieve the desired behavior but with no luck.
So far I've tried:

  • Setting the evaluation interval to a higher value, but this only delays the alert firing, not deduplicate it
  • Processing rule to supress alerts, but it seems to only supress by time of day etc, not deduplicate

Is there a config that I'm not aware of or is this a mechanism not yet implemented in Azure Monitor?

How to get the Node Level CPU and Memory Metrics of each pod using KQL Query in Log Analytics Workspace?

I have tried below kql queries but its not giving the CPU and Memory Metrics of the node described along with the pod details.a

ContainerInventory

| where Computer contains "aks-nodepool1-pvmss000002"

Perf

| where Computer contains "aks-agentpool-vmss000003"

KubeNodeInventory

| where Computer contains "aks-agentpool-vmss000003"

InsightsMetrics

| where Computer contains "aks-agentpool-vmss000003"

but do we have the kubectl queries to get the CPU and Memory Metrics of each nodes- kubectl describe node aks-agentpool-vmss000003

Get-AzContext error when running WorkspaceConfigToDCRMigrationTool.ps1 script

Hi,

I get the following error when I run the script on Powershell 7.3.4:

Get-AzContext : The term 'Get-AzContext' is not recognized as the name of a cmdlet, function, script file, or operable
program. Check the spelling of the name, or if a path was included, verify that the path is correct and try again.
At C:\Temp\WorkspaceConfigToDCRMigrationTool.ps1:664 char:18

  • $azContext = Get-AzContext
    
  •              ~~~~~~~~~~~~~
    
    • CategoryInfo : ObjectNotFound: (Get-AzContext:String) [], CommandNotFoundException
    • FullyQualifiedErrorId : CommandNotFoundException

Module Az.Accounts is installed on version 2.12.3 and I run powershell as administrator.

Any ideas?

Best regards,

DJITS

Health Reports for VM's

Hi All , Iam very new to AzureMonitor Community One of Customer is asking Can we able to trigger an email alert of daily/Monthly Health reports of their VM's

Need your Suggestions please its not an issue :)

Thanks
Dhishyanth

data collector does not understand data type.

I don't know where I can post this issue so that posting issue here,

I have write own logger into asp.net to log into log analytics.
There try to implement distributed tracing with help of activity class which is provided by asp.net core framework,

Issue is that when we are log TraceId into log as string , it's automatic consider as GUID and append dashes(-). so that we are not able to compare actual TraceId and logged TraceId.

here problem is Data Collector API does not understand proper data type.

fea47d6e-5871-c742-a07c-5073e8a7886c (logged TraceId)
fea47d6e5871c742a07c5073e8a7886c (original TraceId)

Data_Collector

MMA Extension Is Not Provisioned Correctly and Running Troubleshooting Tool Doesn't Help

I ran SQL best practices assessment for SQL virtual machine and got this failure:
image

Then I went through these troubleshooting steps and everything looks fine:
https://learn.microsoft.com/en-us/azure/azure-monitor/visualize/vmext-troubleshoot?WT.mc_id=Portal-SqlAzureExtension#troubleshoot-the-azure-windows-vm-extension

Next, I followed these steps and chose "The agent extension deployment is failing" scenario:
https://learn.microsoft.com/en-us/azure/azure-monitor/agents/agent-windows-troubleshoot?WT.mc_id=Portal-SqlAzureExtension&tabs=UpdateMMA#use-the-troubleshooting-tool

And I got this log:
tool.log

Then I ran the SQL best practices assessment again but still got the same error. Can you please help me to solve this problem? Many thanks!

appInsights inner join with request and any other table like pageViews

I am flummoxed by the results of this query always being empty

let requestList = requests | where timestamp >= ago(30m)
| distinct operation_Id;
pageViews  | where timestamp >= ago(30m)
| join kind=inner requestList on operation_Id;

Has there been a change recently in the use of operation_Id ?

Traffic analytics

Can we have workbook or any kql for network traffic analytics, we tried something but i can't able to get like x-axis for time and y-axis for ingress and egress traffic. I need this on dashboard

Can Azure Monitor be used to track changes to database entities?

I created Audit Trail in my database by overriding EF Core SaveChanges and SaveChangesAsync methods and storing if entity was Added, Removed, Edited, what columns where edited and what user did it.

However, I became aware of Azure Monitor, but I cannot find information is it possible to track changes made to records stored in selected errors using Azure Monitor instead of what I've done?

IntegrationRuntimeAvailableMemory must be AVG

Based in the manual this metric must be AVG Link

image

AzureMetrics   
| where ResourceProvider == 'MICROSOFT.DATAFACTORY'
| where Resource == 'xxx'
| where MetricName  ==  'IntegrationRuntimeAvailableMemory' 
| project TimeGenerated, Average
| order by TimeGenerated asc
| render timechart

But I suspect that is not true:
image

Sending huge amount of custom logs to Azure Monitor via Data Collector API causes duplicates

I have a function app which collects custom logs from one source and sends them to Azure Monitor using the following code example. The function app runs each hour and sends about 100k rows of log.

Whenever I test the function app locally, it sends the exact amount of log rows, for example 100,000, but when I publish my function app, for some reason it shows in Azure that the number of rows received is slightly more than the original (e.g. 100,050).

What could be the possible reason?

Issue with a Log Analytics Data Cap Breach Alert

I am trying to setup a scheduled query alert from the AKS-Construction repo, and have run into some odd behavior. Apparently, the alert can be setup from the AKS-Construction templates, but not from a standalone deployment. I am trying to move the alert into my logging templates as it isn't really AKS related.

Azure/AKS-Construction#559

resource Daily_data_cap_breached_for_workspace_logworkspacename_CIQ_1 'microsoft.insights/scheduledqueryrules@2022-06-15' = {
  name: 'Daily data cap breached for workspace ${resLogAnalyticsWorkspace.name} CIQ-1'
  location: parAutomationAccountLocation
  properties: {
    displayName: 'Daily data cap breached for workspace ${resLogAnalyticsWorkspace.name} CIQ-1'
    description: 'This alert monitors daily data cap defined on a workspace and fires when the daily data cap is breached.'
    severity: 1
    enabled: metricAlertsEnabled
    evaluationFrequency: evalFrequency
    scopes: [
      resLogAnalyticsWorkspace.id
    ]
    windowSize: windowSize
    autoMitigate: false
    criteria: {
      allOf: [
        {
          query: '_LogOperation | where Operation == "Data collection Status" | where Detail contains "OverQuota"'
          timeAggregation: 'Count'
          operator: 'GreaterThan'
          threshold: 0
          failingPeriods: {
            numberOfEvaluationPeriods: 1
            minFailingPeriodsToAlert: 1
          }
        }
      ]
    }
    muteActionsDuration: 'P1D'
  }
}

throws the following exception from a standalone bicep deployment

{
    "status": "Failed",
    "error": {
        "code": "BadRequest",
        "message": "Couldn't optimize the query because it doesn't contain the table Operation explicitly. Please add the table to the query explicitly and try again"
    }
}

Query to get CustomMetrics in an app returns empty result. Using APIKey for authentication.

I'm trying to access AppInsights data, for now trying through a console app, using APIKey for authentication.
Surprisingly, I get empty result as response. Same query returns expected result when run in Azure portal.
Please help me understand what I am missing here.

Code:

public async Task<IList<IDictionary<string, string>>> ReadAsync(string applicationId, string apiKey)
        {
            ApiKeyClientCredentials credentials = new ApiKeyClientCredentials(apiKey);
            using ApplicationInsightsDataClient client = new ApplicationInsightsDataClient(credentials);
            client.AppId = applicationId;
            string query = "customMetrics | take 1";
            HttpOperationResponse<QueryResults> queryWithHttpMessagesAsync = await client.QueryWithHttpMessagesAsync(query);
            QueryResults result = queryWithHttpMessagesAsync.Body;
            IList<IDictionary<string, string>> resultsDictionary = result.Results.ToList();

            return resultsDictionary;
        }

image

Vital Signs Workbook

The workbook works w/o issue with no modifications against workspaces whose VMs are connected with the legacy agent. However, any special considerations for VMs using the newer AMA?

Correlation/concurrency issues with `UseAzureMonitor` & `WebApplicationFactory<T>`.

I was directed by @tarekgh here to create an issue in this repository, so here I am ๐Ÿ‘‹

There are more details in the issue linked (dotnet/runtime#98854), but the gist of it is this: Adding UseAzureMonitor causes my integration tests to "blow up"; It's causing some immense concurrency and/or correlation issues.

Without UseAzureMonitor I have no concurrency and/or correlation issues (Only some inconsistencies in the name of the activity, which is a different issue entirely I reckon, not related to Azure).

With UseAzureMonitor however there is something happening (be that concurrency or correlation - I don't know) that's causing my integration tests to fail when running them in parallel, but work fine when I'm running them sequentially.

Later in the thread I did find a partial workaround (With its own set of problems), but the general issue stands; Something fishy is going on with UseAzureMonitor.

In case the issue over on dotnet drops or I do a lot of changes to the repro during research, here's a direct link to the GitHub repo before adding the partial workaround: https://github.com/KennethHoff/Repros/tree/b25106f575ee5c782f99dfcfe89b5fc6eb53a900/ActivityTesting

How can we separately monitor two databases in a single Azure Cache for Redis Instance?

I have gone through the Azure Monitor Docs and also played around on their website, but what I have only found out is that we can monitor a particular resource, i.e. if I create a Azure Cache for Redis instance that I can only monitor what happens in that instance, but since one instance has the capability of creating 16 different logical databases, is it possible to separately monitor those databases accordingly, and find out if how much resource is each of the database using in that single redis instance?

Creating log profile with storage account transient error

AZ_VERSION

{
  "azure-cli": "2.32.0",
  "azure-cli-core": "2.32.0",
  "azure-cli-telemetry": "1.0.6",
  "extensions": {
    "log-analytics": "0.2.2",
    "log-analytics-solution": "0.1.1"
  }
}

Linking log profiles to storage account, tried through various methods. Results in the same error message.
"code":"StorageAccountNotAccessible"

STORAGEACCOUNT_ID=$(az storage account show --resource-group <rg-name> --name <storage-account>  --query id -o tsv)
az monitor log-profiles create \                                                                                                                                    6s 
  --name <log-profile-name> --categories "Delete" "Write" "Action" --days 30 --enabled true \
  --storage-account-id $STORAGEACCOUNT_ID --location $LOCATION --locations $LOCATIONS 

ERROR:

cli.azure.cli.core.sdk.policies: {"code":"StorageAccountNotAccessible","message":"There is a transient issue accessing the provided storage account. Please try again."}
cli.azure.cli.core.util: azure.cli.core.util.handle_exception is called with an exception:
cli.azure.cli.core.util: Traceback (most recent call last):
  File "/opt/azure-cli/lib/python3.10/site-packages/knack/cli.py", line 231, in invoke
    cmd_result = self.invocation.execute(args)
  File "/opt/azure-cli/lib/python3.10/site-packages/azure/cli/core/commands/__init__.py", line 658, in execute
    raise ex
  File "/opt/azure-cli/lib/python3.10/site-packages/azure/cli/core/commands/__init__.py", line 721, in _run_jobs_serially
    results.append(self._run_job(expanded_arg, cmd_copy))
  File "/opt/azure-cli/lib/python3.10/site-packages/azure/cli/core/commands/__init__.py", line 713, in _run_job
    return cmd_copy.exception_handler(ex)
  File "/opt/azure-cli/lib/python3.10/site-packages/azure/cli/command_modules/monitor/_exception_handler.py", line 23, in exception_handler
    raise ex
  File "/opt/azure-cli/lib/python3.10/site-packages/azure/cli/core/commands/__init__.py", line 692, in _run_job
    result = cmd_copy(params)
  File "/opt/azure-cli/lib/python3.10/site-packages/azure/cli/core/commands/__init__.py", line 328, in __call__
    return self.handler(*args, **kwargs)
  File "/opt/azure-cli/lib/python3.10/site-packages/azure/cli/core/commands/command_operation.py", line 121, in handler
    return op(**command_args)
  File "/opt/azure-cli/lib/python3.10/site-packages/azure/cli/command_modules/monitor/operations/log_profiles.py", line 14, in create_log_profile_operations
    return client.create_or_update(log_profile_name=name, parameters=parameters)
  File "/opt/azure-cli/lib/python3.10/site-packages/azure/mgmt/monitor/v2016_03_01/operations/_log_profiles_operations.py", line 206, in create_or_update
    map_error(status_code=response.status_code, response=response, error_map=error_map)
  File "/opt/azure-cli/lib/python3.10/site-packages/azure/core/exceptions.py", line 105, in map_error
    raise error
azure.core.exceptions.ResourceExistsError: (StorageAccountNotAccessible) There is a transient issue accessing the provided storage account. Please try again.
Code: StorageAccountNotAccessible
Message: There is a transient issue accessing the provided storage account. Please try again.

cli.azure.cli.core.azclierror: (StorageAccountNotAccessible) There is a transient issue accessing the provided storage account. Please try again.
Code: StorageAccountNotAccessible
Message: There is a transient issue accessing the provided storage account. Please try again.
az_command_data_logger: (StorageAccountNotAccessible) There is a transient issue accessing the provided storage account. Please try again.
Code: StorageAccountNotAccessible
Message: There is a transient issue accessing the provided storage account. Please try again.

Also tried through rest

az rest -m PUT --uri "https://management.azure.com/subscriptions/<sub-id>/providers/Microsoft.Insights/logprofiles/<profile-name>?api-version=2016-03-01" --body '{"location":"<location>","properties":{"locations":["global","<location>"],"categories":["Write","Delete","Action"],"retentionPolicy":{"enabled":true,"days":3},"storageAccountId":"<storage-account-resource-id>"}}' --headers "Content-Type=application/json"

Results are all the same.
Tried with different SKU's deleting and recreating the storage account, different service principals, my account which is Contributor, always results in the same error.

Your help would be appreciated.

Query process id duration with sequence_detect

I need a query about the duration of computer processes. After the process has terminated, the system can reuse the Id. With the sequence_detect query sample below the start / exit sequence of the two processes with the reused id 1 is not correct detected. How can I query the correct durations?

let Table1 = datatable (Time:datetime, ProcId:int, Action:string)
[
datetime(2020-06-01 8:00), 0, "Start",
datetime(2020-06-01 8:01), 1, "Start",
datetime(2020-06-01 8:02), 1, "Exit",
datetime(2020-06-01 8:03), 2, "Start",
datetime(2020-06-01 8:04), 2, "Exit",
datetime(2020-06-01 8:05), 1, "Start",
datetime(2020-06-01 8:06), 1, "Exit",
datetime(2020-06-01 8:10), 0, "Exit",
];
Table1 | evaluate sequence_detect(Time, 1d, 1d, Start = Action == "Start", Stop = Action == "Exit", ProcId)
ProcId | Start_Time | Stop_Time | Duration
1 | 2020-06-01T08:01:00Z | 2020-06-01T08:06:00Z | 00:05:00
2 | 2020-06-01T08:03:00Z | 2020-06-01T08:04:00Z | 00:01:00
0 | 2020-06-01T08:00:00Z | 2020-06-01T08:10:00Z | 00:10:00

Can we add CODEOWNERS file to define individuals or teams that are responsible for code in the repo/subdirectories?

Hello,

We are planning to put workbooks and alerts ARM templates that we are building for Azure Operator Distributed Services (AODS) customers in this repo. We want to have control on who can approve PRs for code change on AODS workbooks and alert templates. Can we add CODEOWNERS file to define individuals or teams that are responsible for code in the repo/subdirectories? For example something like this repo has: https://github.com/microsoft/Application-Insights-Workbooks

Seems you have hardcoded values in the script and a missing variable

Hi there
where running your script, always got the below error
Set-AzContext : Cannot validate argument on parameter 'Subscription'. The argument is null or empty. Provide an argument that is not null or empty

Looking at the script code you are using a variable $subId which does not exist; the parameter one is $SubscriptionId

Then, you have also hardcoded value for the workspace RG and and name
$rgNameWorkspace = 'rg-jamui-workspace'
$workspaceName = 'workspace-jamui-1'

When fixing these issues, the script can run successfully as per below

Connect-AzAccount
Select-AzSubscription -Subscription $SubscriptionId

$rgNameWorkspace = $ResourceGroupName
$workspaceName = $WorkspaceName

Alert Rule webhookdata incorrect ResultCount value

Hi, I've been using Alert rules for some time to trigger Teams messages. We process the message using the webhookdata, and evaluate some criteria based on the attribute ResultCount. Ever since the 28th May. the ResultCount has been 2, for all triggered alerts. Regardless of the actual number of results in the webhookdata. This is causing our alert to be broken resulting in messages containing System.Object[] rather than strings.

Partial of the webhookdata to help illustrate, heavily redacted so apologies, just trying to illustrate there are three rows in SearchResults but the ResultCount is 2. I've seen the same ResultCount of 2 where there are 1, 2, 3, 4, 5, 6 rows etc, so it seems ResultCount is broken.

"ResultCount": 2,
"SeverityDescription": "Critical",
"WorkspaceId": "xxxxx-xxxxxx-xxxxx-0aa8889d4e49",
"SearchIntervalDurationMin": "2880",
"AffectedConfigurationItems": [],
"AlertType": "Number of results",
"IncludeSearchResults": true,
"SearchIntervalInMinutes": "2880",
"Threshold": 0,
"Operator": "Greater Than",
"SearchResults": {
"tables": [{
"name": "PrimaryResult",
"columns": [{
"name": "subnet_trim",
"type": "string"
}, {
"name": "Cloud_Identity",
"type": "string"
}, {
"name": "Count",
"type": "long"
}],
"rows": [
["web-plan-investments", "web-QuaiAPI", 8],
["", "paymentsapp", 16],
["", "quaiapp", 42]
]
}],

Wait Stats (database) query is busted - 'summarize' operator: Failed to resolve scalar expression named 'wait_type_s'

The below query throws an error that it failed to resolve wait_type_s. I don't see it in the list of returned fields.

// Wait stats 
// Wait stats over the last hour, by Logical Server and Database. 
AzureDiagnostics
| where ResourceProvider == "MICROSOFT.SQL"
| where TimeGenerated >= ago(60min)
| parse _ResourceId with * "/microsoft.sql/servers/" LogicalServerName "/databases/" DatabaseName
| summarize Total_count_60mins = sum(delta_waiting_tasks_count_d) by LogicalServerName, DatabaseName, wait_type_s

Add "Bytes Remaining" to the selectable signal/metric when configuring alerts

Hi Azure monitor team,

I am trying to open this issue on behalf of our customer. The customer would like to be alerted when the bytes remaining in a file sync session is too large. Please refer below:

MicrosoftTeams-image (3)

However, when configuring, this metric is not selectable:
image

Please kindly advise and discuss if we would have some solution/workaround on this.

Is this a bug?

This query returns what's expected

AzureDiagnostics 
|where Category contains "postgre" and Message contains "not"
| take 50 
| order by TimeGenerated desc

works when replacing Message contains "not" with Message contains "cert"
But ssl or SSL or connect won't return this entry, and instead the latest is way earlier than it.

image

Add Resource types for AML, Function Apps, Network components to wiki & documentation

There are likely others available from Azure documentation / region availability & pricing calculator pages which can be monitored via Appinsights / Log Analytics.

Azure Data Lake Analytics
Azure Data Lake Store Gen1
Azure Machine Learning (AML) Workspace
Databricks Workspace
Synapse Analytics Workspace
Function Apps
Public IP Address
VNET
Network Adapter
Network Security Group (NSG)

Sorting the wiki lists alphabetically would also help in terms of identification & maintenance.

Recommend Projects

  • React photo React

    A declarative, efficient, and flexible JavaScript library for building user interfaces.

  • Vue.js photo Vue.js

    ๐Ÿ–– Vue.js is a progressive, incrementally-adoptable JavaScript framework for building UI on the web.

  • Typescript photo Typescript

    TypeScript is a superset of JavaScript that compiles to clean JavaScript output.

  • TensorFlow photo TensorFlow

    An Open Source Machine Learning Framework for Everyone

  • Django photo Django

    The Web framework for perfectionists with deadlines.

  • D3 photo D3

    Bring data to life with SVG, Canvas and HTML. ๐Ÿ“Š๐Ÿ“ˆ๐ŸŽ‰

Recommend Topics

  • javascript

    JavaScript (JS) is a lightweight interpreted programming language with first-class functions.

  • web

    Some thing interesting about web. New door for the world.

  • server

    A server is a program made to process requests and deliver data to clients.

  • Machine learning

    Machine learning is a way of modeling and interpreting data that allows a piece of software to respond intelligently.

  • Game

    Some thing interesting about game, make everyone happy.

Recommend Org

  • Facebook photo Facebook

    We are working to build community through open source technology. NB: members must have two-factor auth.

  • Microsoft photo Microsoft

    Open source projects and samples from Microsoft.

  • Google photo Google

    Google โค๏ธ Open Source for everyone.

  • D3 photo D3

    Data-Driven Documents codes.