
An exporter that collect V2Ray metrics over its Stats API and export them to Prometheus.
The latest binaries are made available on GitHub releases page:
wget -O /tmp/v2ray-exporter https://github.com/wi1dcard/v2ray-exporter/releases/latest/download/v2ray-exporter_linux_amd64
mv /tmp/v2ray-exporter /usr/local/bin/v2ray-exporter
chmod +x /usr/local/bin/v2ray-exporter- Arch Linux (@unknowndev233): https://aur.archlinux.org/packages/v2ray-exporter
You can also find the docker images built automatically by CI from Docker Hub. The images are made for multi-arch. You can run it from your Raspberry Pi or any other ARM, ARM64 devices without changing the image name:
docker run --rm -it wi1dcard/v2ray-exporter:<TAG>Please note that latest tag is not available. Use master instead if you want the latest build of master branch.
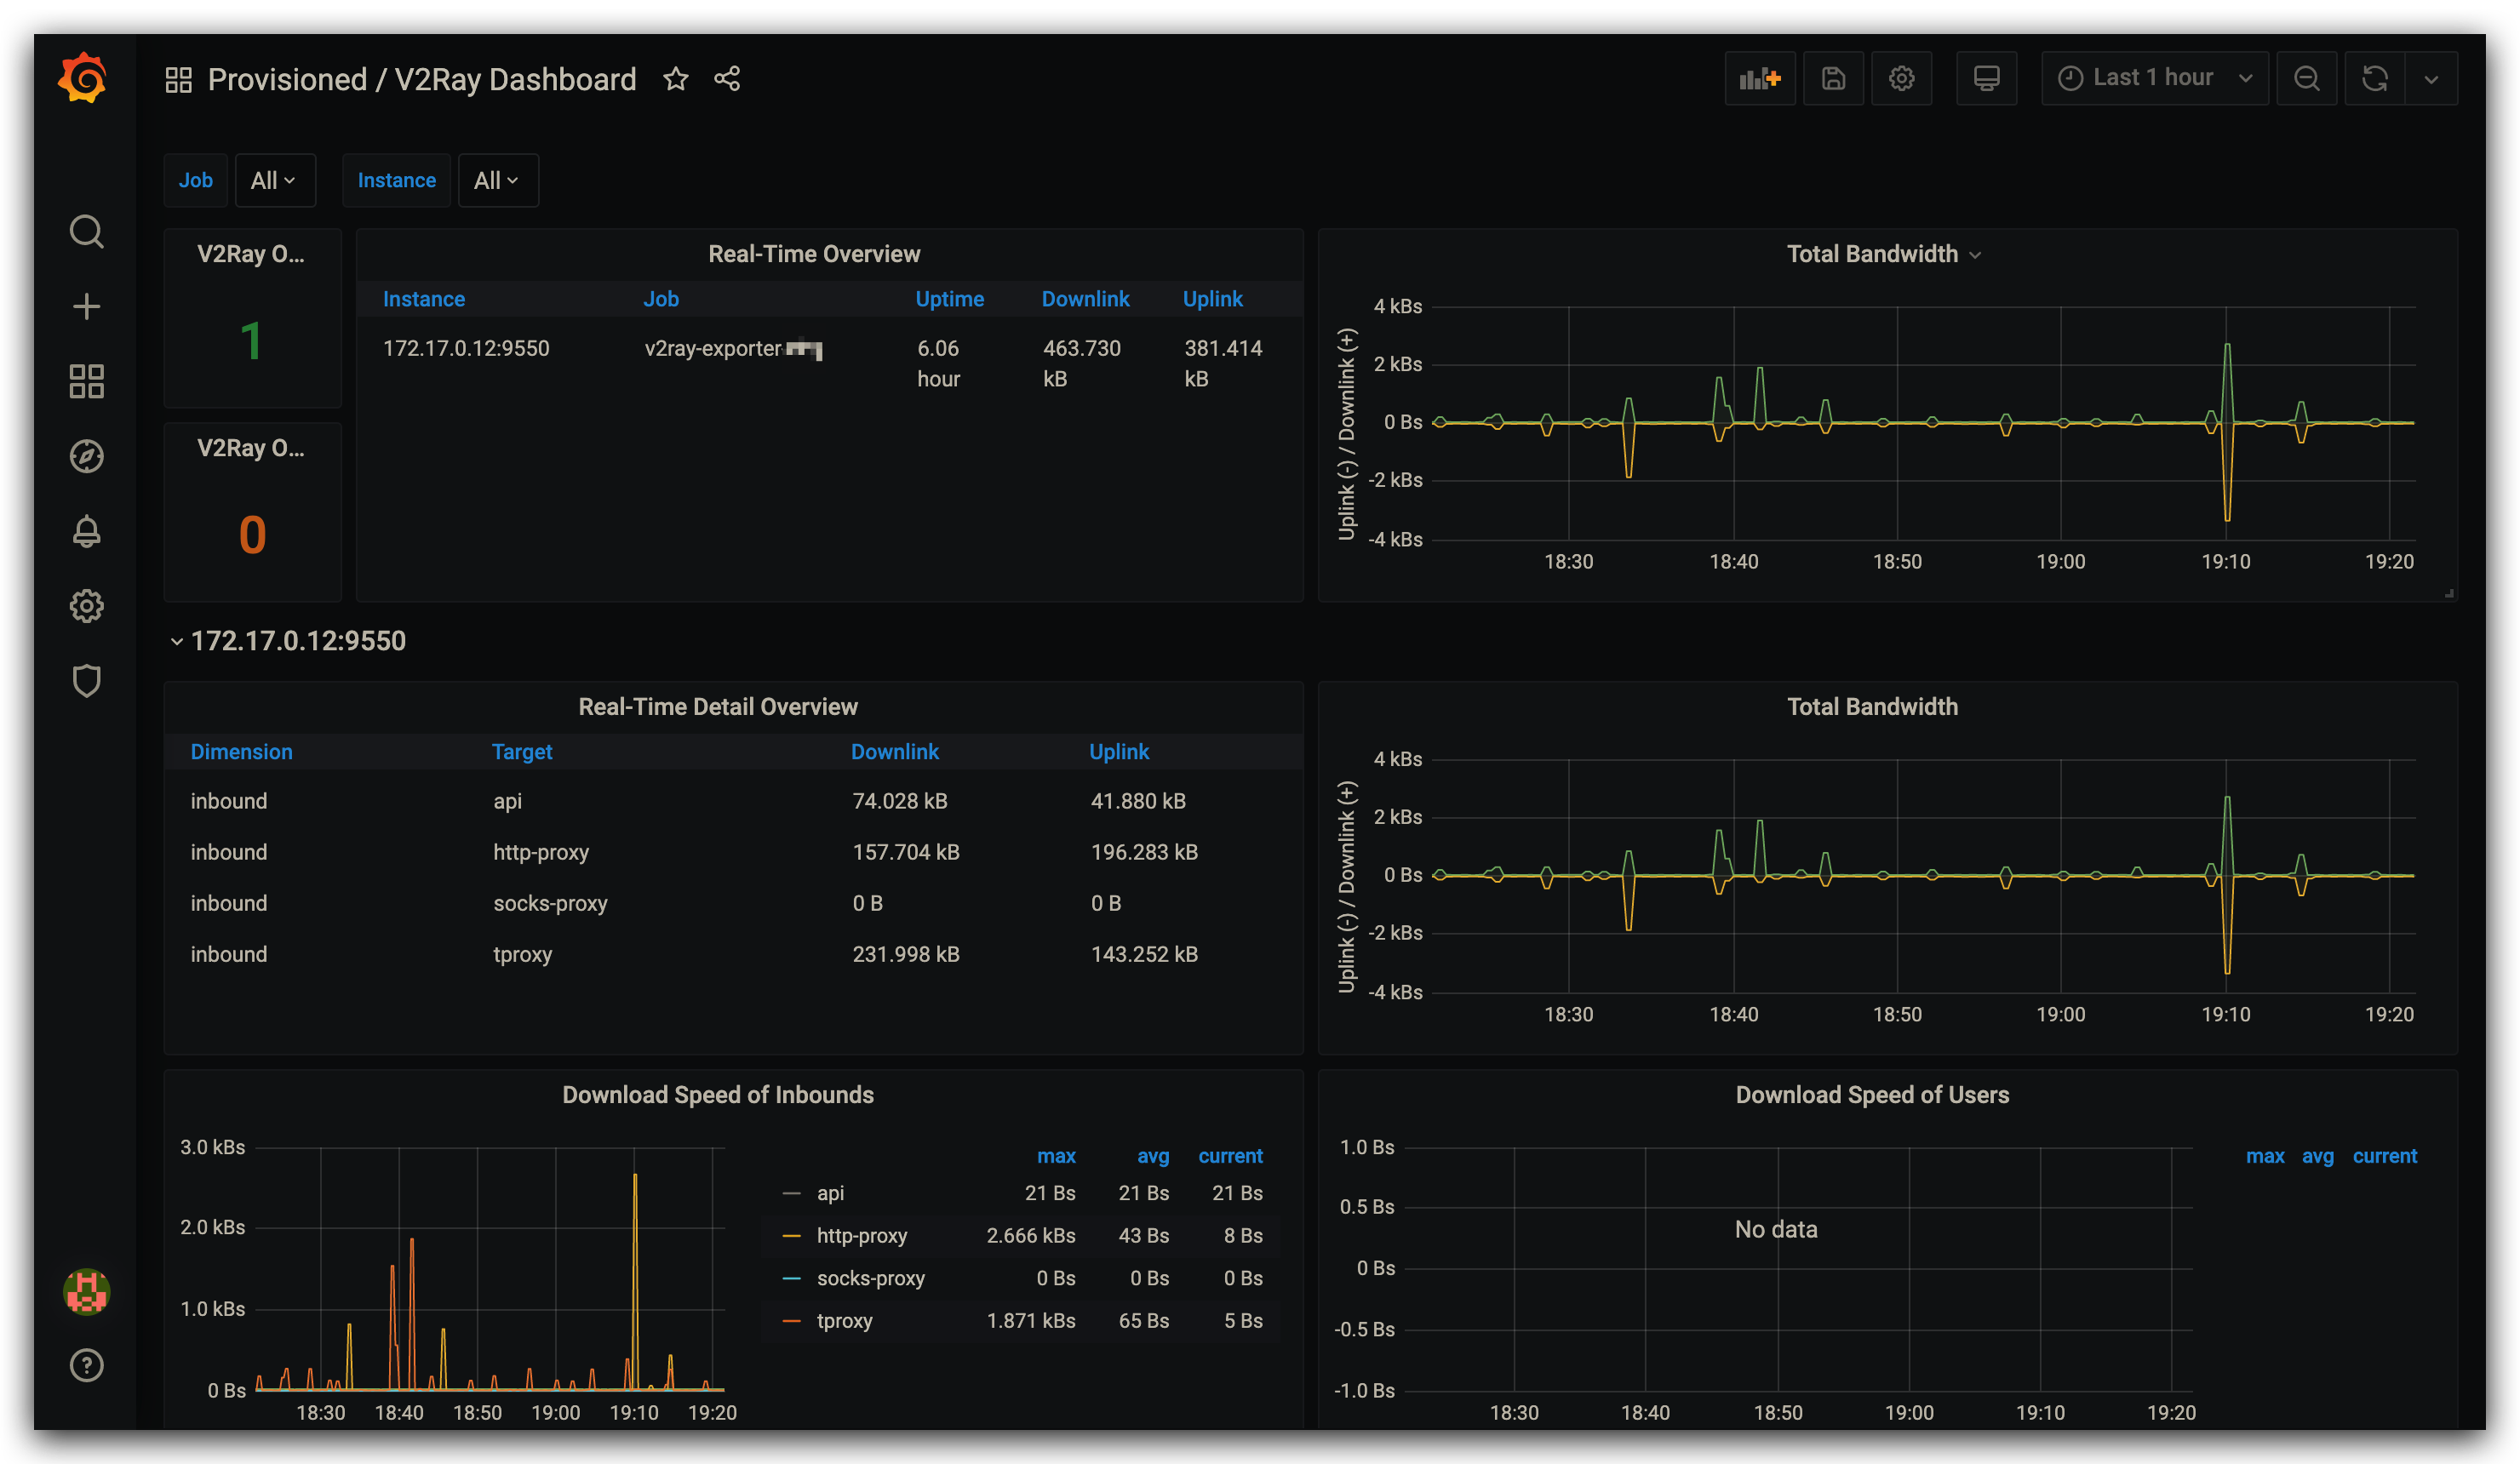
A simple Grafana dashboard is also available here. Please refer to the Grafana docs to get the steps of importing dashboards from JSON files.
Note that the dashboard on grafana.com may not be the latest version, please consider downloading the dashboard JSON from the link above.
Before we start, let's assume you have already set up Prometheus and Grafana.
Firstly, you will need to make sure the API and statistics related features have been enabled in your V2Ray config file. For example:
{
    "stats": {},
    "api": {
        "tag": "api",
        "services": [
            "StatsService"
        ]
    },
    "policy": {
        "levels": {
            "0": {
                "statsUserUplink": true,
                "statsUserDownlink": true
            }
        },
        "system": {
            "statsInboundUplink": true,
            "statsInboundDownlink": true,
            "statsOutboundUplink": true,
            "statsOutboundDownlink": true
        }
    },
    "inbounds": [
        {
            "tag": "tcp",
            "port": 12345,
            "protocol": "vmess",
            "settings": {
                "clients": [
                    {
                        "email": "[email protected]",
                        "id": "e731f153-4f31-49d3-9e8f-ff8f396135ef",
                        "level": 0,
                        "alterId": 4
                    },
                    {
                        "email": "[email protected]",
                        "id": "e731f153-4f31-49d3-9e8f-ff8f396135ee",
                        "level": 0,
                        "alterId": 4
                    }
                ]
            }
        },
        {
            "tag": "api",
            "listen": "127.0.0.1",
            "port": 54321,
            "protocol": "dokodemo-door",
            "settings": {
                "address": "127.0.0.1"
            }
        }
    ],
    "outbounds": [
        {
            "protocol": "freedom",
            "settings": {}
        }
    ],
    "routing": {
        "rules": [
            {
                "inboundTag": [
                    "api"
                ],
                "outboundTag": "api",
                "type": "field"
            }
        ]
    }
}
As you can see, we opened two inbounds in the configuration above. The first inbound accepts VMess connections from user [email protected] and [email protected], and the second one listens port 54321 on localhost and handles the API calls, which is the endpoint that the exporter scrapes. If you'd like to run V2Ray and exporter on different machines, consider use 0.0.0.0 instead of 127.0.0.1 and be careful with the security risks.
Additionally, you should also enable stats, api, and policy settings, and setup proper routing rules in order to get traffic statistics works. For more information, please visit The Beginner's Guide of V2Ray.
The next step is to start the exporter:
v2ray-exporter --v2ray-endpoint "127.0.0.1:54321"
## Or
docker run --rm -d wi1dcard/v2ray-exporter:master --v2ray-endpoint "127.0.0.1:54321"
The logs signifies that the exporter started to listening on the default address (:9550).
V2Ray Exporter master-39eb972 (built 2020-04-05T05:32:01Z)
time="2020-05-11T06:18:09Z" level=info msg="Server is ready to handle incoming scrape requests."
Use --listen option if you'd like to changing the listen address or port. You can now open http://IP:9550 in your browser:
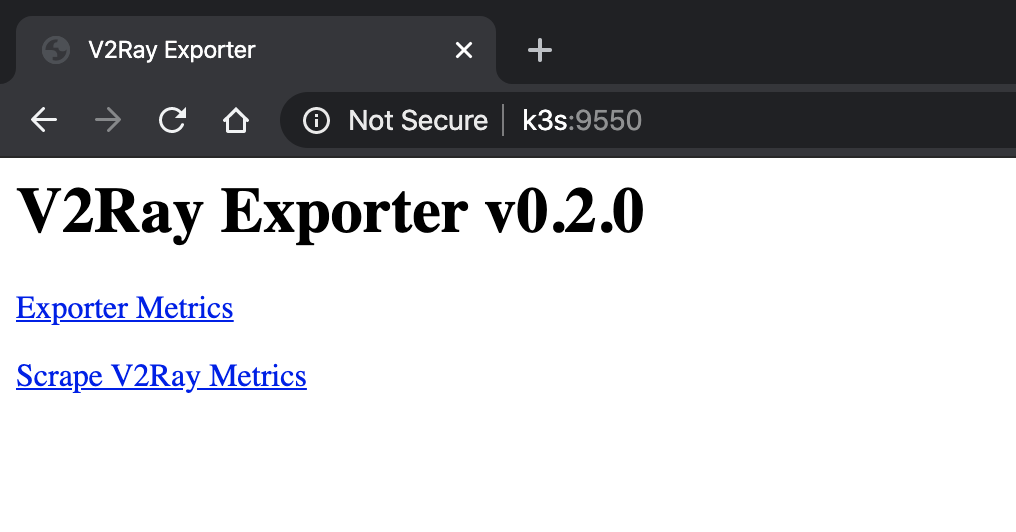
Click the Scrape V2Ray Metrics and the exporter will expose all metrics including V2Ray runtime and statistics data in the Prometheus metrics format, for example:
...
# HELP v2ray_up Indicate scrape succeeded or not
# TYPE v2ray_up gauge
v2ray_up 1
# HELP v2ray_uptime_seconds V2Ray uptime in seconds
# TYPE v2ray_uptime_seconds gauge
v2ray_uptime_seconds 150624
...
If v2ray_up 1 doesn't exist in the response, that means the scrape was failed, please check out the logs (STDOUT or STDERR) of V2Ray Exporter for more detailed information.
We have the metrics exposed. Now let Prometheus scrapes these data points and visualize them with Grafana. Here is an example Promtheus configuration:
global:
  scrape_interval: 15s
  scrape_timeout: 5s

scrape_configs:
  - job_name: v2ray
    metrics_path: /scrape
    static_configs:
      - targets: [IP:9550]
To learn more about Prometheus, please visit the official docs.
The exporter doesn't retain the original metric names from V2Ray intentionally. You may find out why in the comments.
For users who do not really care about the internal changes, but only need a mapping table, here it is:
| Runtime Metric | Exposed Metric |
|---|---|
uptime |
v2ray_uptime_seconds |
num_goroutine |
v2ray_goroutines |
alloc |
v2ray_memstats_alloc_bytes |
total_alloc |
v2ray_memstats_alloc_bytes_total |
sys |
v2ray_memstats_sys_bytes |
mallocs |
v2ray_memstats_mallocs_total |
frees |
v2ray_memstats_frees_total |
live_objects |
Removed. See the appendix below. |
num_gc |
v2ray_memstats_num_gc |
pause_total_ns |
v2ray_memstats_pause_total_ns |
| Statistic Metric | Exposed Metric |
|---|---|
inbound>>>tag-name>>>traffic>>>uplink |
v2ray_traffic_uplink_bytes_total{dimension="inbound",target="tag-name"} |
inbound>>>tag-name>>>traffic>>>downlink |
v2ray_traffic_downlink_bytes_total{dimension="inbound",target="tag-name"} |
outbound>>>tag-name>>>traffic>>>uplink |
v2ray_traffic_uplink_bytes_total{dimension="outbound",target="tag-name"} |
outbound>>>tag-name>>>traffic>>>downlink |
v2ray_traffic_downlink_bytes_total{dimension="outbound",target="tag-name"} |
user>>>user-email>>traffic>>>uplink |
v2ray_traffic_uplink_bytes_total{dimension="user",target="user-email"} |
user>>>user-email>>>traffic>>>downlink |
v2ray_traffic_downlink_bytes_total{dimension="user",target="user-email"} |
| ... | ... |
- The value of
live_objectscan be calculated bymemstats_mallocs_total - memstats_frees_total.
- GitHub Action
- https://github.com/schweikert/fping-exporter
- https://github.com/oliver006/redis_exporter
- https://github.com/roboll/helmfile
MIT


