Coder Social home page Coder Social logo

maximtrp / tmplot Goto Github PK

View Code? Open in Web Editor NEW
19.0 2.0 0.0 17.82 MB

Visualization of Topic Modeling Results

Home Page: https://tmplot.readthedocs.org

License: MIT License

Python 100.00%
topic-modeling visualization data-science machine-learning python plotting data-visualization

tmplot's Introduction

tmplot

Codacy coverage Codacy grade GitHub Workflow Status Documentation Status Downloads PyPI Issues

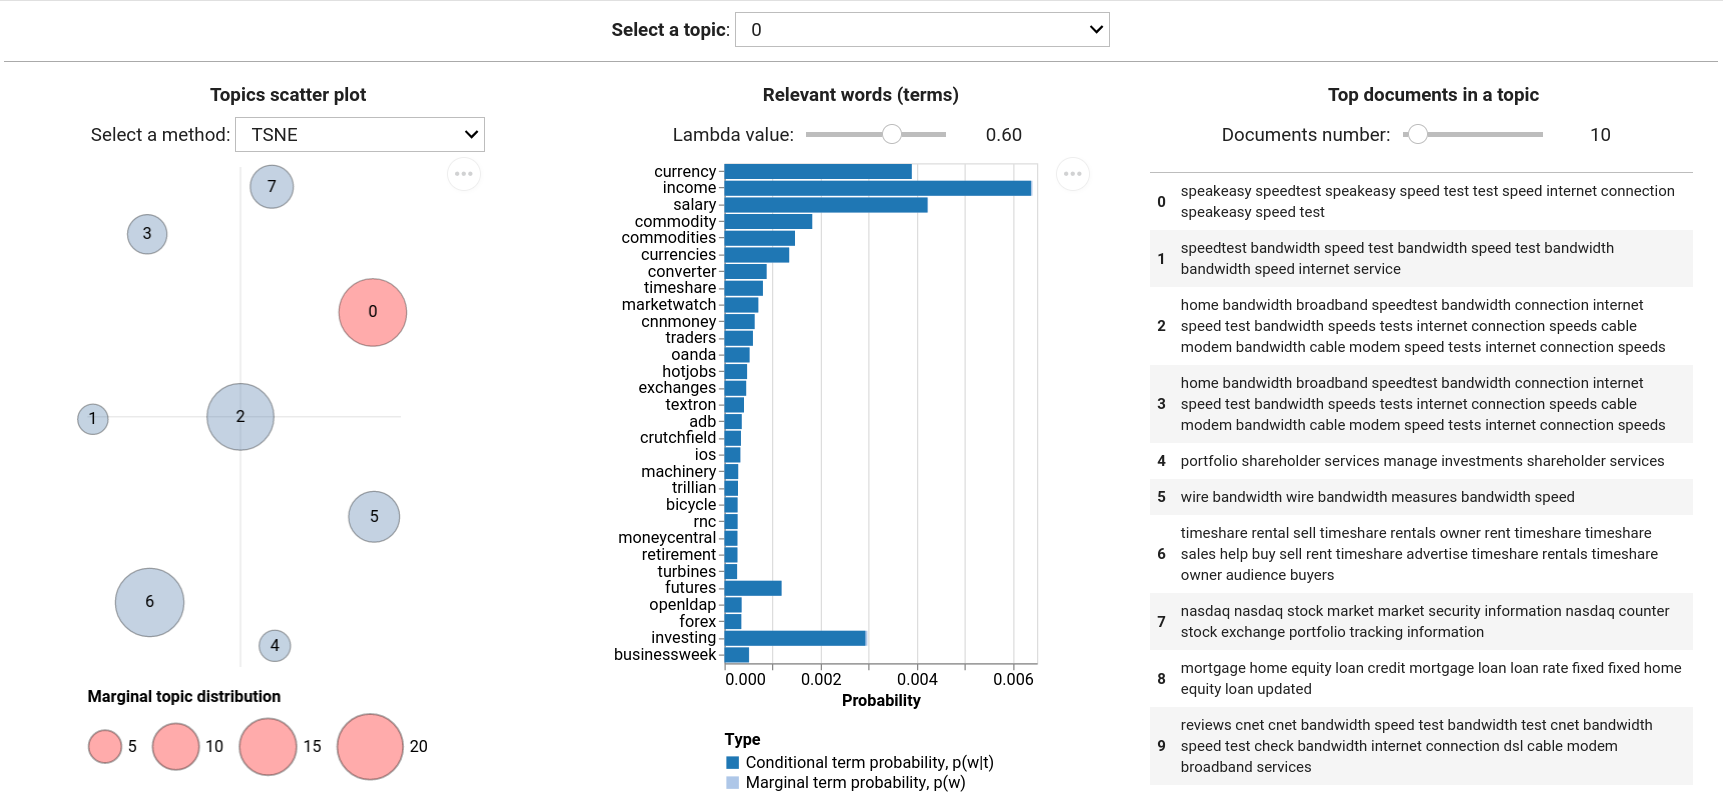
tmplot is a Python package for analysis and visualization of topic modeling results. It provides the interactive report interface that borrows much from LDAvis/pyLDAvis and builds upon it offering a number of metrics for calculating topic distances and a number of algorithms for calculating scatter coordinates of topics. It can be used to select closest and stable topics across multiple models.

Plots

Features

  • Supported models:

    • tomotopy: LDAModel, LLDAModel, CTModel, DMRModel, HDPModel, PTModel, SLDAModel, GDMRModel
    • gensim: LdaModel, LdaMulticore
    • bitermplus: BTM
  • Supported distance metrics:

    • Kullback-Leibler (symmetric and non-symmetric) divergence
    • Jenson-Shannon divergence
    • Jeffrey's divergence
    • Hellinger distance
    • Bhattacharyya distance
    • Total variation distance
    • Jaccard inversed index
  • Supported algorithms for calculating topics scatter coordinates:

    • t-SNE
    • SpectralEmbedding
    • MDS
    • LocallyLinearEmbedding
    • Isomap

Donate

If you find this package useful, please consider donating any amount of money. This will help me spend more time on supporting open-source software.

Buy Me A Coffee

Installation

The package can be installed from PyPi:

pip install tmplot

Or directly from this repository:

pip install git+https://github.com/maximtrp/tmplot.git

Dependencies

  • numpy
  • scipy
  • scikit-learn
  • pandas
  • altair
  • ipywidgets
  • tomotopy, gensim, and bitermplus (optional)

Quick example

# Importing packages
import tmplot as tmp
import pickle as pkl
import pandas as pd

# Reading a model from a file
with open('data/model.pkl', 'rb') as file:
    model = pkl.load(file)

# Reading documents from a file
docs = pd.read_csv('data/docs.txt.gz', header=None).values.ravel()

# Plotting topics as a scatter plot
topics_coords = tmp.prepare_coords(model)
tmp.plot_scatter_topics(topics_coords, size_col='size', label_col='label')

# Plotting terms probabilities
terms_probs = tmp.calc_terms_probs_ratio(phi, topic=0, lambda_=1)
tmp.plot_terms(terms_probs)

# Running report interface
tmp.report(model, docs=docs, width=250)

You can find more examples in the tutorial.

tmplot's People

Contributors

maximtrp avatar

Stargazers

 avatar  avatar  avatar  avatar  avatar  avatar  avatar  avatar  avatar  avatar  avatar  avatar  avatar  avatar  avatar  avatar  avatar  avatar  avatar

Watchers

 avatar  avatar

tmplot's Issues

Report not showing

Hi,

I tried the code example but nothing happens when running:

tmp.report(model, docs=docs, width=250)

Is it only Working inside a jupyter notebooks?

If yes, is There a way to export the chart as .html?

Finally, is it possible to plot the chart inside a streamlit application ?

Thanks!

Problem when analyzing the model.

When I used tmplot to visualize my bitermplus model, It worked but Topics scatter plot didn't show and I got this warning:

E:\Python\lib\site-packages\tmplot\_helpers.py:38: UserWarning: Please install "f{package_name}" package to analyze its models.
Run `pip install f{package_name}` in the console.

However, I've never missed any package and requirement. Definitely I've already installed bitermplus. Relevant words (terms) and Top documents in a topic worked well.
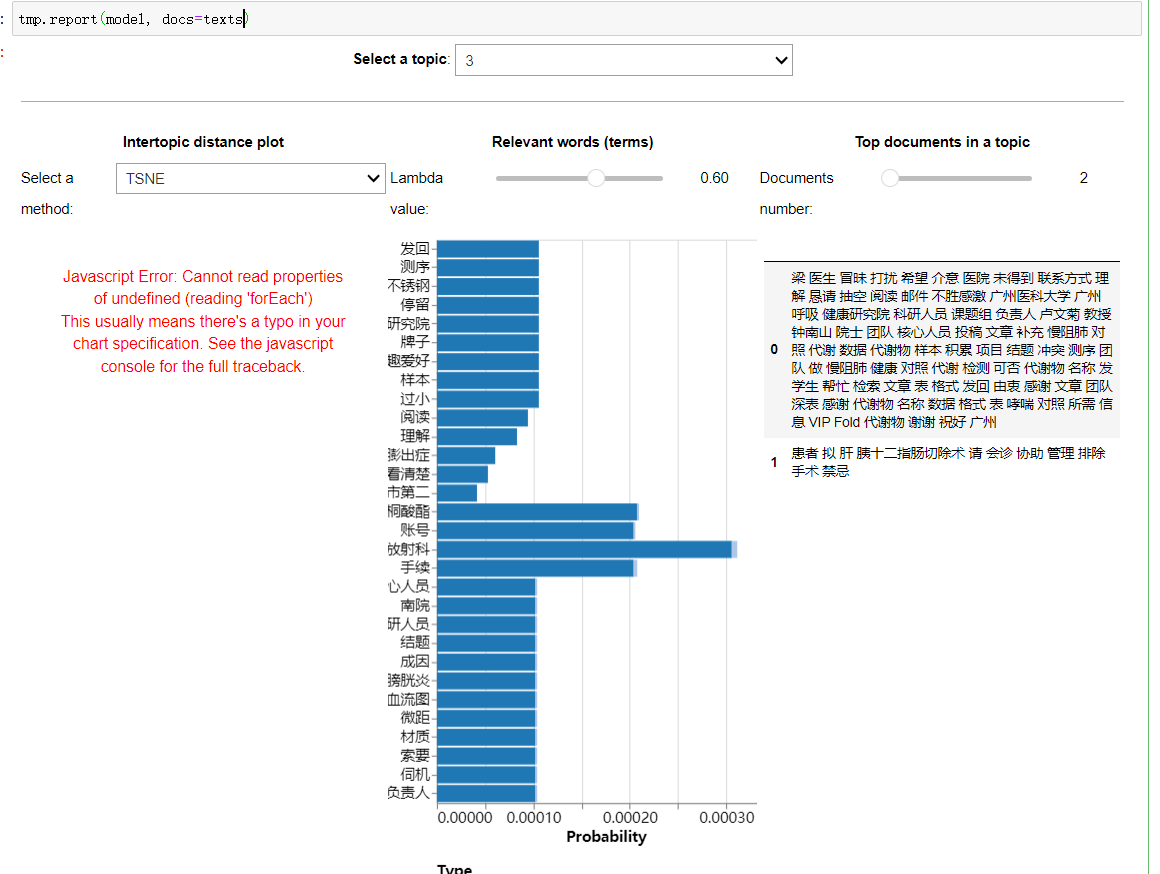
And as well I got a JS error. I know little about JS code.

Javascript Error: Cannot read property 'forEach' of undefined
This usually means there's a typo in your chart specification. See the javascript console for the full traceback.

Here is my code:

......
import bitermplus as btm
import numpy as np
import pandas as pd
X, vocab, vocab_dict = btm.get_words_freqs(text)
# print(vocab_dict)
tf = np.array(X.sum(axis=0)).ravel()
# print(tf)
docs_vec = btm.get_vectorized_docs(text, vocab)
docs_len = list(map(len, docs_vec))
biterms = btm.get_biterms(docs_vec)
# print(biterms)
model = btm.BTM(X, vocab, seed=12321, T=8, M=20, alpha=50/8, beta=0.01)
model.fit(biterms, iterations=20)
p_zd = model.transform(docs_vec)
import tmplot as tmp
tmp.report(model=model, docs=text)
......

Lambda value regarding relevant topics

I noticed that the Lambda value for relevant words section was always reset to default value (0.6) whenever you change the topic number to show in the visualization. Do you know what might be causing that and how that could be fixed? I tried to change the default value in the visualization in the code, but it did not seem to change that behavior of showing relevant topics. BTW, I was using the bitermplus for TM.

valueError: perplexity must be less than n_samples

My corpus has 49 records, which is not a short text.
No error is reported when T>=6, but an error is reported when T<=5

model = btm.BTM(X, vocab, T=5, M=50, alpha=1, beta=0.01)
model.fit(biterms, iterations=100)

tmp.report(model=model, docs=content_flat)
valueError: perplexity must be less than n_samples

I found that this error is not directly related to the level of perplexity
T=5 perplexity:263.31198210806156
T=6 perplexity:251.15355539215517
the number of records is 49

Name: tmplot
Version: 0.1.0
Name: bitermplus
Version: 0.7.0

This error has caused me a lot of trouble. I look forward to your reply. Thank you.

Incorrect implementation for `get_relevant_terms` in `tmplot`

Thanks for your work on this nice package.

However, the current implementation of get_relevant_terms is incorrect.

The LDAvis paper reports around 0.6 being the ideal value for the visualisation parameter for the relevancy score. However in tmplot I found that I have to also manually tune to near 0.99 to 0.9999 for a good balance of the high frequency terms and high lift (p(w|t)/p(w)) terms. I observe that from 0 to 0.9 there are almost no effect the the ranking.
I do NOT observe this behaviour in pyLDAvis.

I think it is clear now that this is scaling issue and indeed in the original paper the formula for the relevancy score is defined with log probabilities instead of probabilities as in tmplot. Which explains the strange behaviour of having the responsive range of (1 - 1e-2 to 1 - 1e-4)

Here is a reference implementation from pyLDAvis in which unfortunately their visualisation showed a incorrect definition in the footnote, despite their implementation being correct.

I had open an issue for this: bmabey/pyLDAvis#261

AttributeError: 'NoneType' object has no attribute 'split'

Hi, I have been trying to use the to use the prepare_coords function to calculate the coordinates for the topics generated by a BTM but getting an error which i noted was also mentioned in #6. The below code is used, where the model is a BTM from the package bitermplus fitted on a corpus of short texts. I have tried fitting the model with different number of topics but the issue still arises.

topics_coords = tmp.prepare_coords(model)

And then the below error is produced by it. Maybe I am the one at fault here but I can't see why the problem arises, It has worked when doing the same thing previously (on a different dataset).

I am utilizing the latest release of tmplot.

Thank you for any possible assistance and I apologize beforehand if have made any mistake, this is my first issue raised here on GitHub.


AttributeError                           Traceback (most recent call last)
Cell In[19], line 2
      1 #Calculate coordinates
----> 2 topics_coords = tmp.prepare_coords(model)

File ~\Anaconda3\lib\site-packages\tmplot\_report.py:44, in prepare_coords(model, labels, dist_kws, scatter_kws)
     42 theta = get_theta(model)
     43 topics_dists = get_topics_dist(phi, **dist_kws)
---> 44 topics_coords = get_topics_scatter(topics_dists, theta, **scatter_kws)
     45 topics_coords['label'] = labels or theta.index
     46 return topics_coords

File ~\Anaconda3\lib\site-packages\tmplot\_distance.py:177, in get_topics_scatter(topic_dists, theta, method, method_kws)
    174 elif method == 'isomap':
    175     transformer = Isomap(**method_kws)
--> 177 coords = transformer.fit_transform(topic_dists)
    179 topics_xy = DataFrame(coords, columns=['x', 'y'])
    180 topics_xy['topic'] = topics_xy.index.astype(int)

File ~\Anaconda3\lib\site-packages\sklearn\manifold\_t_sne.py:1119, in TSNE.fit_transform(self, X, y)
   1117 self._validate_params()
   1118 self._check_params_vs_input(X)
-> 1119 embedding = self._fit(X)
   1120 self.embedding_ = embedding
   1121 return self.embedding_

File ~\Anaconda3\lib\site-packages\sklearn\manifold\_t_sne.py:963, in TSNE._fit(self, X, skip_num_points)
    956     print(
    957         "[t-SNE] Indexed {} samples in {:.3f}s...".format(
    958             n_samples, duration
    959         )
    960     )
    962 t0 = time()
--> 963 distances_nn = knn.kneighbors_graph(mode="distance")
    964 duration = time() - t0
    965 if self.verbose:

File ~\Anaconda3\lib\site-packages\sklearn\neighbors\_base.py:988, in KNeighborsMixin.kneighbors_graph(self, X, n_neighbors, mode)
    985     A_data = np.ones(n_queries * n_neighbors)
    987 elif mode == "distance":
--> 988     A_data, A_ind = self.kneighbors(X, n_neighbors, return_distance=True)
    989     A_data = np.ravel(A_data)
    991 else:

File ~\Anaconda3\lib\site-packages\sklearn\neighbors\_base.py:824, in KNeighborsMixin.kneighbors(self, X, n_neighbors, return_distance)
    817 use_pairwise_distances_reductions = (
    818     self._fit_method == "brute"
    819     and ArgKmin.is_usable_for(
    820         X if X is not None else self._fit_X, self._fit_X, self.effective_metric_
    821     )
    822 )
    823 if use_pairwise_distances_reductions:
--> 824     results = ArgKmin.compute(
    825         X=X,
    826         Y=self._fit_X,
    827         k=n_neighbors,
    828         metric=self.effective_metric_,
    829         metric_kwargs=self.effective_metric_params_,
    830         strategy="auto",
    831         return_distance=return_distance,
    832     )
    834 elif (
    835     self._fit_method == "brute" and self.metric == "precomputed" and issparse(X)
    836 ):
    837     results = _kneighbors_from_graph(
    838         X, n_neighbors=n_neighbors, return_distance=return_distance
    839     )

File ~\Anaconda3\lib\site-packages\sklearn\metrics\_pairwise_distances_reduction\_dispatcher.py:277, in ArgKmin.compute(cls, X, Y, k, metric, chunk_size, metric_kwargs, strategy, return_distance)
    196 """Compute the argkmin reduction.
    197 
    198 Parameters
   (...)
    274 returns.
    275 """
    276 if X.dtype == Y.dtype == np.float64:
--> 277     return ArgKmin64.compute(
    278         X=X,
    279         Y=Y,
    280         k=k,
    281         metric=metric,
    282         chunk_size=chunk_size,
    283         metric_kwargs=metric_kwargs,
    284         strategy=strategy,
    285         return_distance=return_distance,
    286     )
    288 if X.dtype == Y.dtype == np.float32:
    289     return ArgKmin32.compute(
    290         X=X,
    291         Y=Y,
   (...)
    297         return_distance=return_distance,
    298     )

File sklearn\metrics\_pairwise_distances_reduction\_argkmin.pyx:95, in sklearn.metrics._pairwise_distances_reduction._argkmin.ArgKmin64.compute()

File ~\Anaconda3\lib\site-packages\sklearn\utils\fixes.py:139, in threadpool_limits(limits, user_api)
    137     return controller.limit(limits=limits, user_api=user_api)
    138 else:
--> 139     return threadpoolctl.threadpool_limits(limits=limits, user_api=user_api)

File ~\Anaconda3\lib\site-packages\threadpoolctl.py:171, in threadpool_limits.__init__(self, limits, user_api)
    167 def __init__(self, limits=None, user_api=None):
    168     self._limits, self._user_api, self._prefixes = \
    169         self._check_params(limits, user_api)
--> 171     self._original_info = self._set_threadpool_limits()

File ~\Anaconda3\lib\site-packages\threadpoolctl.py:268, in threadpool_limits._set_threadpool_limits(self)
    265 if self._limits is None:
    266     return None
--> 268 modules = _ThreadpoolInfo(prefixes=self._prefixes,
    269                           user_api=self._user_api)
    270 for module in modules:
    271     # self._limits is a dict {key: num_threads} where key is either
    272     # a prefix or a user_api. If a module matches both, the limit
    273     # corresponding to the prefix is chosed.
    274     if module.prefix in self._limits:

File ~\Anaconda3\lib\site-packages\threadpoolctl.py:340, in _ThreadpoolInfo.__init__(self, user_api, prefixes, modules)
    337     self.user_api = [] if user_api is None else user_api
    339     self.modules = []
--> 340     self._load_modules()
    341     self._warn_if_incompatible_openmp()
    342 else:

File ~\Anaconda3\lib\site-packages\threadpoolctl.py:373, in _ThreadpoolInfo._load_modules(self)
    371     self._find_modules_with_dyld()
    372 elif sys.platform == "win32":
--> 373     self._find_modules_with_enum_process_module_ex()
    374 else:
    375     self._find_modules_with_dl_iterate_phdr()

File ~\Anaconda3\lib\site-packages\threadpoolctl.py:485, in _ThreadpoolInfo._find_modules_with_enum_process_module_ex(self)
    482         filepath = buf.value
    484         # Store the module if it is supported and selected
--> 485         self._make_module_from_path(filepath)
    486 finally:
    487     kernel_32.CloseHandle(h_process)

File ~\Anaconda3\lib\site-packages\threadpoolctl.py:515, in _ThreadpoolInfo._make_module_from_path(self, filepath)
    513 if prefix in self.prefixes or user_api in self.user_api:
    514     module_class = globals()[module_class]
--> 515     module = module_class(filepath, prefix, user_api, internal_api)
    516     self.modules.append(module)

File ~\Anaconda3\lib\site-packages\threadpoolctl.py:606, in _Module.__init__(self, filepath, prefix, user_api, internal_api)
    604 self.internal_api = internal_api
    605 self._dynlib = ctypes.CDLL(filepath, mode=_RTLD_NOLOAD)
--> 606 self.version = self.get_version()
    607 self.num_threads = self.get_num_threads()
    608 self._get_extra_info()

File ~\Anaconda3\lib\site-packages\threadpoolctl.py:646, in _OpenBLASModule.get_version(self)
    643 get_config = getattr(self._dynlib, "openblas_get_config",
    644                      lambda: None)
    645 get_config.restype = ctypes.c_char_p
--> 646 config = get_config().split()
    647 if config[0] == b"OpenBLAS":
    648     return config[1].decode("utf-8")

AttributeError: 'NoneType' object has no attribute 'split'

ValueError: perplexity must be less than n_samples

When the topic number is more than 30 (which is the TSNE's default perplexity setting), the ValueError occurs.

ValueError: perplexity must be less than n_samples

Maybe we shall simply set perplexity to 5, or change it according to the number of topics (e.g. add an n_topic variable to the _report() and _distance() methods)

Recommend Projects

  • React photo React

    A declarative, efficient, and flexible JavaScript library for building user interfaces.

  • Vue.js photo Vue.js

    ๐Ÿ–– Vue.js is a progressive, incrementally-adoptable JavaScript framework for building UI on the web.

  • Typescript photo Typescript

    TypeScript is a superset of JavaScript that compiles to clean JavaScript output.

  • TensorFlow photo TensorFlow

    An Open Source Machine Learning Framework for Everyone

  • Django photo Django

    The Web framework for perfectionists with deadlines.

  • D3 photo D3

    Bring data to life with SVG, Canvas and HTML. ๐Ÿ“Š๐Ÿ“ˆ๐ŸŽ‰

Recommend Topics

  • javascript

    JavaScript (JS) is a lightweight interpreted programming language with first-class functions.

  • web

    Some thing interesting about web. New door for the world.

  • server

    A server is a program made to process requests and deliver data to clients.

  • Machine learning

    Machine learning is a way of modeling and interpreting data that allows a piece of software to respond intelligently.

  • Game

    Some thing interesting about game, make everyone happy.

Recommend Org

  • Facebook photo Facebook

    We are working to build community through open source technology. NB: members must have two-factor auth.

  • Microsoft photo Microsoft

    Open source projects and samples from Microsoft.

  • Google photo Google

    Google โค๏ธ Open Source for everyone.

  • D3 photo D3

    Data-Driven Documents codes.