Coder Social home page Coder Social logo

matplotlib / cheatsheets Goto Github PK

View Code? Open in Web Editor NEW
7.2K 132.0 882.0 23.63 MB

Official Matplotlib cheat sheets

Home Page: https://matplotlib.org/cheatsheets/

License: BSD 2-Clause "Simplified" License

TeX 40.20% Python 56.55% Makefile 3.10% Shell 0.15%
matplotlib cheatsheet python

cheatsheets's Introduction

Cheatsheets for Matplotlib users

Cheatsheets

Cheatsheet (download pdf)
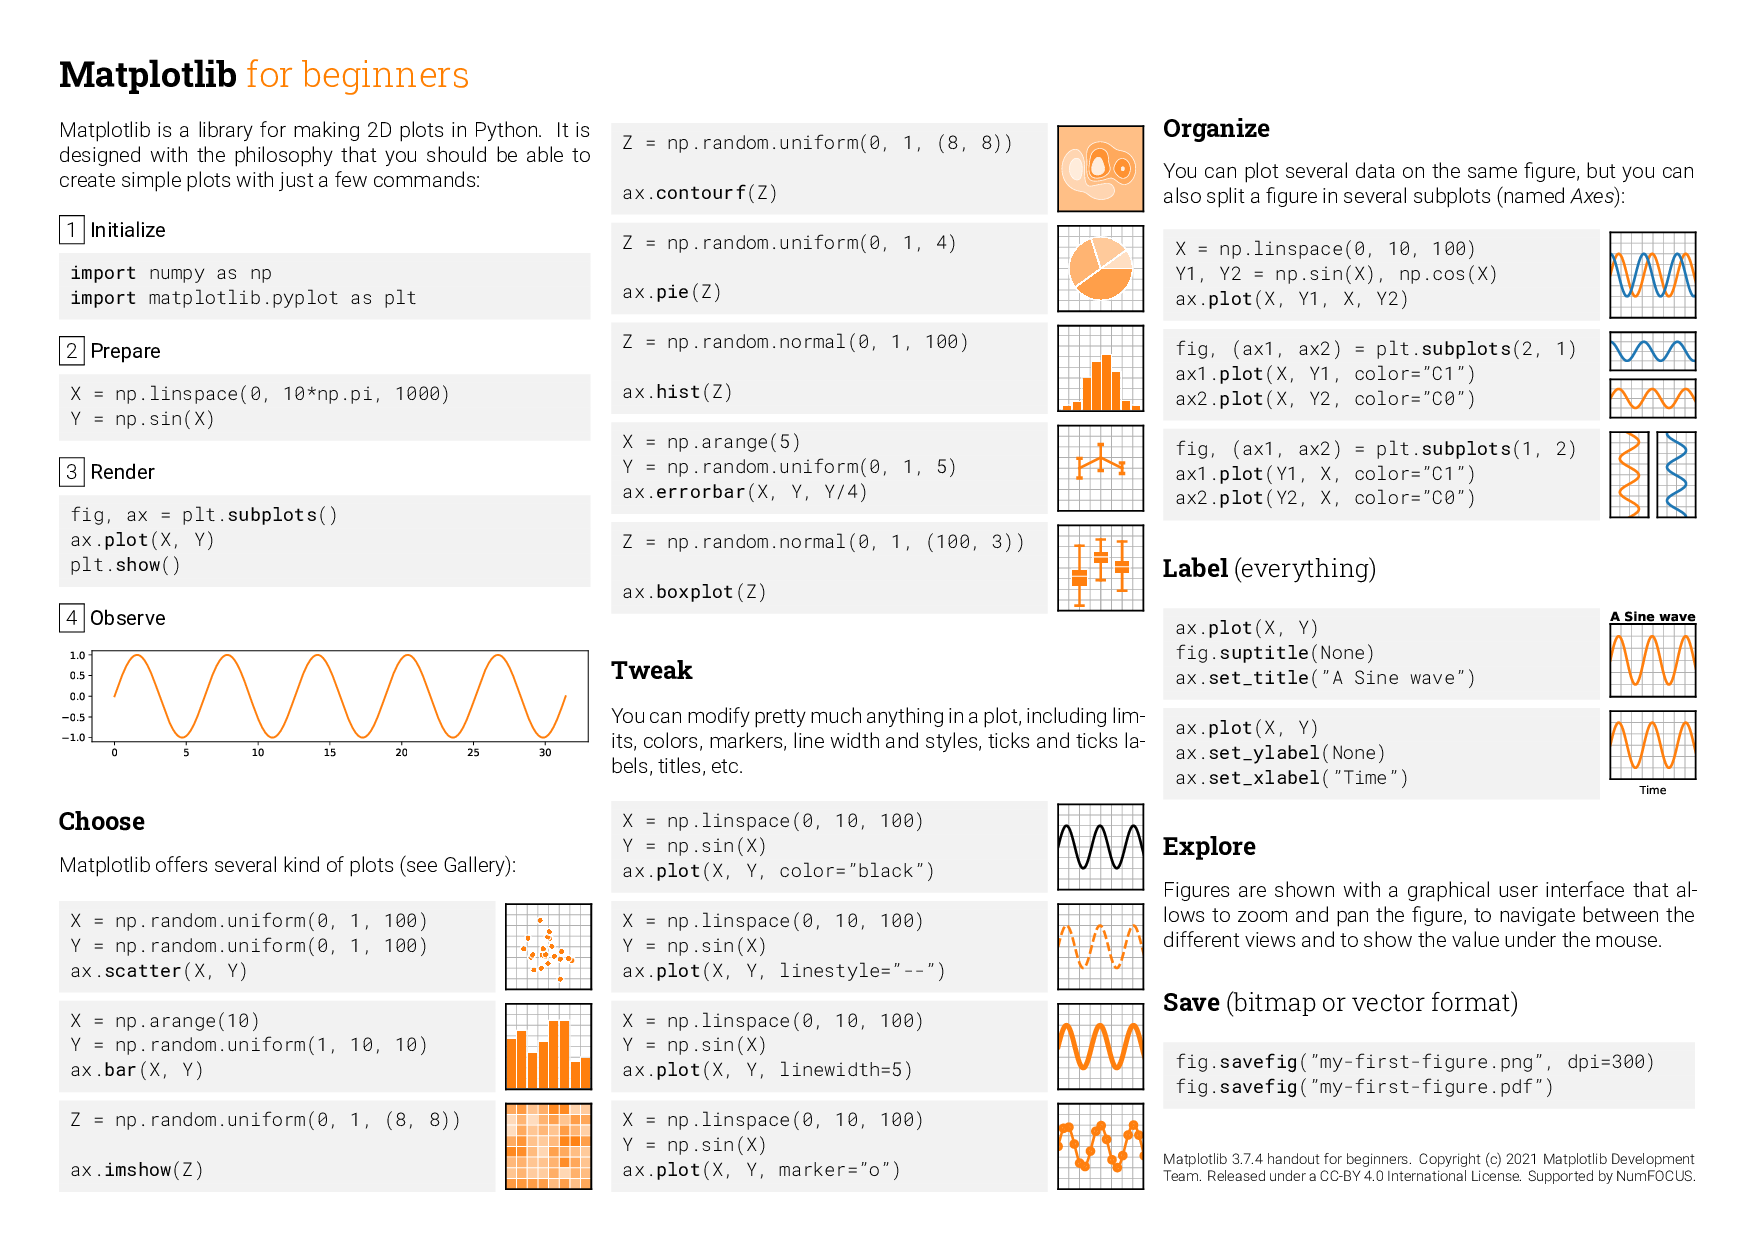
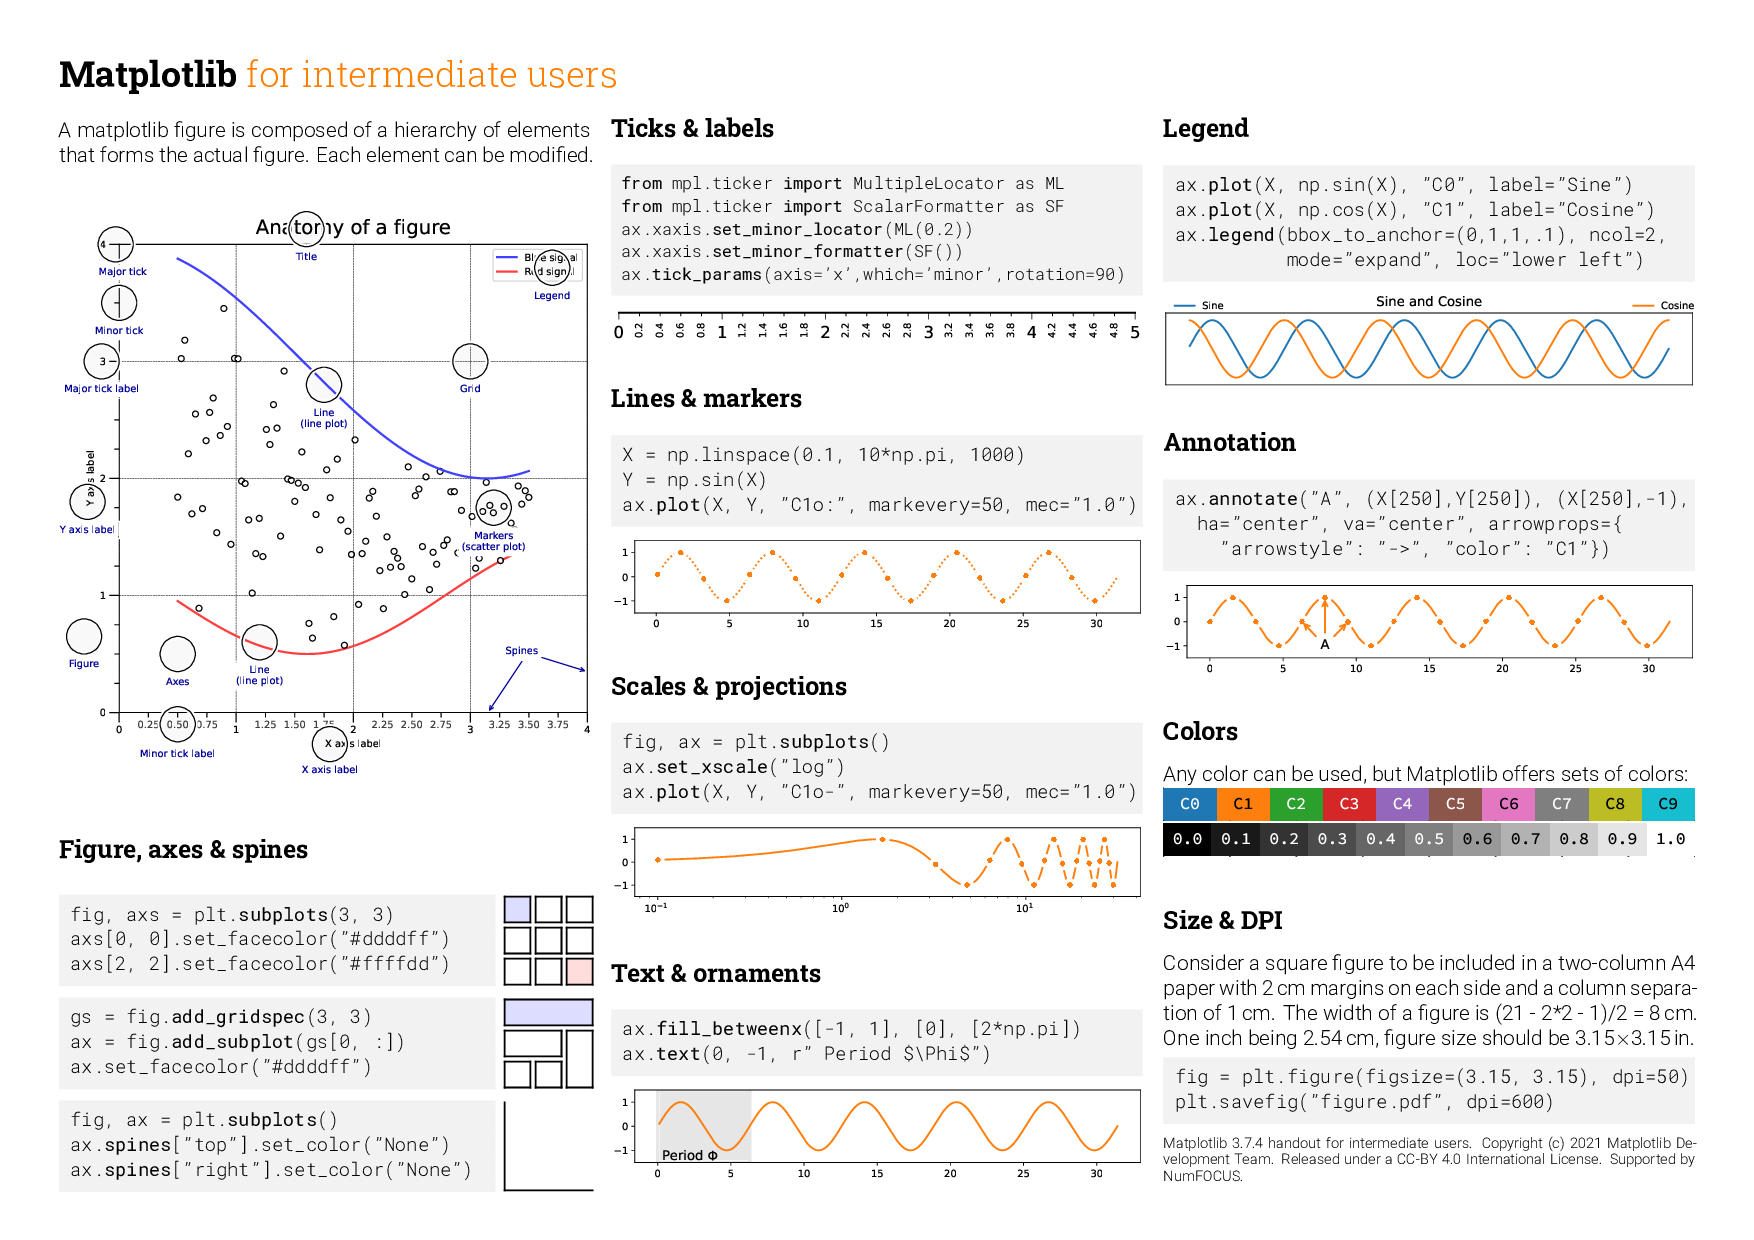
Handouts

Beginner handout (download pdf) Intermediate handout (download pdf) Tips handout (download pdf)

For contributors to the cheatsheets

How to compile

  1. You need to create a fonts repository with:

On Linux, with make installed, the fonts can be set up with the following command:

make -C fonts

The fonts can be made discoverable by matplotlib (through fontconfig) by creating the following in $HOME/.config/fontconfig/fonts.conf (see here):

<?xml version="1.0"?>
<!DOCTYPE fontconfig SYSTEM "fonts.dtd">
<fontconfig>
<dir>/path/to/cheatsheets/fonts/</dir>
...
</fontconfig>
  1. You need to generate all the figures:
$ cd scripts
$ for script in *.py; do python $script; done
$ cd ..
  1. Compile the sheet
$ xelatex cheatsheets.tex

cheatsheets's People

Contributors

camriddell avatar coandrei avatar danielhernanrico avatar dependabot[bot] avatar drammock avatar dstansby avatar importanceofbeingernest avatar jimustafa avatar jklymak avatar jrtpec avatar kojix2 avatar ksunden avatar louisjustintallot avatar mpetroff avatar oscargus avatar p2jones avatar qulogic avatar radarfudan avatar rmeli avatar rougier avatar stefre avatar story645 avatar tacaswell avatar timhoffm avatar volker-weissmann avatar xoolive avatar yymao avatar

Stargazers

 avatar  avatar  avatar  avatar  avatar  avatar  avatar  avatar  avatar  avatar  avatar  avatar  avatar  avatar  avatar  avatar  avatar  avatar  avatar  avatar  avatar  avatar  avatar  avatar  avatar  avatar  avatar  avatar  avatar  avatar  avatar  avatar  avatar  avatar  avatar  avatar  avatar  avatar  avatar  avatar  avatar  avatar  avatar  avatar  avatar  avatar  avatar  avatar  avatar  avatar  avatar  avatar  avatar  avatar  avatar  avatar  avatar  avatar  avatar  avatar  avatar  avatar  avatar  avatar  avatar  avatar  avatar  avatar  avatar  avatar  avatar  avatar  avatar  avatar  avatar  avatar  avatar  avatar  avatar  avatar  avatar  avatar  avatar  avatar  avatar  avatar  avatar  avatar  avatar  avatar  avatar  avatar  avatar  avatar  avatar  avatar  avatar  avatar  avatar  avatar

Watchers

 avatar  avatar  avatar  avatar  avatar  avatar  avatar  avatar  avatar  avatar  avatar  avatar  avatar  avatar  avatar  avatar  avatar  avatar  avatar  avatar  avatar  avatar  avatar  avatar  avatar  avatar  avatar  avatar  avatar  avatar  avatar  avatar  avatar  avatar  avatar  avatar  avatar  avatar  avatar  avatar  avatar  avatar  avatar  avatar  avatar  avatar  avatar  avatar  avatar  avatar  avatar  avatar  avatar  avatar  avatar  avatar  avatar  avatar  avatar  avatar  avatar  avatar  avatar  avatar  avatar  avatar  avatar  avatar  avatar  avatar  avatar  avatar  avatar  avatar  avatar  avatar  avatar  avatar  avatar  avatar  avatar  avatar  avatar  avatar  avatar  avatar  avatar  avatar  avatar  avatar  avatar  avatar  avatar  avatar  avatar  avatar  avatar  avatar  avatar  avatar

cheatsheets's Issues

Missing ) in np.random.uniform

Thanks for the great cheatsheets!

I think there is a missing ) in

Z = np.random.uniform(0, 1, (8, 8)

under Matplotlib for Beginners/Choose (both imshow and contourf).

No pcolormesh referenced

Folks should be usingpcolormesh in general rather than imshow - imshow really only works for equally spaced pixels, and there is lots of data that is not laid out that way. However the cheatsheet doesn't mention pcolormesh.

Variable names should generally be lowercase

In many places we have uppercase variables, e.g.

X = np.linspace(0, 2 * np.pi, 100)
Y = np.sin(X)

and likewise then in the plot functions.

This is against PEP-8 naming conventions and IMHO sets a bad example. At least 1D arrays should be lowercase. One may debate on 2D arrays, which have a history of using uppercase letters in the Matplotlib docs.

Image for "Basic plots - plot" should hint at markers

Currently the image is just sine line, which could trick users in thinking that plot is for lines and scatter is for markers.

grafik

I propose to additionally show another set of values with markers, e.g. something like:

grafik

markevery

handout-intermediate.pdf, "Lines & markers"
Given X of length 1000, the plot with markevery=25 should mark 1000/25 = 40 points, but there are 20 of them on the figure, so it seems a bug to me. (If so, it matters also to the next example, in "Scales & projections").

Fix latex code

Latex code is a bit messy, it would need some cleanup

A better answer about "How I rotate tick labels"

The cheatsheets comment the method "ax.set_[xy]ticks(rotation=90)" to rotate ticks. However, it can cause confusion because the parameter "takes effect only if you pass labels"(official tutorial of ax.set_[xy]ticks(). So this is a incomplete form and not recommended.
As the official tutorial says, I suggest ax.tick_params(axis='x', rotation=90).

Simplifying code

Most, if not all, np., plt., ax., fig., and mpl. can be safely removed if importing * directly in the main name namespace. Currently there are so many useless repetitions, IMHO.

from matplotpib.pylab import *

would make things much cleaner and simple.

Font issue

I can compile the tex document with the font specs commented out.
However, with the fonts defined as in the document, e.g

\setmainfont{Source Serif Pro}[
  Path = fonts/source-serif-pro/SourceSerifPro-, Extension = .otf,
  UprightFont= Light,
  ItalicFont = LightIt,
  BoldFont   = Regular,
  BoldItalicFont = It]

it is looking for fonts that do not exist. E.g.
fonts/source-serif-pro/SourceSerifPro-Light.otf is not part of any of the linked google font sets.

Update Beginner Cheatsheet: fig.show โ†’ plt.show

In the beginner handout, there is a brief section on how to display a given plot

https://github.com/matplotlib/cheatsheets/blob/05fbbb90103b1c68f4922096b1e7290b7dac1a17/handout-beginner.tex#L90-L95C9

I wanted to start a small discussion on whether the call to fig.show() should be replaced by plt.show.

Since this is a beginner cheatsheet, the management of a blocking GUI loop is slightly out-of-scope. fig.show does not manage this loop (whereas plt.show does), new users may wonder why their plot disappears as quickly as it appears when using fig.show.

'right' and 'top' in plt.subplots_adjust() are not directly padding size

Very thankful of the cheatsheet, but I think there's a little problem.
In 'Axes adjustments' of the second cheatsheet, 'right' directly refers to the padding between subplots' right edge and figure's right edge. However it actually refers to the relative distance between subplots' right edge and figure's left edge. The same also applies to 'top'.

Add a top-level index.html

So that we have a nice target to point browsers to with links to the pdf and back to github.

This can probably be a static html page (not generated from sphinx).

Brazilian Portuguese translation

hello, there!
the PyLadies Brasil group is thinking about starting a Brazilian Portuguese translation of the cheatsheets and I wonder if there are specific guidelines for translations, i.e. where to save the translated files and so on, or if you are aware of any pt-br translation of this project that is ongoing.

if the answer is no for both questions, can we fork this repo and start? ๐Ÿ˜ƒ

Automatic building of the PDF and the PNG files

It would be nice to have an automatic building of the PDF and PNG for each commit but I don't know if it is possible with e.g. Travis. It would require a partial TeXLive installation and I'm not sure how to setup.

Also, some have been manually post-processed with pdfcrop (to remove white margin) and this should be automatized.

A Suggestion about CI/CD.

Perhaps, we can use the GitHub Action or other CI/CD tools to automatically compile and release these beautiful and useful files.

Spanish translation

Hello, congratulations on the work everyone has made so far.
I'm looking forwards to translate the cheatsheets to Spanish.

I've been told to open an issue to gather those who want to help, so here it is.

Matplotlib Deprecation Warning in /scripts/scales.py

As we execute /scripts/scales.py, we have the following warning :

scales.py:27: MatplotlibDeprecationWarning: The 'basex' parameter of __init__() has been renamed 'base' since Matplotlib 3.3; support for the old name will be dropped two minor releases later.
  ax.set_xscale("log", basex=10)
scales.py:39: MatplotlibDeprecationWarning: The 'basex' parameter of __init__() has been renamed 'base' since Matplotlib 3.3; support for the old name will be dropped two minor releases later.
  ax.set_xscale("symlog", basex=10, linthreshx=1)
scales.py:39: MatplotlibDeprecationWarning: The 'linthreshx' parameter of __init__() has been renamed 'linthresh' since Matplotlib 3.3; support for the old name will be dropped two minor releases later.
  ax.set_xscale("symlog", basex=10, linthreshx=1)

Has GitHub Pages been activated for this repo?

The cheatsheets that are automatically built should be available here, but I am getting a 404. If GH Pages has not been activated for the repo, that could be the cause. There may also be a problem with the project pages and having a custom domain for the organization pages, as discussed in isaacs/github#547.

Missing name style

Thanks for the great cheatsheets!

The first page in Matplotlib cheatsheets, chart "style name" missing in "Style" - plot (2,1), that looks like "ggplot"

Cursive font is not cursive

The line that should demonstrate a cursive font is printed with a regular sans fon (cheatsheet page 2 bottom left):
grafik

broken links on cheatsheets site

There are a couple of broken links in the navigation bar for the cheatsheets site https://matplotlib.org/cheatsheets, specifically the "Plot types" and "Release notes" links. Once current matplotlib dev version is released and the docs are published to https://matplotlib.org/stable, this would not be an issue; still, probably should be addressed.

Also, the search bar is a bit unnecessary, as it does not search the main site. Can the sidebar from the main site be integrated into the cheatsheets site. Or, maybe it is better to build the cheatsheets site in the matplotlib docs.

handout-beginner.pdf

Hello,

thank you for this great summary. In handout-beginner.pdf

Y1, Y1 = np.sin(X), np.cos(X)

should be

Y1, Y2 = np.sin(X), np.cos(X)

bytelinker

add candlestick cheat .

the most important thing on charting is finansal charts that matplotlib didnt work around it.
yes it have some libs and things but not sharply have do something for that.
please add cheatsheat for finansal and candlistic charts to help us thanks

Dash tuple is missing closing parenthesis

Thanks for publishing this cheatsheet. I learned about several features while reading through it.
In the Lines section, the example of using a dash tuple for linestyle is missing the closing parenthesis. I tried running your linestyles.py script, and it shows the closing parenthesis, so I guess it gets cropped when you assemble the whole thing in LaTeX.

Another minor suggestion: remove the /matplotlib from the end of the Stack Overflow help item, because it's not a valid URL. The PDF version of the cheatsheet has the full /questions/tagged/matplotlib in the link, but the PNG version might confuse people who try to type it in as listed.

Legend placement

Thank you for the awesome work!

Am I miss something? ... to me the strings for A-F are incorrect. The bbox_to_anchor seems fine though.

image

Cmap 'Blues' instead of 'Oranges'

There might be a typo in the tips & tricks handout where a Blues color map is called although an Oranges one is displayed:

image

For consistency, maybe we could use

cmap = plt.get_cmap("Oranges")

instead of

cmap = plt.get_cmap("Blues")

cheatsheets-2.png shows interpolation different for none vs None

If you look at the imagine cheatsheets-2.png linked in the README.md:
https://github.com/matplotlib/cheatsheets/blob/master/cheatsheets-2.png

in the interpolations image grid, the "none" version actually is using some sort of interpolation. This makes it seem like "none" and None are different, but they should not be.

When I run the interpolations.py script locally
(https://github.com/matplotlib/cheatsheets/blob/master/scripts/interpolations.py) I get the following:

interpolations.pdf

which has the correct top row.

The image in the repo should be updated.

Issue with build process

I am attempting to build this repo with gitbash in Windows 10 pro. I have cloned the repo to a folder /git/cheatsheets and created /git/cheatsheets/fonts with all the required sub-folders as described in the README. However, when running the python scripts in the scripts directory I am getting a failure of

"findfont: Font family ['Source Code Pro'] not found. Falling back to DejaVu Sans."

I am guessing I have put the fonts folder in the wrong location and/or finding the fonts on the Windows file system is not working as expected.

Any help would be appreciated.

how to use

i dont know how to work, feel terrible

Is Delicious font necessary?

Its license is not a common Free one, though that doesn't preclude it from being Free. However, before getting into those weeds, is it really needed? I don't see 'delicious' mentioned anywhere but the readme.

Consistent capitalization of section titles

Capitalization of section titles switches between all words starting with capital letters and only the first word starting with a capital letter; e.g.

  • Quick start
  • Ten Simple Rules
  • Ticks & labels
  • Scales & Projections

Choose one way and stick with it throughout.

Note: The Matplotlib docs only capitalize the first word of a section. I don't care if the cheat sheets use the same rule, as long as they are consistent within themselves.

Recommend Projects

  • React photo React

    A declarative, efficient, and flexible JavaScript library for building user interfaces.

  • Vue.js photo Vue.js

    ๐Ÿ–– Vue.js is a progressive, incrementally-adoptable JavaScript framework for building UI on the web.

  • Typescript photo Typescript

    TypeScript is a superset of JavaScript that compiles to clean JavaScript output.

  • TensorFlow photo TensorFlow

    An Open Source Machine Learning Framework for Everyone

  • Django photo Django

    The Web framework for perfectionists with deadlines.

  • D3 photo D3

    Bring data to life with SVG, Canvas and HTML. ๐Ÿ“Š๐Ÿ“ˆ๐ŸŽ‰

Recommend Topics

  • javascript

    JavaScript (JS) is a lightweight interpreted programming language with first-class functions.

  • web

    Some thing interesting about web. New door for the world.

  • server

    A server is a program made to process requests and deliver data to clients.

  • Machine learning

    Machine learning is a way of modeling and interpreting data that allows a piece of software to respond intelligently.

  • Game

    Some thing interesting about game, make everyone happy.

Recommend Org

  • Facebook photo Facebook

    We are working to build community through open source technology. NB: members must have two-factor auth.

  • Microsoft photo Microsoft

    Open source projects and samples from Microsoft.

  • Google photo Google

    Google โค๏ธ Open Source for everyone.

  • D3 photo D3

    Data-Driven Documents codes.