Coder Social home page Coder Social logo

mapbox / supercluster Goto Github PK

View Code? Open in Web Editor NEW
2.0K 139.0 296.0 308 KB

A very fast geospatial point clustering library for browsers and Node.

License: ISC License

JavaScript 100.00%
clustering algorithm computational-geometry javascript maps

supercluster's Introduction

supercluster Simply Awesome Build Status

A very fast JavaScript library for geospatial point clustering for browsers and Node.

const index = new Supercluster({radius: 40, maxZoom: 16});
index.load(points);

const clusters = index.getClusters([-180, -85, 180, 85], 2);

Clustering 6 million points in Leaflet:

clustering demo on an interactive Leaflet map

Supercluster was built to power clustering in Mapbox GL JS. Read about how it works on the Mapbox blog.

Install

Install using NPM (npm install supercluster) or Yarn (yarn add supercluster), then:

// import as a ES module in Node
import Supercluster from 'supercluster';

// import from a CDN in the browser:
import Supercluster from 'https://esm.run/supercluster';

Or use it with an ordinary script tag in the browser:

<script src="https://unpkg.com/[email protected]/dist/supercluster.min.js"></script>

Methods

load(points)

Loads an array of GeoJSON Feature objects. Each feature's geometry must be a GeoJSON Point. Once loaded, index is immutable.

getClusters(bbox, zoom)

For the given bbox array ([westLng, southLat, eastLng, northLat]) and integer zoom, returns an array of clusters and points as GeoJSON Feature objects.

getTile(z, x, y)

For a given zoom and x/y coordinates, returns a geojson-vt-compatible JSON tile object with cluster/point features.

getChildren(clusterId)

Returns the children of a cluster (on the next zoom level) given its id (cluster_id value from feature properties).

getLeaves(clusterId, limit = 10, offset = 0)

Returns all the points of a cluster (given its cluster_id), with pagination support: limit is the number of points to return (set to Infinity for all points), and offset is the amount of points to skip (for pagination).

getClusterExpansionZoom(clusterId)

Returns the zoom on which the cluster expands into several children (useful for "click to zoom" feature) given the cluster's cluster_id.

Options

Option Default Description
minZoom 0 Minimum zoom level at which clusters are generated.
maxZoom 16 Maximum zoom level at which clusters are generated.
minPoints 2 Minimum number of points to form a cluster.
radius 40 Cluster radius, in pixels.
extent 512 (Tiles) Tile extent. Radius is calculated relative to this value.
nodeSize 64 Size of the KD-tree leaf node. Affects performance.
log false Whether timing info should be logged.
generateId false Whether to generate ids for input features in vector tiles.

Property map/reduce options

In addition to the options above, Supercluster supports property aggregation with the following two options:

  • map: a function that returns cluster properties corresponding to a single point.
  • reduce: a reduce function that merges properties of two clusters into one.

Example of setting up a sum cluster property that accumulates the sum of myValue property values:

const index = new Supercluster({
    map: (props) => ({sum: props.myValue}),
    reduce: (accumulated, props) => { accumulated.sum += props.sum; }
});

The map/reduce options must satisfy these conditions to work correctly:

  • map must return a new object, not existing properties of a point, otherwise it will get overwritten.
  • reduce must not mutate the second argument (props).

TypeScript

Install @types/supercluster for the TypeScript type definitions:

npm install @types/supercluster --save-dev 

Developing Supercluster

npm install       # install dependencies
npm run build     # generate dist/supercluster.js and dist/supercluster.min.js
npm test          # run tests

supercluster's People

Contributors

andrewharvey avatar cherniavskii avatar connum avatar deniscarriere avatar dependabot[bot] avatar donmccurdy avatar fspoettel avatar itsjgf avatar jingsam avatar joewoodhouse avatar johannchopin avatar mattlubner avatar mourner avatar nickrobison avatar sgillies avatar thomasg77 avatar tmcw avatar tuukka avatar wagao29 avatar waldyrious avatar

Stargazers

 avatar  avatar  avatar  avatar  avatar  avatar  avatar  avatar  avatar  avatar  avatar  avatar  avatar  avatar  avatar  avatar  avatar  avatar  avatar  avatar  avatar  avatar  avatar  avatar  avatar  avatar  avatar  avatar  avatar  avatar  avatar  avatar  avatar  avatar  avatar  avatar  avatar  avatar  avatar  avatar  avatar  avatar  avatar  avatar  avatar  avatar  avatar  avatar  avatar  avatar  avatar  avatar  avatar  avatar  avatar  avatar  avatar  avatar  avatar  avatar  avatar  avatar  avatar  avatar  avatar  avatar  avatar  avatar  avatar  avatar  avatar  avatar  avatar  avatar  avatar  avatar  avatar  avatar  avatar  avatar  avatar  avatar  avatar  avatar  avatar  avatar  avatar  avatar  avatar  avatar  avatar  avatar  avatar  avatar  avatar  avatar  avatar  avatar  avatar  avatar

Watchers

 avatar  avatar  avatar  avatar  avatar  avatar  avatar  avatar  avatar  avatar  avatar  avatar  avatar  avatar  avatar  avatar  avatar  avatar  avatar  avatar  avatar  avatar  avatar  avatar  avatar  avatar  avatar  avatar  avatar  avatar  avatar  avatar  avatar  avatar  avatar  avatar  avatar  avatar  avatar  avatar  avatar  avatar  avatar  avatar  avatar  avatar  avatar  avatar  avatar  avatar  avatar  avatar  avatar  avatar  avatar  avatar  avatar  avatar  avatar  avatar  avatar  avatar  avatar  avatar  avatar  avatar  avatar  avatar  avatar  avatar  avatar  avatar  avatar  avatar  avatar  avatar  avatar  avatar  avatar  avatar  avatar  avatar  avatar  avatar  avatar  avatar  avatar  avatar  avatar  avatar  avatar  avatar  avatar  avatar  avatar  avatar  avatar  avatar  avatar  avatar

supercluster's Issues

Filter?

Hello. Awesome cluster, thank you!
I have a trouble... How to filter points?

All points have "test": (1-5) in "properties";

[Suggestion] add the input validation function

Thanks for this great module. it is quite helpful for my google map.

Suggestion: I am suggesting to add a input validation function to validate the input points are all GEOJSON.feature object.

Why: I saw the in readme. it have said it the points should be an array of GEOJSON.feature objects.

Loads an array of GeoJSON.Feature objects. Each feature's geometry must be a GeoJSON.Point. Once loaded, index is immutable.

but for some people who are not quite familiar with GEOJSON.feature object(just like me), it may have some problems. because I am missing the properties field for each point, the load function and getClusters function still work, but today when I use the getLeaves function, it failed. because the points didn't have properties field

var props = children[i].properties;

So I am suggesting add the input validation function. throw a error if the input points are not valid GEOJSON.feature object

if you are ok with that, I can open a PR for it:)

Server implementation

Gday,

Just wanted to leave a note here to say that I've started work on a node.js server implementation of supercluster. My aim is to support data sources such as databases (using knex) as well as files such as shapefiles, geojson, csv etc. I then hope to make an accompanying client-side plugins for leaflet.

I've already got a functioning prototype but it's a bit rough so I'd like to do a bit of tidying before my first commit. Once the first commit is up I'll post back and close off this issue :)

Cheers

Getting the bounds of a cluster?

Hi, my understanding of kdbush is that it groups the points into rectangular areas using median lines. If that is the case, is there anyway for a given cluster to get the bounding box of lat/long for the points it represents?

Here is an example use-case I am working on where this would be helpful:
I have a server-side data source with 50k geopoints that have various metrics associated with them. I pull those 50k points down client side and render them onto a map using supercluster. I now want to implement a details-on-demand mechanism when a user hovers a cluster. Specifically, when hovering a single cluster, I want to show a tooltip with additional, dynamically calculated data about the points within that cluster. To get this calculated data, I need to run a new query against my data source, but only for the points contained within this cluster.

Today, the way I am doing this is by getting all of the children points of the cluster and creating a query with them. This can create an excessive query if you have lots of points and is not the most performant solution. If I had the bounding box that contains the points instead, I could run a smaller and faster query that uses the lat/lng ranges to filter to the appropriate points, rather than having to ship a query with a list of every point in my cluster.

Optimize supercluster to work correctly with google maps

I use supercluster with google maps. Everything works as expected except two situations:

  1. Google maps returns bounding box from -180 to 180, so when on the map we see e.g. Pacific ocean the lngs of bbox will be e.g. from 100 to -100. In this case supercluster will return nothing. As I mentioned here I reed from 100 to 180, and then from -180 to -100 to get the correct result.
  2. Same Issue if google map has zoom level 1 or 2 when it starts to repeat. In this case we have lngs of bbox e.g. from -180 to e.g. -170. So we see more then 360deg wide map, but supercluster will read only those 10 degrees.

map

Sorry I cannot make a public example right now.

Use supercluster without GeoJson

#Hey guys,

is there a way to use the supercluster without GeoJson?
Meaning i just use all my mapbox-gl marker objects.

thanks,
Stav

Overlapping Clusters

Is there a correct way to create the component so the cluster markers don't overlap?

I see in the demo animation that the nodes pretty much dont overlap at all, however in my implementation there are only 3 clusters for example and they pretty much overlap by around 10-15% over an edge like a triangle. Enough that the centered text is covered by the overlap.

How to add different icons for markers?

Thanks a lot for this super cool plugin.

I have a question regarding adding custom icons for markers in a cluster.
Currently, it loads the default marker icon that comes along with leaflet.

How can we add our own custom icons for the markers? The createClusterIcon method in the demo specifies an iconUrl property. I changed it to another image URL, but it still displays the default icon.

I have 4 different types of markers and depending on the type of marker I need to assign it a specific marker icon.

getClusters always returns an empty array

Not sure what I'm doing wrong here, but getClusters is always returning an empty array.

Here are some points I am using:

0 {geometry: {type: "Point", coordinates: [51.042419, -113.397727]}, properties: {}, type: "Feature"}
1 {geometry: {type: "Point", coordinates: [51.042686, -113.397614]}, properties: {}, type: "Feature"}
2 {geometry: {type: "Point", coordinates: [51.042611, -113.397767]}, properties: {}, type: "Feature"}
3 {geometry: {type: "Point", coordinates: [51.042849, -113.39826]}, properties: {}, type: "Feature"}
4 {geometry: {type: "Point", coordinates: [51.043484, -113.396595]}, properties: {}, type: "Feature"}
5 {geometry: {type: "Point", coordinates: [51.043247, -113.395846]}, properties: {}, type: "Feature"}
6 {geometry: {type: "Point", coordinates: [51.043266, -113.395568]}, properties: {}, type: "Feature"}
7 {geometry: {type: "Point", coordinates: [51.043353, -113.395342]}, properties: {}, type: "Feature"}
8 {geometry: {type: "Point", coordinates: [51.043704, -113.394671]}, properties: {}, type: "Feature"}
9 {geometry: {type: "Point", coordinates: [51.043811, -113.393873]}, properties: {}, type: "Feature"}
10 {geometry: {type: "Point", coordinates: [51.043629, -113.394354]}, properties: {}, type: "Feature"}
11 {geometry: {type: "Point", coordinates: [51.0435, -113.394573]}, properties: {}, type: "Feature"}
12 {geometry: {type: "Point", coordinates: [51.043531, -113.394751]}, properties: {}, type: "Feature"}
13 {geometry: {type: "Point", coordinates: [51.043327, -113.395088]}, properties: {}, type: "Feature"}
14 {geometry: {type: "Point", coordinates: [51.043133, -113.39569]}, properties: {}, type: "Feature"}
15 {geometry: {type: "Point", coordinates: [51.042978, -113.396032]}, properties: {}, type: "Feature"}

bbox:

0 -135.60500260238283
1 41.033276291862975
2 -91.19053139761719
3 61.051945708137026

zoomLevel = 4

Incorrect cluster location

Hello,
I have a case where 3 points, which are located near Sydney, are clusterd together with cluster coordinates located in south Africa.
I give you a simple example : https://codepen.io/tonai/pen/weLgvq?editors=0010
The longitude should be about 150 but is actually about 30, and I don't understand why...
Can you help me with that problem ?
Thanks,

`Cannot read property 'x' of undefined` error

Before anything, I'd like to thank you very much for this package!

I don't have an idea why this is happening, but sometimes (apparently randomly) this error occur when calling .getClusterExpansionZoom() method.

Cannot read property 'x' of undefined

Object.getChildren
index.js:84

The getChildren() method tries to read from origin.x, but origin variable is undefined.
The origin var, as we can see, is created in the following line:

var origin = this.trees[clusterZoom + 1].points[clusterId];

It is undefined because (as in one of my debuggings) clusterZoom = 12 and clusterId = 21, and this.trees[13].points only have 19 entries (0 to 18), thus, this.tree[13].points[21] returns undefined.

Any ideas why is that error occurring? Thanks! =)

How can I use getClusterExpansionZoom?

I have found getClusterExpansionZoom in the documentation.

I know how to use it, but it only returns a zoom level, so what can I use it for?

I guess I will have to translate the zoom level to latitudeDelta and longitudeDelta if used with Google Maps, but how is this done and how can I get latitude and longitude?

Is getClusterExpansionZoom returning the zoom level given that latitude and longitude are specified at the current latitude and longitude of the cluster?

Cannot read property 'range' of undefined

image
supercluster.min.js:1 Uncaught TypeError: Cannot read property 'range' of undefined
at e.getClusters (supercluster.min.js:1)

Someone knows how to solve it? thanks

Can't access cluster leaves

Hey. Thanks a lot for your awesome script.

Here's my issue:

  • Log: TypeError: Cannot read property 'cluster' of undefined at SuperCluster._appendLeaves (https://unpkg.com/[email protected]/dist/supercluster.js:153:22)

  • Codepen: https://codepen.io/jzzfs/pen/ybavpE

  • Intention: I want to retrieve all markers / marker indexes belonging to a cluster after a certain zoom level (>= 16).

  • Problem: Doesn't matter if I call getLeaves or getChildren -- the response is always some kind of an error. I declare the supercluster on line 125 and pass a supercluster-based index and a valid zoom on line 5298.

  • Testing: Click your way through the clusters until they disappear and individual markers are shown and observe the log. (might need to use the devtools log because some log entries are too long for the codepen console)

Related question: is there a way to access the LatLng bounds of a cluster?

Many thanks in advance!
/cc @mourner

choose the weighted center or center?

Searching for neighbors in rtree use the weighted center. Should build rtree using the weighted coordinates either?
I think the two places should use the same one, weighted center or center.
Maybe the weighted center is better

Carry generic properties

I wonder if it is possible to carry the properties for each marker so that you could do a eg a pop-up on each marker/summary pop-up for each cluster

Geojson Example

Hi,
Can you share your ('../trees-na.json') in Demo file , please ?
I need to show this file because with my geojson, your demo doesn't work.
Thank you

Where's trees-na.json?

Hi Vladimir โ€“ fired up the demo, where do I find the trees-na.json?
Am I supposed to put my own data in there? Don't have 40 megs worth of point data
lying around atm :)

bounding box queries over the dateline are not always returning results

When the bounding box covers bother sides of 0 (Quandrant 4 and 1 of a circle). for example index.getClusters([2, -10, -178, 10], 1) I expect it to return the points from 0 to 2 and -178 to -180.

I've wrote a test:

describe('group', () => {
  const createSpot = (horizonral, vertical) => {
    return {
      type: "Feature",
      geometry: {
        type: "Point",
        coordinates: [horizontal, vertical]
      }
    }
  }

  var index = supercluster({
    radius: 0.01,
    maxZoom: 1,
    extent: 512
  })

  it('should group spots near the edge', () => {
    index.load([
      createSpot(-179.989, 0),
      createSpot(-179.990, 0),
      createSpot(-179.991, 0),
      createSpot(-179.992, 0),
    ])

    const spots = index.getClusters([2, -10, -178, 10], 1)

    return expect(spots.length).toEqual(4)
  })
})

But it fails.
Am I missing something? Isn't the horizontal range -180 to 180 (vertical 90 to -90)? http://wiki.openstreetmap.org/wiki/Bounding_Box

getLeaves returns 'No cluster with the specified id'

I am using [email protected] and [email protected] to get the list of features in a clicked cluster.

I saw that in V3.0.0 of supercluster the zoom factor is encoded into the cluster_id.

I am using a GeoJSONLayer to do the clustering (which may not be the right way to do it for supercluster) and the correct features are not returned OnClick.

Clicking some clusters throws a run-time error:

'No cluster with the specified id'.

Any idea why no features or the wrong features are being returned?

WebpackBin Showing a working example of the issue.

Any help would be appreciated.

Clustering loading all the points data at a time

Currently we need to add all the coordinates at time in the source on which clustering is performed depending on the zoom level. Here we have a security problem, these coordinates are our critical data we don't want to expose all the data in single api call and load it into the source,which may lead others to get access to all this data in simple call. Is there any general practice to avoid this. Rather than loading all the data at time and perform clustering on that. I want to load aggregated data points i.e clustered data points depending on the zoom level and bounds,only certain level of zoom in will show the real coordinates of the data points, so that I don't have to reveal all my coordinates in single call.

Google Maps pass dateline infinite loop in getCluster fix

RN 0.51
supercluster 3.0.2
bug fatal crash

hi, i'm using a RN maps with clustering using supercluster.
ios(maps) is fine,
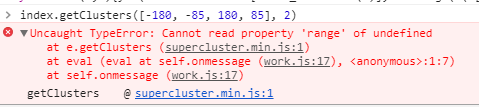
Android(Google maps) is crashing when i go over the international dateline.

i tried to debug it to understand the problem,
and i noticed when i pass the dataline the zoom becomes NaN,

log: getClusters() => bbox: [31.949437949806452,28.57097009999041,39.08726217225194,38.12259985097466] /// zoom: 6 index.js:76 getClusters() => bbox: [27.481803596019745,21.95397985485612,44.253987818956375,44.388517099821314] /// zoom: 5 index.js:76 getClusters() => bbox: [27.481803596019745,21.95397985485612,44.253987818956375,44.388517099821314] /// zoom: 5 index.js:76 getClusters() => bbox: [21.66165076196194,15.766136279534585,48.27204890549183,51.094824684911025] /// zoom: 4 index.js:76 getClusters() => bbox: [21.66165076196194,15.766136279534585,48.27204890549183,51.094824684911025] /// zoom: 4 index.js:76 getClusters() => bbox: [-1.530294455587864,17.282984755008922,25.080103687942028,52.08827465896199] /// zoom: 4 index.js:76 getClusters() => bbox: [-1.530294455587864,17.282984755008922,25.080103687942028,52.08827465896199] /// zoom: 4 index.js:76 getClusters() => bbox: [-20.88091470301151,25.147920463899432,5.729483440518378,57.029943833266906] /// zoom: 4 index.js:76 getClusters() => bbox: [-20.88091470301151,25.147920463899432,5.729483440518378,57.029943833266906] /// zoom: 4 index.js:76 getClusters() => bbox: [-46.071707122027874,26.01141458859852,-19.461308978497982,57.55263758644087] /// zoom: 4 index.js:76 getClusters() => bbox: [-46.071707122027874,26.01141458859852,-19.461308978497982,57.55263758644087] /// zoom: 4 index.js:76 getClusters() => bbox: [-52.99869161099196,26.159960960245726,-26.38829346746207,57.64218567906998] /// zoom: 4 index.js:76 getClusters() => bbox: [-52.99869161099196,26.159960960245726,-26.38829346746207,57.64218567906998] /// zoom: 4 index.js:76 getClusters() => bbox: [-58.12739945948123,26.166534358525205,-31.517001315951354,57.64614582103335] /// zoom: 4 index.js:76 getClusters() => bbox: [-58.12739945948123,26.166534358525205,-31.517001315951354,57.64614582103335] /// zoom: 4 index.js:76 getClusters() => bbox: [-64.18189521878958,26.286706263129133,-37.57149707525968,57.71850616557583] /// zoom: 4 index.js:76 getClusters() => bbox: [-64.18189521878958,26.286706263129133,-37.57149707525968,57.71850616557583] /// zoom: 4 index.js:76 getClusters() => bbox: [-70.77576477080584,25.844155644914174,-44.165366627275944,57.451679472303844] /// zoom: 4 index.js:76 getClusters() => bbox: [-70.77576477080584,25.844155644914174,-44.165366627275944,57.451679472303844] /// zoom: 4 index.js:76 getClusters() => bbox: [-78.09848707169294,26.726982821742375,-51.48808892816306,57.98301453672301] /// zoom: 4 index.js:76 getClusters() => bbox: [-78.09848707169294,26.726982821742375,-51.48808892816306,57.98301453672301] /// zoom: 4 index.js:76 getClusters() => bbox: [-84.74580433219671,28.24800679702512,-58.13540618866682,58.88967162971917] /// zoom: 4 index.js:76 getClusters() => bbox: [-84.74580433219671,28.24800679702512,-58.13540618866682,58.88967162971917] /// zoom: 4 index.js:76 getClusters() => bbox: [-95.2046673372388,29.182115200051577,-68.59426919370888,59.44110737005841] /// zoom: 4 index.js:76 getClusters() => bbox: [-95.2046673372388,29.182115200051577,-68.59426919370888,59.44110737005841] /// zoom: 4 index.js:76 getClusters() => bbox: [-103.39012317359447,29.246262355168298,-76.77972503006458,59.47882848427405] /// zoom: 4 index.js:76 getClusters() => bbox: [-103.39012317359447,29.246262355168298,-76.77972503006458,59.47882848427405] /// zoom: 4 index.js:76 getClusters() => bbox: [-114.30097728967668,29.511485532756517,-87.69057914614676,59.63459163538469] /// zoom: 4 index.js:76 getClusters() => bbox: [-114.30097728967668,29.511485532756517,-87.69057914614676,59.63459163538469] /// zoom: 4 index.js:76 getClusters() => bbox: [-127.56165236234666,30.021064648696914,-100.95125421881677,59.93297014263741] /// zoom: 4 index.js:76 getClusters() => bbox: [-127.56165236234666,30.021064648696914,-100.95125421881677,59.93297014263741] /// zoom: 4 index.js:76 getClusters() => bbox: [-142.22727689892054,30.329179932589817,-115.61687875539064,60.112818776556786] /// zoom: 4 index.js:76 getClusters() => bbox: [-142.22727689892054,30.329179932589817,-115.61687875539064,60.112818776556786] /// zoom: 4 index.js:76 getClusters() => bbox: [-153.265469558537,30.992003531529186,-126.65507141500711,60.49828595403742] /// zoom: 4 index.js:76 getClusters() => bbox: [-153.265469558537,30.992003531529186,-126.65507141500711,60.49828595403742] /// zoom: 4 index.js:76 getClusters() => bbox: [-161.56646389514208,31.717398832011405,-134.9560657516122,60.91793846852011] /// zoom: 4 index.js:76 getClusters() => bbox: [-161.56646389514208,31.717398832011405,-134.9560657516122,60.91793846852011] /// zoom: 4 index.js:76 getClusters() => bbox: [-169.04986124485734,32.34824376087369,-142.4394631013274,61.28104908147025] /// zoom: 4 index.js:76 getClusters() => bbox: [-169.04986124485734,32.34824376087369,-142.4394631013274,61.28104908147025] /// zoom: 4 index.js:76 getClusters() => bbox: [-176.35269194841385,33.280282511446096,-149.74229380488396,61.814442645245144] /// zoom: 4 index.js:76 getClusters() => bbox: [-176.35269194841385,33.280282511446096,-149.74229380488396,61.814442645245144] /// zoom: 4 index.js:76 getClusters() => bbox: [-182.32034280896187,34.29870892627775,-155.70994466543198,62.393155549579554] /// zoom: 4 index.js:76 getClusters() => bbox: [-182.32034280896187,34.29870892627775,-155.70994466543198,62.393155549579554] /// zoom: 4 index.js:76 getClusters() => bbox: [525.387192517519,36.78078522288718,-168.0024093389511,63.78617953197706] /// zoom: NaN index.js:76 getClusters() => bbox: [525.387192517519,36.78078522288718,180,63.78617953197706] /// zoom: NaN index.js:76 getClusters() => bbox: [525.387192517519,36.78078522288718,180,63.78617953197706] /// zoom: NaN index.js:76 getClusters() => bbox: [525.387192517519,36.78078522288718,180,63.78617953197706] /// zoom: NaN index.js:76 getClusters() => bbox: [525.387192517519,36.78078522288718,180,63.78617953197706] /// zoom: NaN index.js:76 getClusters() => bbox: [525.387192517519,36.78078522288718,180,63.78617953197706] /// zoom: NaN index.js:76 getClusters() => bbox: [525.387192517519,36.78078522288718,180,63.78617953197706] /// zoom: NaN index.js:76 getClusters() => bbox: [525.387192517519,36.78078522288718,180,63.78617953197706] /// zoom: NaN index.js:76 getClusters() => bbox: [525.387192517519,36.78078522288718,180,63.78617953197706] /// zoom: NaN index.js:76 getClusters() => bbox: [525.387192517519,36.78078522288718,180,63.78617953197706] /// zoom: NaN index.js:76 getClusters() => bbox: [525.387192517519,36.78078522288718,180,63.78617953197706] /// zoom: NaN index.js:76 getClusters() => bbox: [525.387192517519,36.78078522288718,180,63.78617953197706] /// zoom: NaN index.js:76 getClusters() => bbox: [525.387192517519,36.78078522288718,180,63.78617953197706] /// zoom: NaN index.js:76 getClusters() => bbox: [525.387192517519,36.78078522288718,180,63.78617953197706] /// zoom: NaN index.js:76 getClusters() => bbox: [525.387192517519,36.78078522288718,180,63.78617953197706] /// zoom: NaN index.js:76 getClusters() => bbox: [525.387192517519,36.78078522288718,180,63.78617953197706] /// zoom: NaN index.js:76 getClusters() => bbox: [525.387192517519,36.78078522288718,180,63.78617953197706] /// zoom: NaN

that results in an endless loop of getCluster -> crash

Click on a cluster to zoom in upon it?

Hi Vladimir ...
tnx so much for you great js mapping libraries, I am a so great fun (and user) of ...
I have read your Mapbox post on this Supercluster library, (really super ...) and cloned it for testing purposes.
I would like to test it in a project of mine, in place of the markercluster library, as I have got more than 20.000 pois to render and manage quickly.
I noticed that there is not "zoom on click" event on the (super)cluster, isn't it?
Is there any set up to activate it, or this is (simply) not yet implemented? (Any plan on this? ... on this latter case.)

Italo

Easy way to get number of children in a cluster?

I'm drawing custom markers for features in React Native, and I wondered if I can easily get a child count out of a geoJSON Feature object, without iterating through them all? Such as a "childCount" property?

I'm trying to count children something like this, but it seems to only work at certain zoom levels. I guess they tend to get nested deeper in the tree so I'd have to iterate until I get them?

if( place.properties.hasOwnProperty('cluster_id') ) {
    const clusterKids = this.state.mapSupercluster.getChildren(place.properties.cluster_id, this.state.lastMapZoom);
    text = clusterKids.length;
} else {
    text = place.properties.name;
}

Thanks!

Using with Web Mercator

I am using this library with point data that is already in web mercator. Currently, I'm converting the points into lat/long.

I see the comments for lngX and latY functions says that they convert "longitude/latitude" to spherical mercator in [0..1] range", but I'm not understanding how I would get a similar 0..1 number directly from web mercator coordinates. Any help on that would be greatly appreciated.

Thanks much.

missing file supercluster.js

I'm running the demo and I'm missing the file supercluster.js. Can you post that, or do you know why I'm getting that error? This was after 'npm install'
Thanks! Excited to get this working!

Add a getBounds() / getBBox() method

A common use case in Leaflet is to set the initial map view using the fitBounds() method on a dataset.

At the moment, supercluster doesn't have any way of returning its bounds, although I guess rbush / kdbush would probably be able to return it in O(1) time.

As a workaround my only idea is to use a temporary GeoJSON group (not added to L.Map) and use it to calculate the fitBounds() of the dataset. This workaround is quite bad both for performance and memory reasons.

About the format of getBounds / getBBox: I think a simple [W, S, E, N] array would be a rational choice without adding any framework dependencies.

Weight attribute

Hi,

Have you an idea in order to implement a weight attribute ?

Currently all items have a weight of 1 (Add 1 to cluster count).

I have some pre-clustering layers(for each zoom level) on a server side with each feature contains the count of included smallest features.

Could we specify an attribute to read in order to increase the count for each feature ?

    index = supercluster({
        log: true,
        radius: 60,
        extent: 256,
        maxZoom: 17
}).load(geojson.features, 'measure_count');

So super cluster would read feature.properties.measure_count if the property is not found then it fallback by default to 1 increment to point_count.

The project prune cluster has this weight feature https://github.com/SINTEF-9012/PruneCluster

Thanks

MinZoom clustering not working

i am passing minzoom as 3 to the superclusterer, but the clusterer is not clustering the item below the zoom level 6.

Unexpected clustering result

I'm experiencing a strange behaviour of 'disappearing' markers on my map when wrapping my markers with supercluster:

jan-28-2017 11-07-08

I managed to boil down the error to that: (jest syntax)

import supercluster from 'supercluster' // 2.2.0

test('get clusters', () => {
    const index = supercluster({
        radius: 40,
        maxZoom: 16
    })

    index.load([{
        geometry: {
            coordinates: [76, 17.7]
        }
    }])

    let clusters

    clusters = index.getClusters([18,-61,83,162], 1)
    expect(clusters.length).toBe(1) // as expected

    clusters = index.getClusters([18,-61,83,162.3], 1) // slightly different borders
    expect(clusters.length).toBe(1) // fails, clusters length === 0

});

I suspect a rounding error due to the following observations:

  1. Changing just one of the border components from 162 to 162.3 causes this unexpected behaviour
  2. Rounding down the coordinate [76, 17.7] to [76, 17] returns one cluster element as expected in both test cases

Or am I doing something wrong here?

Leaflet integration with layer state

The recommended Leaflet integration of clearLayers() + addData() on moveend discards any layer state on each map movement, so it is not possible to open a popup with autoPan: true for example, or to simply keep a popup open while panning the map (they would simply close on moveend).

One workaround is to save an id or hash of layers with open popups and try to loop through them and reopen each after addData(), but this is very inefficient and introduces quite a lot of client side code trying to load layer state on each move.

I believe that supercluster would prefer to be a framework independent tool, so a deeper Leaflet integration would probably need to stay out of this repo.

What is your plan and recommendation for supercluster in Leaflet?

  • Should someone write a leaflet-supercluster wrapper which tries to implement state handling?
  • If so, what would be your recommended architecture for it?

Switching to markers instead of clusters

Thank you for the library.

I have supercluster on the server side to calculate and cache clustering for low zoom levels, and I switch to client side leaflet markers at street level.

I want to be able to show markers, instead of clusters, when there are not many markers on the screen, regardless of the zoom level. My main problem is that since I am using a stateless 'tile' based API (/tile/:z/:x/:y.json) to load the clusters there is no way to make sure if the adjacent tile is also sparse so clusters and markers get mix together, especially when there is a body of water on the map.

What is the best solution for handling this? I was thinking about querying adjacent tiles as well before returning the results but not sure if it adds to much performance penalty making api calls 9 times slower.

Thanks

getLeaves returns empty object

getLeaves function in supercluster 3.0.0 returns an empty object instead of the points of a cluster. 2.3.0 works as intended.

Converting to vector tile

(Apologies if this issue is better suited for geojson-vt. I was torn on where to post and will happily transfer it if needed)

getTile returns an object that can be passed to geojson-vt, and appears to be the intermediate projected JSON produced by the convert method of geojson-vt. However, I don't see any methods for creating a vector tile using geojson-vt with this object. Is there an API that is not documented for this operation?

Of course, one could also call getClusters instead, and pass that resultant GeoJSON to geojson-vt and call getTile on that index instead. However, it seems like it would be faster to user supercluster's getTile method instead.

Thanks!

Recommend Projects

  • React photo React

    A declarative, efficient, and flexible JavaScript library for building user interfaces.

  • Vue.js photo Vue.js

    ๐Ÿ–– Vue.js is a progressive, incrementally-adoptable JavaScript framework for building UI on the web.

  • Typescript photo Typescript

    TypeScript is a superset of JavaScript that compiles to clean JavaScript output.

  • TensorFlow photo TensorFlow

    An Open Source Machine Learning Framework for Everyone

  • Django photo Django

    The Web framework for perfectionists with deadlines.

  • D3 photo D3

    Bring data to life with SVG, Canvas and HTML. ๐Ÿ“Š๐Ÿ“ˆ๐ŸŽ‰

Recommend Topics

  • javascript

    JavaScript (JS) is a lightweight interpreted programming language with first-class functions.

  • web

    Some thing interesting about web. New door for the world.

  • server

    A server is a program made to process requests and deliver data to clients.

  • Machine learning

    Machine learning is a way of modeling and interpreting data that allows a piece of software to respond intelligently.

  • Game

    Some thing interesting about game, make everyone happy.

Recommend Org

  • Facebook photo Facebook

    We are working to build community through open source technology. NB: members must have two-factor auth.

  • Microsoft photo Microsoft

    Open source projects and samples from Microsoft.

  • Google photo Google

    Google โค๏ธ Open Source for everyone.

  • D3 photo D3

    Data-Driven Documents codes.