Before we move with some basic data analysis, we need to quickly go through a few basic concepts. This lesson will introduce a few new concepts , which we shall revisit and look in more detail during later section on statistics.
You will be able to:
- Differentiate between statistical distributions as populations or samples
- Understand the types of statistical testing approaches
- Understand z-table and use sciPy to get z probabilities
- Set up null and alternative hypotheses for statistical significance testing
- Understand and explain the role of p-values, and significance threshold towards statistical significance
Statistical significance is one of those terms that is often used when someone claims that some data collection and analysis proves a point (or hypothesis). The terminology associated with statistical significance is usually not well understood and results are accepted by masses, however, it is a simple idea that can be understood fairly easily.
Statistical significance is mainly developed using samples and populations, hypothesis testing, the normal distribution, and p values. In this lesson, we shall build an understanding of this concept based on the statistical concepts we have studied so far.
Let's first look at how we differentiate distributions as samples and populations.
The first step of every statistical analysis you will perform is the population vs sample check or to determine whether the data you are dealing with is a population or a sample.
A population is the collection of all items of interest to our study and is usually denoted with an uppercase N. The numbers we’ve obtained when using a population are called parameters.
A sample is a subset of the population and is denoted with a lowercase n, and the numbers we’ve obtained when working with a sample are called statistics.
Let’s say we want to make a survey of the job prospects of the students studying in the Flatiron School. First question we would ask is:
You can go ahead and contact all the students studying Flatiron school campuses throughout USA and UK. But that would not be the whole population of Flatiron students. A lot of students take Flatiron's courses in an online mode. Including those students from all over the world would make a COMPLETE student population at Flatiron. Also, by the time you finish contacting all these students, you would realize that a lot of new students have enrolled onto the courses since you last surveyed.
So we see populations are hard to describe and inspect in real life.
A sample, however, is much easier to describe and inspect. It is less time consuming and less costly. Time and resources are the main reasons we prefer drawing samples, compared to analyzing an entire population. So, let’s draw a sample.
As we first wanted to do, we can just go to the New York campus. We can visit during the lunch hour in the canteen, because we know it will be full of people. We can then interview 50 of them. This would be a called a student sample.

So what are the chances these 50 can provide us answers that are a true representation of the whole student population of Flatiron globally?. You guessed it, the chances are pretty thin. The sample is neither random nor representative of whole population.
A random sample is collected when each member of the sample is chosen from the population strictly by chance. We must ensure each member is equally likely to be chosen.
So when we spoke to 50 students in the canteen, we violated both conditions. Students were not chosen by chance, they happened to be a group of students who were there for lunch. Most students probably did not even get the chance to be chosen, as they went out for lunch. Thus, we conclude the sample was not random.
A representative sample is a subset of the population that accurately reflects the members of the entire population.
Our sample was not random, but was it representative?
Our sample represented the people who have lunch at the canteen. Had our survey been about job prospects of Flatiron students who eat in the campus canteen, we would have done well.
By now, you must be wondering how to draw a sample that is both random and representative. Well, the safest way would be to get access to the student database and contact individuals in a random manner.

We said populations are hard to define and observe. Then, we saw that sampling is difficult. But samples have two big advantage: First,
- After you have experience, it is not that hard to recognize if a sample is representative.
- Statistical tests are designed to work with incomplete data; thus, making a small mistake while sampling is not always a problem.
Great, so now that we have got this out of the way, we can move on with statistical testing.
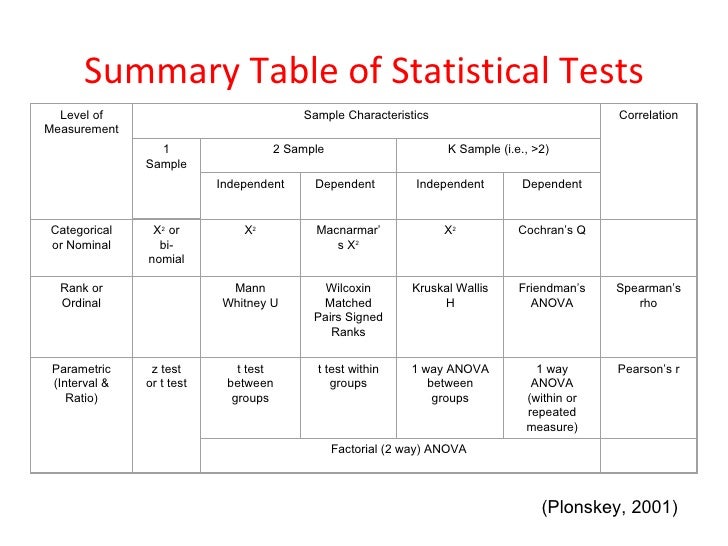
Not really, there are a huge number of statistical tests and we always select the one that best fits our research design. This link provides a quick introduction to a number of testing criteria. We shall cover some of these in later sections. Heres a quick summary of some of these tests.
Right now, lets talk about the most basic type of statistical testing technique called a one-sample z-test.
The one-sample Z test is used when we want to know whether our sample comes from a particular population. For instance, when collecting data from successive cohorts of students taking the Data Science course, we may want to know if this particular sample of students is similar to or different from Flatiron students in general.
The one-sample Z test is used only for tests of the sample mean.
Thus, we test for whether the average of our sample suggests that our students come from a population with a know mean or whether it comes from a different population.
At this stage we already know what a z-score is and how to standardize a dataset and converting it into a z-distributions. By itself, the Z-score doesn't provide much information in terms of concluding a question significantly. It gains the most value when compared against a Z-table.
A z-table tabulates the cumulative probability of a standard normal distribution up until a given Z-score. The Z-score lets us reference this the Z-table even if our normal distribution is not standard. The z-table is short for the “Standard Normal z-table”. The Standard Normal model is used in significance testing very commonly.
The area under the whole of a normal distribution curve is 1, or 100 percent. The z-table helps by telling us what percentage is under the curve at any particular point.
Here is a link to an on-line version of z-table. Your repo contains a pdf version of this table. These particular values are listed in the form . in rows along the left margins of the table, specifying the ones and tenths. The columns fine-tune these values to hundredths, allowing us to look up the probability of being below any standardized value z of the form *.**.
We have seen that cumulative probability is the sum of the probabilities of all values occurring, up until a given point. An easy example is the mean itself. The mean is the exact middle of the normal distribution, so we know that the sum of all probabilites of getting values from the left side up until the mean is 0.5. Also the sum of probabilities from the mean to right tail would also sum up to 0.5.


As sum of all probabilities must equal 100%, we can use the Z-table to calculate probabilities on both sides of the Z-score under the normal distribution.

Z-scores lets us ask go from "how far is a value from the mean" to "how likely is a value this far from the mean to be from the same group of observations?". So once again, moving from stats to probability (likelihood is measured as probabilities).
What is the probability of a z-score being less than or equal to 1.5 ?
To find the answer using the Z-table, find where the row for 1.5 intersects with the column for 0.00; this value is 0.9332. The Z-table shows only “less than” probabilities so it gives you exactly what you need for this question.
What is the probability of a z-score being greater or equal to 1.5 ?
Use the Z-table to find where the row for 1.5 intersects with the column for 0.00, which is 0.9332. Because the Z-table gives you only “less than” probabilities, subtract P(Z < 1.5) from 1 (remember that the total probability for the normal distribution is 1.00, or 100%). So, 1 - 0.9332 = 0.0668.
Here is a short video on how to use z-table
#### z-table alternative in python
While programming in python, scipy provides a handful of features so you wont have to go out consulting z-tables for automated analysis. For normal distributions, probabilities upto the z score can be calculated with cdf method as shown below:
# Z-table in python
import scipy.stats as stats
# Probabilities upto z-score of 1.5
print(stats.norm.cdf(1.5))
# Probabilities greater than z-score
print (1-stats.norm.cdf(1.5))
0.9331927987311419
0.06680720126885809
A very important aspect of statistical testing is setting up a Hypothesis to be tested through data analysis. Statistical testing process is also known as Hypothesis testing, used for evaluating some theory using data.
The hypothesis is an analyst's initial understanding about a phenomenon prior to the testing. This Hypothesis is known as the Alternative Hypothesis (written as Ha).
The possibility, which is exactly opposite to the Alternative Hypothesis is known as a Null Hypothesis (written as Ho).

The table below shows three sets of null and alternative hypotheses. Each makes a statement about how the mean μ is related to some hypothesized value M.
Set    Ho      Ha      tails
1    μ = M    μ ≠ M    2
2    μ > M    μ < M    1
3    μ < M    μ > M    1
Here the tails represent if we are testing both sides of the distribution or only one side.
As an example, an analyst may want to check the efficacy of a new drug by setting up an alternative hypothesis that the new drug reduces blood pressure by 10%. In this case , a null hypothesis would simply state that the new drug has no effect on the patients. For hypothesis testing, we try to reject the null hypothesis to obtain what we call "Statistically Significant Results".
We shall now learn about P-value as a statistical summary of the compatibility between the observed data and what we would predict or expect to see if we knew the entire statistical model were correct. The concepts of p-value and level of significance are vital components of hypothesis testing and advanced methods like regression. However, they can be a little tricky to understand, especially for beginners and good understanding of these concepts can go a long way in understanding advanced concepts in statistics and econometrics. Here, we try to simplify the concept in an easy, logical manner.
In hypothesis testing, we set a null hypothesis (lets say mean x = 10), and then using a sample, test this hypothesis. After testing the hypothesis, we get a result (lets say x = 12). Now with p value, we obtain a probability that given than the population mean was 10, what is the probability that we get a sample mean of 12.
If that probability is too low, we reject the null hypothesis, that is, we say that based on current evidence and testing, the null hypothesis is not true. If that probability is too high, we accept the null hypothesis, that is, we say that based on current evidence and testing, the null hypothesis is true. This probability is the p-value. It is a result that we obtain after conducting our statistical test (e.g regression).
It is important to understand what we are trying to achieve here. We have a population and we are assuming something about that population (lets say mean i.e. x = 10) and now we want to test from a given sample whether it is true or not that the mean is 10. Now how do we do that? We perform our statistical test with the sample (and NOT the population). We get the result. Lets say the result is x=12.
It is important to understand what we have assumed and what we have got.
We have assumed that the population mean is 10, and we have got the result that sample mean is 12. In a sense, assumed population mean is an assumption and sample mean is a result that we have obtained. Assumed mean is an assumption, a possibility. It is what we are assuming the value to be. Sample mean is a result that we have obtained after performing the test.
We then verify whether what we have obtained (sample mean) is consistent with what we have assumed (population mean). In other words, what are the chances of getting the result (sample mean) if the assumption is actually true (population mean). What are the chances that sample mean is 12, under the assumption that population mean is 10?
This chance or probability is called as p-value.
If that p-value is low, it means that the chances were very low to obtain the sample mean as 12, if the assumption that population mean is 10 was true. Thus, something is wrong. Sample mean cannot be wrong, as it is our result. It is what our sample data says. Thus, the only thing that can be wrong is the assumption of population mean. In other words, it appears that the assumption that population mean is 10 (our null hypothesis) is itself wrong and we should reject that. In this case, we say that our result is SIGNIFICANT, we have concluded that our sample mean is significantly different from our population mean.
If that p-value is high, it means that the chances were very high to obtain the sample mean as 12, if the assumption that population mean is 10 was true. Thus, it appears that the assumption that population mean is 10 (our null hypothesis) is right and we should accept (or not reject it). In this case, we say that our result is INSIGNIFICANT, which means that from our results, we have concluded that our sample mean is NOT significantly different from our population mean.

The significance level, also denoted as alpha or α, is the probability of rejecting the null hypothesis when it is true. For example, a significance level of 0.05 indicates a 5% risk of concluding that a difference exists when there is no actual difference.
These types of definitions can be hard to understand because of their technical nature. A picture makes the concepts much easier to comprehend!
The significance level determines how far out from the null hypothesis value we'll draw that line on the graph. To graph a significance level of 0.05, we need to shade the 5% of the distribution that is furthest away from the null hypothesis.
Okie, this was a long one. Don't worry as we shall re-visit these topics in more detail to take a deep dive into statistical testing. For now, We can move on to see how to perform a one-sample z -test.
In this lesson, we saw the basics of hypothesis testing and quickly went through the concepts and terminologies that are employed by statistical testing approach. We shall now move on to perform a one-sample z-test to validate a hypothesis that the sample drawn belongs to the same population.


