React-ArcGIS
React-ArcGIS is a library of React components which use the ArcGIS API for JavaScript v.4.4. React-ArcGIS uses esri-promise internally to load and interact with the AMD ArcGIS API for JavaScript, providing convenient react components for mapping applications.
Installation:
- Run
npm i react-arcgis
Recently added:
2.0.0
- All components in the library now accept a
dataFlowprop, which dictates whether or not React's state controls that of the component (see Advanced Usage). - The library now loads the ArcGIS JavaScript API version 4.4 by default.
Basic Usage:
Render a simple map in React:
import * as React from 'react';
import * as ReactDOM from 'react-dom';
import { Map } from 'react-arcgis';

ReactDOM.render(
  <Map />,
  document.getElementById('container')
);
Or, render a 3D web-scene:
import * as React from 'react';
import * as ReactDOM from 'react-dom';
import { Scene } from 'react-arcgis';

ReactDOM.render(
  <Scene />,
  document.getElementById('container')
);
You can also add webmaps and webscenes from ArcGIS Online:
import * as React from 'react';
import * as ReactDOM from 'react-dom';
import { WebMap, WebScene } from 'react-arcgis';

ReactDOM.render(
    <div style={{ width: '100vw', height: '100vh' }}>
        <WebMap id="6627e1dd5f594160ac60f9dfc411673f" />
        <WebScene id="f8aa0c25485a40a1ada1e4b600522681" />
    </div>,
  document.getElementById('container')
);
If you want to change the style of the Map or Scene, pass a style object into the Map or Scene's props:
import * as React from 'react';
import * as ReactDOM from 'react-dom';
import { Scene } from 'react-arcgis';

ReactDOM.render(
  <Scene style={{ width: '100vw', height: '100vh' }} />,
  document.getElementById('container')
);
You can also pass properties into the Map, MapView, or SceneView via the viewProperties or mapProperties props:
import * as React from 'react';
import { Map } from 'react-arcgis';
export default (props) => (
<Map
style={{ width: '100vw', height: '100vh' }}
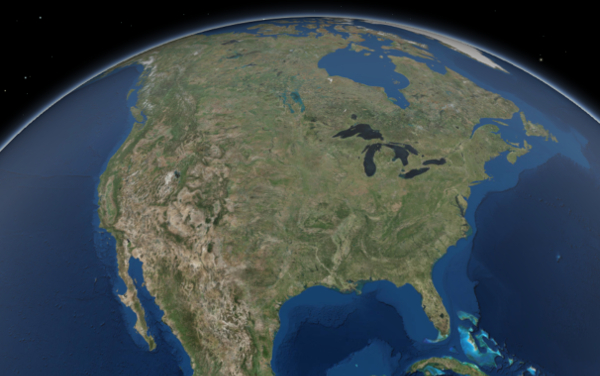
mapProperties={{ basemap: 'satellite' }}
/>
)
These properties are passed directly to the available properties on the corresponding ArcGIS API classes:
import * as React from 'react';
import { Scene } from 'react-arcgis';
export default (props) => (
<Scene
style={{ width: '100vw', height: '100vh' }}
mapProperties={{ basemap: 'satellite' }}
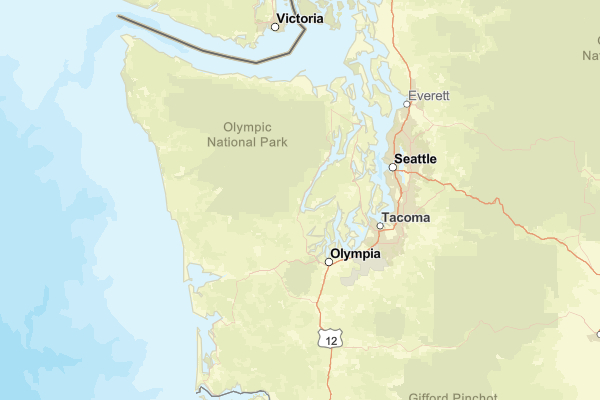
viewProperties={{
center: [-122.4443, 47.2529],
zoom: 6
}}
/>
)Render some widgets on the map by nesting them in the <Map /> or <Scene />:
import * as React from 'react';
import { Scene, Widgets } from 'react-arcgis';

const SearchWidget = Widgets.Search;
const BasemapGallery = Widgets.BasemapGallery;

export default (props) => (
    <Scene
        style={{ width: '100vw', height: '100vh' }}
        mapProperties={{ basemap: 'satellite' }}
        viewProperties={{
            center: [-122.4443, 47.2529],
            zoom: 6
        }}
    >
        <SearchWidget position="top-right" />
        <BasemapGallery position="bottom-right" />
    </Scene>
)
Render popups by nesting them in the <Map /> or <Scene />:
import * as React from 'react';
import { Scene, Popup } from 'react-arcgis';

const SearchWidget = Widgets.Search;
const BasemapGallery = Widgets.BasemapGallery;

export default (props) => (
    <Scene
        style={{ width: '100vw', height: '100vh' }}
        mapProperties={{ basemap: 'satellite' }}
        viewProperties={{
            center: [-122.4443, 47.2529],
            zoom: 6
        }}
    >
        <Popup
            popupProperties={{
                content: 'This is a random popup that I made.',
                location: [-122.4443, 47.2529],
                title: 'My Popup'
            }}
        />
    </Scene>
)
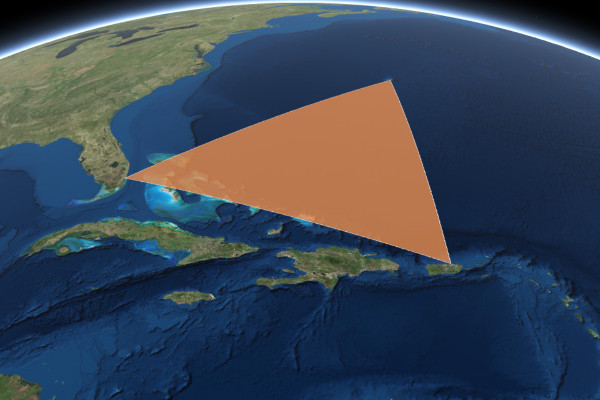
Render graphics by nesting the desired Symbol and Geometry within a <Graphic></Graphic> tag:
import * as React from 'react';
import { Scene, Graphic, Symbols, Geometry } from 'react-arcgis';

const bermudaTriangle = (
    <Graphic>
        <Symbols.SimpleFillSymbol
            symbolProperties={{
                color: [227, 139, 79, 0.8],
                outline: {
                    color: [255, 255, 255],
                    width: 1
                }
            }}
        />
        <Geometry.Polygon
            geometryProperties={{
                rings: [
                    [-64.78, 32.3],
                    [-66.07, 18.45],
                    [-80.21, 25.78],
                    [-64.78, 32.3]
                ]
            }}
        />
    </Graphic>
);

export default (props) => (
    <Scene
        style={{ width: '100vw', height: '100vh' }}
        mapProperties={{ basemap: 'satellite' }}
        viewProperties={{ scale: 500000000 }}
    >
        {bermudaTriangle}
    </Scene>
)
You can also render graphics inside of a GraphicsLayer:
import * as React from 'react';
import { Scene, Layers } from 'react-arcgis';

const titanic = (
    <Graphic>
        <Symbols.SimpleMarkerSymbol
            symbolProperties={{
                color: [226, 119, 40],
                outline: {
                    color: [255, 255, 255],
                    width: 2
                }
            }}
        />
        <Geometry.Point
            geometryProperties={{
                latitude: 41.73,
                longitude: -49.97
            }}
        />
    </Graphic>
);

export default (props) => (
    <Scene
        style={{ width: '100vw', height: '100vh' }}
        mapProperties={{ basemap: 'satellite' }}
        viewProperties={{ scale: 500000000 }}
    >
        <Layers.GraphicsLayer>
            {titanic}
        </Layers.GraphicsLayer>
    </Scene>
);
The other types of layers, like FeatureLayer, can also be created:
import * as React from 'react';
import { Scene, Layers } from 'react-arcgis';
export default (props) => (
<Scene
style={{ width: '100vw', height: '100vh' }}
mapProperties={{ basemap: 'satellite' }}
viewProperties={{
center: [-82.4423, 35.6111],
scale: 5000
}}
>
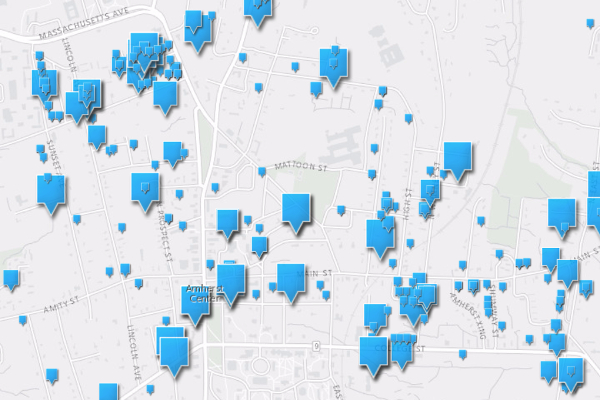
<Layers.FeatureLayer
layerProperties={{
url: 'https://services.arcgis.com/V6ZHFr6zdgNZuVG0/arcgis/rest/services/Landscape_Trees/FeatureServer/0'
}}
/>
</Scene>
);You can now add callbacks to any of the components available directly in the JSX. These callbacks follow the camel-case of the corresponding event in the ArcGIS API for JavaScript. For example:
    render() {
        return (
            <WebScene
                className="half-map"
                id="f8aa0c25485a40a1ada1e4b600522681"
                onDoubleClick={() => { console.log('double-clicked on the map!')}}
            >
                <BasemapToggle
                    position="top-right"
                    onToggle={() => {console.log('toggled the basemap!')}}
                />
            </WebScene>
        );
    }
Advanced Usage:
In some situations, you may want to control the state of the map depending on actions taken within your application. One good example of this would be if you are creating a custom dashboard or similar.
The easiest way to do this is by using the watchers included on the instance returned from a <Map />, <Scene />, <WebMap /> or <WebScene /> to listen for changes to a particular property then update state of your application accordingly. When you want to change the state of the map, you can update its properties through the instance in response to some UI event or similar in your application.
Experienced React users will recognize a problem here: we have essentially set up a two-way binding situation between our React application and the ArcGIS API. There is no single source of truth with this method, so the map and your application may fight over the state of the map if the developer is not careful.
Alternatively, one can take full responsibility for the state of the map, and have its state flow unidirectionally from the React application by setting dataFlow="oneWay" on the component. Here is a very simple example of a one-way react-arcgis component:
import * as React from 'react';
import { Map } from 'react-arcgis';
export default class TestComponent extends React.Component{
constructor(props) {
super(props);
this.state = {
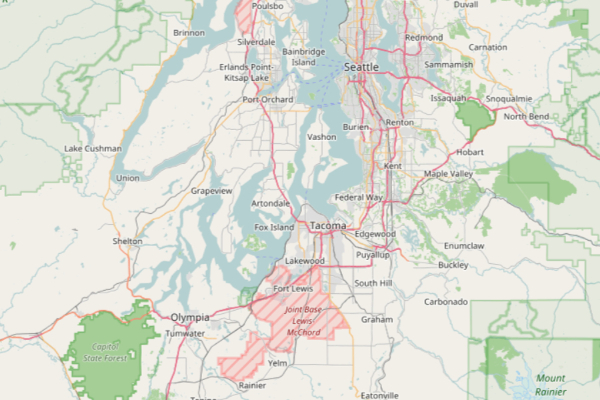
viewProperties: {
center: [-122.4443, 47.2529],
scale: 50000
}
};
}
public render() {
return (
<div style={{ width: '100vw', height: '100vh' }}>
<Map
dataFlow="oneWay"
viewProperties={this.state.viewProperties}
onLoad={this.handleMapLoad}
onDrag={(e) => { e.stopPropagation() }}
onMouseWheel={(e) => { e.stopPropagation() }}
/>
</div>
);
}
private handleMapLoad(map, view) {
view.ui.remove("compass");
view.ui.remove("zoom");
view.ui.remove("navigation-toggle");
}
}In the above example, all of the default widgets are removed from the map, ensuring that they will not alter its internal state. Additionally, the drag and mouseWheel events are blocked from propogating, so that the default behavior of the map is eliminated.
To use the map in a manner consistent with unidirectional state-flow, you will have to reimplement the basic scrolling/zooming behavior of the map, and create custom widgets to manipulate its state from your react application. Here is an example of a react-arcgis Map with scrolling controlled in a unidirectional manner.
import * as React from 'react';
import { Map } from 'react-arcgis';

export default class TestComponent extends React.Component{
    constructor(props) {
        super(props);
        this.state = {
            myMap: null,
            myView: null,
            viewProperties: {
                center: [-122.4443, 47.2529],
                scale: 50000
            },
            dragging: false,
            dragPrevious: null,
        };
        this.handleMapLoad = this.handleMapLoad.bind(this);
        this.handleDrag = this.handleDrag.bind(this);
        this.handleMouseWheel = this.handleMouseWheel.bind(this);
    }

    public render() {
        return (
            <div style={{ width: '100vw', height: '100vh' }}>
                <Map
                    dataFlow="oneWay"
                    viewProperties={this.state.viewProperties}
                    onLoad={this.handleMapLoad}
                    onDrag={this.handleDrag}
                    onMouseWheel={this.handleMouseWheel}
                />
            </div>
        );
    }

    private handleMapLoad(map, view) {
        view.ui.remove("compass");
        view.ui.remove("zoom");
        view.ui.remove("navigation-toggle");
        this.setState({
            myMap: map,
            myView: view
        });
    }

    private handleMouseWheel(e) {
        e.stopPropagation();
        this.setState({
            viewProperties: {
                ...this.state.viewProperties,
                scale: this.state.viewProperties.scale + (e.deltaY * (this.state.viewProperties.scale / 250))
            }
        });
    }

    private handleDrag(e) {
        e.stopPropagation();
        if (e.action === "start") {
            this.setState({
                dragPrevious: {
                    x: e.x,
                    y: e.y
                },
                dragging: true
            });

        } else if (e.action === "end") {
            this.setState({
                dragPrevious: null,
                dragging: false
            });
        } else if (e.action === "update" && this.state.dragging) {
            this.setState({
                dragPrevious: {
                    x: e.x,
                    y: e.y
                },
                viewProperties: {
                    ...this.state.viewProperties,
                    center: [
                        this.state.viewProperties.center[0] - 0.0001 * (e.x - this.state.dragPrevious.x) * (this.state.viewProperties.scale / 25000),
                        this.state.viewProperties.center[1] + 0.0001 * (e.y - this.state.dragPrevious.y) * (this.state.viewProperties.scale / 25000)
                    ]
                }
            });
        }
    }
}
In most cases, it may not be worth introducing this level of complexity in order to enforce a unidirectional state-flow. In large and complex applications however, the fine-grained and predictable control of the map afforded by one-way data flow may be worth considering.
Hopefully this package helps you incorporate Esri's awesome ArcGIS API for JavaScript into your ReactJS applications!
Happy coding! :]
Nick
