Coder Social home page Coder Social logo

jrowen / rhandsontable Goto Github PK

View Code? Open in Web Editor NEW
381.0 35.0 147.0 114.61 MB

A htmlwidgets implementation of Handsontable.js

Home Page: http://jrowen.github.io/rhandsontable/

License: Other

R 0.57% CSS 0.01% JavaScript 0.13% HTML 99.30%
r shiny handsontable htmlwidgets javascript sparkline

rhandsontable's Introduction

Build Status AppVeyor Build Status CRAN_Status_Badge CRAN_Download_Badge

See the project website for more details and live examples, and see below for important details on use in shiny apps.

An htmlwidgets implementation of Handsontable.js. Per the website:

Handsontable is a minimalist Excel-like data grid editor for HTML & JavaScript

This library was inspired by the shinyTable package. Most of the original functionality was preserved, and the htmlwidgets framework made it possible to leverage even more of the Handsontable.js functionality.

Note: With v7, handsontable went to a more restrictive license for commercial use. To avoid license violations for existing users, rhandsontable will not update handsontable beyond v6.2.2. This may change in the future if a way is found to manage multiple handsontable versions.

See the vignette for detailed examples and links to shiny apps.

To install from CRAN use

install.packages("rhandsontable")

For the latest development version use

devtools::install_github("jrowen/rhandsontable")

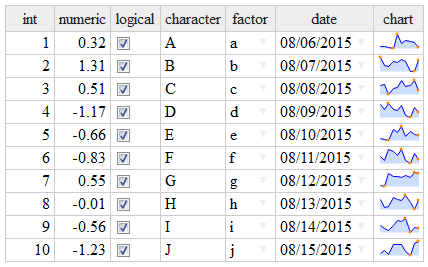
A simple example

library(rhandsontable)

DF = data.frame(int = 1:10,
                numeric = rnorm(10),
                logical = TRUE,
                character = LETTERS[1:10],
                fact = factor(letters[1:10]),
                date = seq(from = Sys.Date(), by = "days", length.out = 10),
                stringsAsFactors = FALSE)

# add a sparkline chart
DF$chart = sapply(1:10, function(x) jsonlite::toJSON(list(values=rnorm(10))))
                                                    
rhandsontable(DF, rowHeaders = NULL) %>%
  hot_col("chart", renderer = htmlwidgets::JS("renderSparkline"))

alt tag

A more involved shiny example

shiny::runGitHub("rhandsontable", "jrowen", subdir = "inst/examples/rhandsontable_corr")

Important note on shiny use: The htmlwidgets package creates widgets as shiny output bindings. The rhandsontable package also attempts to expose the table as a pseudo shiny input binding using handsontable change events (see here for the supported events). This means the table (e.g. hot) can be accessed in shiny using either input$hot or output$hot, but these values may not be in-sync. The timing of updates will depend on the particular reactive path followed by your shiny application.

Since the widget is not currently able to use the standard shiny input binding functionality, you will need to explicitly call the hot_to_r function to convert the handsontable data to an R object.

Two additional inputs are also enabled, input$hot_select and input$hot_comment, which will fire when a cell selection or a comment changes, respectively (if you would like to see more options, please post an issue or create a PR).

This functionality is still evolving, so please don't hesitate to share suggestions and PRs.

rhandsontable's People

Stargazers

 avatar  avatar  avatar  avatar  avatar  avatar  avatar  avatar  avatar  avatar  avatar  avatar  avatar  avatar  avatar  avatar  avatar  avatar  avatar  avatar  avatar  avatar  avatar  avatar  avatar  avatar  avatar  avatar  avatar  avatar  avatar  avatar  avatar  avatar  avatar  avatar  avatar  avatar  avatar  avatar  avatar  avatar  avatar  avatar  avatar  avatar  avatar  avatar  avatar  avatar  avatar  avatar  avatar  avatar  avatar  avatar  avatar  avatar  avatar  avatar  avatar  avatar  avatar  avatar  avatar  avatar  avatar  avatar  avatar  avatar  avatar  avatar  avatar  avatar  avatar  avatar  avatar  avatar  avatar  avatar  avatar  avatar  avatar  avatar  avatar  avatar  avatar  avatar  avatar  avatar  avatar  avatar  avatar  avatar  avatar  avatar  avatar  avatar  avatar  avatar

Watchers

 avatar  avatar  avatar  avatar  avatar  avatar  avatar  avatar  avatar  avatar  avatar  avatar  avatar  avatar  avatar  avatar  avatar  avatar  avatar  avatar  avatar  avatar  avatar  avatar  avatar  avatar  avatar  avatar  avatar  avatar  avatar  avatar  avatar  avatar  avatar

rhandsontable's Issues

NA and NaN values break column types

Hi, very useful JS bindings!
I just noticed that when numeric columns contain NA or NaN values, then the renderer breaks (reads numeric columns as text). In that case I have to manually set column types and formats. Is this behavior by design? Also I'm wondering what's the best way to render NA and NaN to something nicer on the client, like "--" or "no data", etc.
Thanks, --Mel.

FR: hot_validate_numeric: one per each columns or settable for a range of cols?

I have been experimenting with hot_validate_numeric and it seems to me that needs to be specified once for each column.

In other words a vector of col names or col indexes does not seem to work as in

rhandsontable(df_, readOnly = FALSE, rowHeaders= NULL, useTypes= TRUE) %>%
  hot_table(highlightCol = TRUE, highlightRow = TRUE) %>%
  hot_validate_numeric(hot = ncols, min = 0, max = 100, allowInvalid = FALSE)

As this is not very idiomatic in R (e.g. the imperative to vectorise!), would it be possible to introduce this feature?

How to use minSpareRows option

Hi
I'd love to use the minSpareRows: 1 option as in the first example in http://handsontable.com/ but haven't figured out how to do it with rhandsontable.
How can I get it to work?
Best

var
  data = [
    ['', 'Maserati', 'Mazda', 'Mercedes', 'Mini', 'Mitsubishi'],
    ['2009', 0, 2941, 4303, 354, 5814],
    ['2010', 3, 2905, 2867, 412, 5284],
    ['2011', 4, 2517, 4822, 552, 6127],
    ['2012', 2, 2422, 5399, 776, 4151]
  ],
  container = document.getElementById('example'),
  hot;

hot = new Handsontable(container, {
  data: data,
  minSpareRows: 1,
  colHeaders: true,
  contextMenu: true
});

readOnly not enforced?

I may misunderstand this the readOnly parameter, but in shiny when I create a new table and set columns to read only using readOnly = T I am able to right click and make them in the web browser and make them editable.

Is this the intended functionality?

issues with shinydashboard

Some issues with shinydashboard (I confess I haven't tried to reproduce them in "plain" shiny)

I'm sure some of them are due to improper parameter settings from my part?

  • The handsontable is not horizontally self-sizing: it hasn't the ability of setting the size of the box (apparently). Of course it works if I fix an appropriate width (e.g. width=12).
  • The horizontal scroll does not include the handsontable head row. This is pretty pretty confusing as the you loose track of which column header is the right one.
  • As expected (due to the settings) there are no row headers, strangley not even row numbers. But after trying to ender a char in mpg (defined as numeric) row numbers appear from nowhere as row headers. This would be better if they would be there form the beginning, or not at all.
  • No autosizing also vertically. It is an issue as the unused space left at the bottom is huge!
library(shiny)
library(shinydashboard)
library(rhandsontable)


header <- dashboardHeader()

sidebar <- dashboardSidebar()

body <- dashboardBody(

          fluidRow(
            box(plotOutput("plot1")),
            box( title = "Controls", width=3,sliderInput("slider", "Number of observations:", 1, 10, 5) )),
          fluidRow( box(title = "Handsontable",rHandsontableOutput("hot") )

))

ui <- dashboardPage(header, sidebar, body)


server <- function(input, output) {

  set.seed(122)
  histdata <- rnorm(500)

  values  <-  reactiveValues()
  setHot  <-  function(x) values[["hot"]]  <-  x


  output$plot1 <- renderPlot({
    data <- histdata[seq_len(input$slider)]
    hist(data)
  })


  output$hot = renderRHandsontable({
  if (!is.null(input$hot)) {
    DF  <-  hot_to_r(input$hot)
    setHot(DF)
    rhandsontable(DF) %>%
      hot_table(highlightCol = TRUE, highlightRow = TRUE)
  } else {
    DF  <-  mtcars
    cols <- colnames(DF)
    DF$brand <- row.names(mtcars)
    DF <- DF[,c("brand", cols)]
    rhandsontable(DF, rowHeaders=FALSE) %>%
      hot_table(highlightCol = TRUE, highlightRow = TRUE) %>%
      hot_cols(columnSorting = TRUE, fixedColumnsLeft=1) %>%
      hot_validate_numeric(col = "mpg", allowInvalid=FALSE)
  }
  })
}

shinyApp(ui, server)

Thanks!

Cell red color

Hello jrowen,
I have a doubt when I use the next example,

MAT = matrix(rnorm(50), nrow = 10, dimnames = list(LETTERS[1:10],
                                                   letters[1:5]))
rhandsontable(MAT * 10) %>%
    hot_validate_numeric(col = 1, min = -2, max = 4, exclude = 40,allowInvalid = FALSE)

image

It says: "Invalid data cells will be color red" but when I execute the example, the cell values which are out of range (-2,4) does not have any red color.

Help me if I have an error.
Thank so much in advance and congratulations for this amazing package!!.

Question concerning the input

I could not find an example of actually getting the input from the table. For those who are wondering, it is just like the other inputs using input$ID, where ID is the ID of the object.

My question is whether there is some clever method of getting the table in a useful format. Right now it is returned as a list of lists instead of matrix/data.frame which I was expecting.

Here's the input returned from a simple 3x2 matrix:

$data
$data[[1]]
$data[[1]][[1]]
[1] "1"

$data[[1]][[2]]
[1] "4"


$data[[2]]
$data[[2]][[1]]
[1] "2"

$data[[2]][[2]]
[1] "5"


$data[[3]]
$data[[3]][[1]]
[1] "3"

$data[[3]][[2]]
[1] "6"


$changes
$changes$event
[1] "afterChange"

$changes$changes
$changes$changes[[1]]
$changes$changes[[1]][[1]]
[1] 2

$changes$changes[[1]][[2]]
[1] 1

$changes$changes[[1]][[3]]
[1] 0

$changes$changes[[1]][[4]]
[1] "6"


$params
$params$data
$params$data[[1]]
$params$data[[1]][[1]]
[1] "1"

$params$data[[1]][[2]]
[1] "4"


$params$data[[2]]
$params$data[[2]][[1]]
[1] "2"

$params$data[[2]][[2]]
[1] "5"


$params$data[[3]]
$params$data[[3]][[1]]
[1] "3"

$params$data[[3]][[2]]
[1] "6"


$params$rClass
[1] "matrix"

$params$rColClasses
[1] "numeric"

$params$selectCallback
[1] FALSE

$params$colHeaders
NULL

$params$rowHeaders
NULL

$params$columns
$params$columns[[1]]
$params$columns[[1]]$type
[1] "text"


$params$columns[[2]]
$params$columns[[2]]$type
[1] "text"


$params$width
NULL

$params$height
NULL

$params$contextMenu
$params$contextMenu$items
$params$contextMenu$items$row_above
named list()

$params$contextMenu$items$row_below
named list()

$params$contextMenu$items$hsep1
[1] "---------"

$params$contextMenu$items$col_left
named list()

$params$contextMenu$items$col_right
named list()

$params$contextMenu$items$hsep2
[1] "---------"

$params$contextMenu$items$remove_row
named list()

$params$contextMenu$items$remove_col
named list()

$params$contextMenu$items$hsep3
[1] "---------"

$params$contextMenu$items$undo
named list()

$params$contextMenu$items$redo
named list()

$params$contextMenu$items$hsep4
[1] "---------"

$params$contextMenu$items$make_read_only
named list()

$params$contextMenu$items$alignment
named list()


$params$allowRowEdit
[1] TRUE

$params$allowColEdit
[1] TRUE

$params$csvFileName
[1] "download.csv"

Now, the first part of this long list contains the actual numbers. One can convert it to a matrix like this:

table_rows = length(input$table[[1]])
print(matrix(unlist(input$table[[1]]), nrow = table_rows, byrow = T))
     [,1] [,2]
[1,] "1"  "4" 
[2,] "2"  "5" 
[3,] "3"  "6"

Still, is there some less messy way that I am overlooking?

Adding rows via the context menu doesn't extend the table

Hi, in my code when I add a row via the context menu the table doesn't expand.
The rows are added (I see them in the data.frame if I debug) but they aren't displayed.
In the examples they are displayed (the table extends) but I can't find the property that controls this feature.
It seems related to the boundaries of the table. For example, If I have a column with a autocomplete feature, the menu doesn't go beyond the table (it's cut). It seems that the table can't draw anymore than it's initial boundary. I'm using a sidebar layout

Few minor questions

@jrowen Again congrats for a great implementation of this widget.
Few minor questions listed here:

  • (Some) of the examples of handsontable.js do not have the rowname column altogether.
    How can I do that with rhandsontable?
  • +1 for the implementation of comments. How can a user use / write them (i.e. excel-style)?
  • +1 for the heat map implementation. Could you kindly add an example to use just a column for RAG status?
  • So far I haven't managed to send rhandsontable in a malicious loop as other widgets may do - see my comment to DT from rstudio :)
    How did you achieve this - and is there a programming pattern in shiny that avoids the setting of endless loops?

Thanks

Copy column larger than table

In Shiny copying single or few columns larger than given table row size and pasting causes error "invalid 'row.names' length".

Thanks

Odd behaviour when using rhandsontable and D3Table in the same app

A minimal example:

library(shiny)
library(rhandsontable)
library(D3TableFilter)

server = shinyServer(function(input, output, session) {
  output$ht <- renderRHandsontable({
    rhandsontable( data.frame( a = 1:5 ) )
  })
})

ui = shinyUI(fluidPage(
  rHandsontableOutput("ht"),
  d3tfOutput('d3t')
))

runApp( shinyApp(ui, server) )

If I run the app as it is, the resulting table will have 7 rows in total with 2 blank rows at the bottom. If I remove the line d3tfOutput('d3t'), the table has 5 rows. Any suggestions how one (empty) table manipulates the other?

Columns are jumbled

Not really sure what is going on here. When using rhandsontable, I get the columns in the wrong order like this:

vs 4 6 8
1 3 14 0
10 4 1
library(dplyr)
library(tidyr)
library(rhandsontable) 

mtcars %>% 
  group_by(vs, cyl) %>% 
  summarise(num = n()) %>% 
  spread(cyl, num)

  vs  4 6  8
1  0  1 3 14
2  1 10 4 NA

mtcars %>% 
  group_by(vs, cyl) %>% 
  summarise(num = n()) %>% 
  spread(cyl, num) %>% 
  rhandsontable()

Here's my session info

> devtools::session_info()
Session info ------------------------------------------------------------------------------------------------------
 setting  value                       
 version  R version 3.1.3 (2015-03-09)
 system   x86_64, mingw32             
 ui       RStudio (0.99.473)          
 language (EN)                        
 collate  English_United States.1252  
 tz       America/New_York            

Packages ----------------------------------------------------------------------------------------------------------
 package       * version date       source                               
 assertthat    * 0.1     2013-12-06 CRAN (R 3.1.3)                       
 DBI           * 0.3.1   2014-09-24 CRAN (R 3.1.3)                       
 devtools      * 1.7.0   2015-01-17 CRAN (R 3.1.3)                       
 digest        * 0.6.8   2014-12-31 CRAN (R 3.1.3)                       
 dplyr           0.4.1   2015-01-14 CRAN (R 3.1.3)                       
 htmltools     * 0.2.6   2014-09-08 CRAN (R 3.1.3)                       
 htmlwidgets   * 0.5.1   2015-09-16 Github (ramnathv/htmlwidgets@3a2e312)
 jsonlite      * 0.9.16  2015-04-11 CRAN (R 3.1.3)                       
 lazyeval      * 0.1.10  2015-01-02 CRAN (R 3.1.3)                       
 magrittr      * 1.5     2014-11-22 CRAN (R 3.1.3)                       
 Rcpp          * 0.11.5  2015-03-06 CRAN (R 3.1.3)                       
 rhandsontable   0.2.2   2015-09-23 Github (jrowen/rhandsontable@d96bf46)
 rstudioapi    * 0.3.1   2015-09-16 Github (rstudio/rstudioapi@d0417a9)  
 tidyr           0.2.0   2014-12-05 CRAN (R 3.1.3)                       
 yaml          * 2.1.13  2014-06-12 CRAN (R 3.1.3)  

Formatting when colHeaders=NULL

Is there a way to set background color when column header is omitted? Take the Conditional Formatting sample code here as an example. It does not seem to work if colHeaders=NULL is added:

MAT = matrix(runif(100, -1, 1), nrow = 10,
             dimnames = list(LETTERS[1:10], LETTERS[1:10]))
diag(MAT) = 1
MAT[upper.tri(MAT)] = MAT[lower.tri(MAT)]
rhandsontable(MAT, colHeaders = NULL, readOnly = TRUE) %>%
  hot_cols(renderer = "
           function (instance, td, row, col, prop, value, cellProperties) {
             Handsontable.renderers.TextRenderer.apply(this, arguments);
             if (row == col) {
              td.style.background = 'lightgrey';
             } else if (col > row) {
              td.style.background = 'grey';
              td.style.color = 'grey';
             } else if (value < -0.75) {
              td.style.background = 'pink';
             } else if (value > 0.75) {
              td.style.background = 'lightgreen';
             }
           }")

Am I missing something here?

Numeric Formatting and Conditional Formatting (using rendered) don't work together

Awesome package!! Thanks for putting it together. One potential issue: it seems like a column can't have both a rendered JS input and a format input.

  • Column with just numeric formatting:

rhandsontable(iris) %>% hot_col(1,format="0%")

screen shot 2015-09-16 at 12 50 38 am

  • Column with just JS formatting:
rhandsontable(iris) %>% 
 hot_col(1,renderer="function (instance, td, row, col, prop, value, cellProperties) {
Handsontable.renderers.TextRenderer.apply(this, arguments);
          td.style.background = 'lightgrey';
          td.style.fontWeight = 'bold';
          }
          ")

screen shot 2015-09-16 at 12 52 18 am

  • Column with both in function, only JS formatting works:
 rhandsontable(iris) %>% 
     hot_col(1,format="0%",renderer="function (instance, td, row, col, prop, value, cellProperties) {
             Handsontable.renderers.TextRenderer.apply(this, arguments);
             td.style.background = 'lightgrey';
             td.style.fontWeight = 'bold';
             }
             ")

screen shot 2015-09-16 at 12 58 16 am

Is this a known issue or an error on my end? Thanks!!!

validator logic

@jrowen I find the validator one of the most interesting things of your implementation (as it makes so much sense to do this client-side). Unfortunately it is not very clear how it works.

  • Am I right assuming that it works also with a data.frame - or it is not column specific hence it works only with a matrix?
  • Does it need to be written in JS?
  • Could you kindly give an example of a validation test similar to typeof(value) == "string" && value > 0 ?

Add row and column not working after htmlwidgets switch to jsonlite

@yihui I'm wondering if you might have a suggestion here. It appears that the switch to jsonlite is breaking the row and column add functionality in shiny.

If you run the basic shiny example and add a row, you'll see that the new row is returned to shiny as NULL values (see toR function), and then the unlist function drops the new row. It seems that these NULL values must be converted to NA to be stored in a data.frame, and when the data.frame is returned to the widget, these NA values then need to be converted to NULL so they display as empty cells in the widget.

This logic appears to handle the NA conversion, but then I'm left with NA values in the widget.

out = lapply(out, function(x) lapply(x, function(x) ifelse(is.null(x), NA, x)))

The column add is creating a character vector.

A comment on the design

@jrowen I just run a trace between client and server in shiny to see what is exchanged.

I can see that the table data gets back and forth between client and server. I guess there are pos and cons with each approach. On the other hand I was surprised to see that even just selecting a cell with the mouse (without writing anything) was generating the data to be sent to the server.

Do you plan (long term maybe?) to study an optimisation of this?

E.g. you are familiar with trestletech approach (and its pitfall)...

Allow to reset input$hot

Hi first of all thanks for this amazing package!

I am having a hard time in figuring out how to use rhandsontable in an app where i can switch among different tables and save the edited tables to a file.

I followed the example in inst/examples/rhandson_datafile.

I then added a selectInput (with inputID tablename) in the ui.R and modified server.R to read different files depending on input$tablename. If I don't edit the tables, then switching the tables works.

The problem I have is that using !(is.null(input$hot)) prevents the switch if I already edited one of the tables, in which case input$hot is not null. I couldn't come out with a solution and can not set input$hot to null manually when the switch happens (I tried observeEvent(input$tablename, input$hot <- NULL) but receive an error saying that I am not allowed to do this because it is a read-only value).

Is it possible to add a function to reset input$hot (or whathever other inputID one might choose),
or do you have any workaround for this in mind?

Thanks a lot for the help!
Cheers,
Luca

Add search option

@cho7tom I made some changes to the context menu options, and I'd appreciate your feedback. You can install using

devtools::install_github("jrowen/rhandsontable", ref = "context_menu")

and there is a new example showing how a user can enable the search functionality.

Saving user edits to table

I am having trouble understanding how to obtain the edited table from the ui.R once it a table is edited in a shiny app implementation of rhandsontable. Are there examples of this? I would like to be able to use the user edits in downstream calculations, so obtaining them is the first step.

columnSorting=T and input$tableId_select$select$r don't work together

When columnSorting=T manually sorting columns seem to affect row indices, so any subsequent call to input$tableId_select$select$r will return data for the wrong row. Best would be to ensure that input$tableId_select$select$r always returns the underlying data.frame's row.name.

hot_to_r converts character into numeric

I was wondering how the hot_to_r function works. I am using data.table with 2 columns which are characters and a varying number of columns which are all numeric. It seems that when using hot_to_r, all columns are coerced to numeric, resulting in a messed up table. Can I pass an argument in the function to keep the types of columns?

Getting data from hot table in shiny

Hi, yesterday this code was working fine for me. Now I get some an error when I run the shiny app and try to change some value in the hot table.

Error: attempt to set 'colnames' on an object with less than two dimensions

This is the app:

library(shiny)
library(rhandsontable)

ui = shinyUI(fluidPage(

  titlePanel("Handsontable"),

  sidebarLayout(
    sidebarPanel(
      rHandsontableOutput("hot")
    ),
    mainPanel(
      verbatimTextOutput("debug"),
      #tableOutput("table"),
      br()
    )
  )
))

server = function(input, output) {

  data <- reactive({
    if (is.null(input$hot)) {
      DF = data.frame(val = 1:10, bool = TRUE, nm = LETTERS[1:10],
                      dt = seq(from = Sys.Date(), by = "days", length.out = 10),
                      stringsAsFactors = F)
    } else {
      DF = hot_to_r(input$hot)
    }
    DF
  })

  output$hot <- renderRHandsontable({
    DF <- data()
    rhandsontable(DF, useTypes = FALSE, selectCallback = TRUE)
  })


  output$table <- renderTable({data()})

  ### DEBUG
  output$debug <- renderPrint({
    str(input$hot_select$select)
  })  
}

shinyApp(ui = ui, server = server)

It would be great if you could take a look, thanks!

Pass the index of row clicked to R?

Just like the input$tableId_rows_selected and input$tableId_row_last_clicked in DT package.

Thanks for the nice package!

By the way the link to examples in vignettes break out.

no method or default for coercing “character” to “factor”

Hi! Some time ago this seemed to work perfectly fine, but now it doesn't. I have a table with mixed datatypes and some blank cells. Then the table is bound to a reactive value, which then is used in calculations. Now, however I either don't get any reaction whatsoever or have the error message no method or default for coercing “character” to “factor”. When I specify useTypes=FALSE, there is reaction, but then I have to work with a messy string. Is there a way to specify that all data in the table should be strings?
THanks!

dplyr tbls generate a warning

For example

libray(dplyr)
iris %>% tbl_df() %>% rhandsontable
Warning message:
In if (rClass == "matrix") { :
  the condition has length > 1 and only the first element will be used

I'm not sure if this is worth fixing, but I thought I'd mention in case you hadn't seen this before :)

Great package!

Shiny examples do not show the table at all

None of the shiny examples works for me.

I have an error in JSconsole instead,

 Uncaught TypeError: Cannot read property 'data' of undefined
rhandsontable.js:98 
Uncaught TypeError: Cannot read property 'updateSettings' of undefinedrhandsontable.js:98 HTMLWidgets.widget.resizehtmlwidgets.js:62 superFuncBoundhtmlwidgets.js:411 (anonymous function)shiny.js:2891 (anonymous function)shiny.js:116 (anonymous function)shiny.js:3239 (anonymous function)jquery.js:374 n.extend.eachjquery.js:139 n.fn.n.eachshiny.js:3238 mshiny.js:232 $invokeshiny.js:214 (anonymous function)
 Uncaught TypeError: Cannot read property 'data' of undefined
rhandsontable.js:98 Uncaught TypeError: Cannot read property 'updateSettings' of undefined

my sessionInfo() is:

R version 3.2.0 (2015-04-16)
Platform: x86_64-pc-linux-gnu (64-bit)
Running under: Ubuntu 14.04.1 LTS

locale:
 [1] LC_CTYPE=en_US.UTF-8       LC_NUMERIC=C              
 [3] LC_TIME=en_US.UTF-8        LC_COLLATE=en_US.UTF-8    
 [5] LC_MONETARY=en_US.UTF-8    LC_MESSAGES=en_US.UTF-8   
 [7] LC_PAPER=en_US.UTF-8       LC_NAME=C                 
 [9] LC_ADDRESS=C               LC_TELEPHONE=C            
[11] LC_MEASUREMENT=en_US.UTF-8 LC_IDENTIFICATION=C       

attached base packages:
[1] stats     graphics  grDevices utils     datasets  methods   base     

other attached packages:
[1] data.table_1.9.4      metricsgraphics_0.7.5 htmltools_0.2.6      
[4] htmlwidgets_0.3.3     rhandsontable_0.0.2   shiny_0.11.1         

loaded via a namespace (and not attached):
 [1] Rcpp_0.11.5     digest_0.6.8    mime_0.3        chron_2.3-45   
 [5] R6_2.0.1        plyr_1.8.2      xtable_1.7-4    jsonlite_0.9.16
 [9] magrittr_1.5    reshape2_1.4.1  tools_3.2.0     RJSONIO_1.3-0  
[13] stringr_0.6.2   yaml_2.1.13     httpuv_1.3.2   

fixed rows and columns issue with rstudio viewer

I use the following code (modified from the examples) in the rstudio viewer:

rhandsontable(MAT, width = 300, height = 150) %>%
  hot_cols( fixedColumnsLeft = 1) %>%
  hot_rows( fixedRowsTop = 1)

I would expect to see e.g. the left-most column fixed when scrolling, but the left column appears only highlighted. Same for top row.

On the other hand when I publish it on a web page is behaves as expected (I haven't got around to try it with knitr).

Live-edit data file with factors

Dear all,

Context

First let me congratulate you for this great package, I see many opportunities to use it in my future Shiny apps!
Being quite new to rhandsontable, I have an issue while trying to live-edit an Excel file when some columns are interpreted as factor by R (which is my expected behavior).

Reproducible example

As an simple reproducible example (based on your demo rhandsontable_datafile):

ui.R
library(rhandsontable)
shinyUI(fluidPage(
  actionButton("saveBtn", "Save changes"),
  rHandsontableOutput("hot")
))
server.R
library(rhandsontable)
library(xlsx)

shinyServer(function(input, output, session) {
  fname <- "filename"
  values = list()
  setHot = function(x) values[["hot"]] <<- x

  observe({ # will update xlsx file each time the button is pressed
    input$saveBtn
    if (!is.null(values[["hot"]])) {
      write.csv(values[["hot"]], fname)
      write.xlsx(x = values[["hot"]], file = paste0(fname, ".xlsx"), row.names = FALSE)
    }
  })

  output$hot = renderRHandsontable({
    if (!is.null(input$hot)) {
      DF = hot_to_r(input$hot)
      setHot(DF)
      rhandsontable(DF) %>%
        hot_table(highlightCol = TRUE, highlightRow = TRUE)
    } else {
      DF <- read.xlsx2("filename.xlsx", sheetIndex = 1)                            # DOES NOT WORK
      # DF <- read.xlsx2("filename.xlsx", sheetIndex = 1, stringsAsFactors = FALSE)  # DOES WORK
      setHot(DF)
      rhandsontable(DF) %>%
        hot_table(highlightCol = TRUE, highlightRow = TRUE)
    }
  })
})

filename.xlsx

test

Error

When running the version with the folowing row active

DF <- read.xlsx2("filename.xlsx", sheetIndex = 1)

1
the following error occurs as soon as I change a cell value:
2

I would like values to be treated as factors (to have dropdown values proposal). Is that feasible? Could you please let me know how to proceed?

Many thanks in advance for your views on this issue !

Regards

Using rhandsontable to display/edit multiple files

Hi,

I'm using rhandsontable to display and edit .csv files in a Shiny app, and the file that is displayed in the table depends on the value of selectInput. When I first load the app, if I change the file I want to display using the selectInput, the rhandsontable changes properly. But once I double click into the table or make any edits, changing the value of selectInput no longer changes what .csv file is displayed in the rhandsontable, it just displays whatever file was shown when I clicked into/edited it. I know this is because once I've clicked/edited, the rHandsontableOutput is no longer considered null, but is there a way around this so I can use the same table to edit multiple files? Setting input$file <- NULL seems like it would solve it, but isn't possible.

I have the following in my shiny server.R:

hotvalues = reactiveValues()
setHot = function(x) hotvalues[["file"]] <<- x
rHandsontableOutput("file")

And my output$file <- renderRHandsontable looks generally like this:

if (!is.null(input$file)) {
  hotdf = hot_to_r(input$file)
  setHot(hotdf)
  rhandsontable(hotdf) %>% 
    hot_table(highlightCol = TRUE, highlightRow = TRUE,
              allowRowEdit=FALSE, allowColEdit=FALSE)
} else {
  hotdf <- read.csv(filefromselectInput), stringsAsFactors = FALSE)
  setHot(hotdf)
  rhandsontable(hotdf) %>% 
    hot_table(highlightCol = TRUE, highlightRow = TRUE,
              allowRowEdit=FALSE, allowColEdit=FALSE)
}

can't show multiple tables in the shiny built-in browser

If there are multiple calls to rHandsontableOutput, in the built=in browser only one of them will show. For example, this happens with the data file editor example - if I copy it into RStudio and execute it, I will only see one of the tables.
The page looks fine in Chrome, so it is easy to work around this by calling runApp( launch.browser=TRUE, ...), So no urgency about solving it. Since I never experienced the problem with shinytable, I figured I should tell you about it.

jsonlite error message

@jrowen Congrats for this very neat implementation of handsontable!
I haven't tested it fully yet (watch this space!), but in the shiny.R example I notices the error message below with (probably after shiny recent adoption of jsonlite):

Input to asJSON(keep_vec_names=TRUE) is a named vector. 
In a future version of jsonlite, this option will not be supported, and named vectors will be translated into arrays instead of objects. 
If you want JSON object output, please use a named list instead. See ?toJSON.

Cannot add new columns

I have enabled allowColEdit and allowRowEdit. This makes it possible to add new rows, but not new columns. I'm not sure if I'm missing something or it's a bug. The menu options show up correctly, but nothing happens when clicking them.

It happens with this Shiny: https://github.com/Deleetdk/Jensens_method_2

hot_to_r error with dropdown column

there doesn't seem to be a way to call hot_to_r() if the table contains a column of type dropdown.

for example:

server.R -

shinyServer(function(input, output) {
output$saveButton <- downloadHandler(
filename=function() { paste0(Sys.Date(), '.csv') },
content = function(file) {
hot.df <- hot_to_r(input$table)

          write.csv(hot.df, file=file) 
      }
 )

output$table <- renderRHandsontable({
df <- data.frame( a = "")

     rhandsontable(df, rowHeaders = NULL) %>%
         hot_col("a", type = "dropdown", source = list("hello", "world"))

})
})

gives the error:
no method or default for coercing “character” to “factor”

Trim Whitespace in Shiny

Hi,

I am having some trouble with correctly formatting whitespace characters.

Specifically, with the following ui.R and server.R code the dataframe below is produced.
Unfortunately, in the handsontable produced note how the list data are misaligned even though it is formatted with sprintf and trimWhitespace set to false.

Any idea how to correctly format this?
Also, how would I generate the table without the separating comma's?

library(shiny)
library(shinydashboard)
library(rhandsontable)


header <- dashboardHeader()

sidebar <- dashboardSidebar()

body <- dashboardBody(

  fluidRow( box(title = "Handsontable",rHandsontableOutput("hot") )

  ))

ui <- dashboardPage(header, sidebar, body)


server <- function(input, output) {

  output$hot = renderRHandsontable({

    Y<-data.frame(Names=c("a","b","c","d"),stringsAsFactors=FALSE)
    Y$Data=list(c(100,2,300),c(1,20,30),c(10,20,300),c(1,20,3))
    Y$Data<-lapply(Y$Data,function(x) sprintf("% 4d",x) )
    rhandsontable(Y, rowHeaders=FALSE,trimWhitespace =FALSE)
  })
}

image

A simple shiny example, read only cols

Hi,
when adding read only property for cols, example not working properly, but hot_table(readOnly = TRUE) is ok.

library(shiny)
library(rhandsontable)

ui = shinyUI(fluidPage(

  titlePanel("Handsontable"),

  sidebarLayout(
    sidebarPanel(
      helpText("Handsontable demo output. Column add/delete does work ",
               "for tables with defined column properties, including type."),
      radioButtons("useType", "Use Data Types", c("TRUE", "FALSE"))
    ),
    mainPanel(
      rHandsontableOutput("hot")
    )
  )
))

server = function(input, output) {
  output$hot <- renderRHandsontable({
    if (is.null(input$hot)) {
      DF = data.frame(val = 1:10, bool = TRUE, nm = LETTERS[1:10],
                      dt = seq(from = Sys.Date(), by = "days", length.out = 10),
                      stringsAsFactors = F)
    } else {
      DF = hot_to_r(input$hot)
    }
    rhandsontable(DF, useTypes = as.logical(input$useType)) %>%
      # hot_table(readOnly = TRUE) # ok
      hot_col(col = 1, readOnly = TRUE) 
  })
}

shinyApp(ui = ui, server = server)

Thanks

Tables not re-sizing in shinydashboard

In the example below, the tables don't re-size when the browser window size changes and may overlap.

shiny::runGitHub("rhandsontable", "jrowen", subdir="inst/examples/rhandsontable_dash")

Is it possible to know which cell has changed?

My table does several calculations. Whenever a user inputs a change, I want to change only the cells that depend on the changed cell. Is that possible? Is there a parameter that specifies which cell has been changed?

Request: Pre-populate new rows with template values

Hello, thank you for your excellent work to create this package! I'm starting to use it within a Shiny application and I'd like any new rows to be pre-populated with some template values as seen in this example from the handsontable documentation. I didn't see any parameters in hot_table to accomplish this, but it would be a great feature to have. Let me know if you'd like me to provide more details on this idea.

Number of rows doesn't change

Hi I have come across another issue. I have a dynamic data frame in Shiny. And again - a week ago it was working fine, and now it doesn't :)
In the dynamic data frame the number of rows changes, and it used to automatically update the number of rows in the handsontable, but now it doesn't

Can't disable contextMenu

When set contextMenu=F, the right-click menu still there.

mtcars %>% rhandsontable() %>% hot_table(contextMenu=F)

R 3.2.1, rhandsontable 0.2

Recommend Projects

  • React photo React

    A declarative, efficient, and flexible JavaScript library for building user interfaces.

  • Vue.js photo Vue.js

    🖖 Vue.js is a progressive, incrementally-adoptable JavaScript framework for building UI on the web.

  • Typescript photo Typescript

    TypeScript is a superset of JavaScript that compiles to clean JavaScript output.

  • TensorFlow photo TensorFlow

    An Open Source Machine Learning Framework for Everyone

  • Django photo Django

    The Web framework for perfectionists with deadlines.

  • D3 photo D3

    Bring data to life with SVG, Canvas and HTML. 📊📈🎉

Recommend Topics

  • javascript

    JavaScript (JS) is a lightweight interpreted programming language with first-class functions.

  • web

    Some thing interesting about web. New door for the world.

  • server

    A server is a program made to process requests and deliver data to clients.

  • Machine learning

    Machine learning is a way of modeling and interpreting data that allows a piece of software to respond intelligently.

  • Game

    Some thing interesting about game, make everyone happy.

Recommend Org

  • Facebook photo Facebook

    We are working to build community through open source technology. NB: members must have two-factor auth.

  • Microsoft photo Microsoft

    Open source projects and samples from Microsoft.

  • Google photo Google

    Google ❤️ Open Source for everyone.

  • D3 photo D3

    Data-Driven Documents codes.