jpvantassel / swprocess Goto Github PK
View Code? Open in Web Editor NEWPython package for surface wave processing.
Home Page: https://pypi.org/project/swprocess/
License: Other
Python package for surface wave processing.
Home Page: https://pypi.org/project/swprocess/
License: Other


Hello Joseph
I ran the code vis_model_0.ipynb and generated the dispersion images using various methods. It also shows the picked dispersion curve from the dispersion image. I want to extract the data of the points on the picked dispersion curve in .xls or .txt format. Kindly let me know how to do that.
Dear, Joseph
Hello,
I'm Youngjun Jeon from Korea University in South, Korea.
First of all, thanks for your efforts on SWprocess.
I made two *.max files with array processing methods of rtbf and fk using Geopsy.
But from the line below, I receive an error, 'There already exists a member object with an identifier = 20220623113000.000000.'
'master_suite = swprocess.PeaksSuite.from_peakssuite(suites)'
I think it's because the two max files have an overlapping time-block (20220623113000.000000)
Is there any approach to avoid this, except using an individual time-window for each array method?
Best regards,
Youngjun Jeon
I came across an issue related to taking two surveys with the same set of offsets. When I try to process them all together with the MASW and Stats notebooks I run into an issue. I suggest an additional way of labelling the sets in adition to source offset.
MASW when trying to svae out at the end:
`KeyError Traceback (most recent call last)
Cell In[14], line 14
10 peak = swprocess.peaks.Peaks(wavefieldtransform.frequencies,
11 wavefieldtransform.find_peak_power(by="frequency-maximum"),
12 identifier=name)
13 fname = f"{prefix}_{name}m.json" if one_file_per_fname_set else f"{prefix}_masw.json"
---> 14 peak.to_json(fname=fname, append=append)
15 append = False if one_file_per_fname_set else True
File ~\pyenv\230703\lib\site-packages\swprocess\peaks.py:543, in Peaks.to_json(self, fname, append)
541 msg = "Data already exists in file with identifier "
542 msg += f"{self.identifier}, file left unmodified."
--> 543 raise KeyError(msg)
544 else:
545 data_to_update[self.identifier] = data
KeyError: 'Data already exists in file with identifier -20.0, file left unmodified.'`
Stats, when viewing the raw data:
`KeyError Traceback (most recent call last)
Cell In[16], line 28
18 # # manually set limits for first panel (frequency in this case)
19 # axs[0].set_xlim(0.1, 50)
20 # axs[0].set_ylim(0, 1000)
(...)
23 # axs[1].set_xlim(0.1, 1000)
24 # axs[1].set_ylim(0, 1000)
26 plt.show()
---> 28 main_suite = swprocess.PeaksSuite.from_peakssuite(suites)
29 _colors, _labels = [], []
30 for color, label, suite in zip(colors, labels, suites):
File ~\pyenv\230703\lib\site-packages\swprocess\peakssuite.py:906, in PeaksSuite.from_peakssuite(cls, peakssuites)
904 for peaksuite in peakssuites[1:]:
905 for peak in peaksuite:
--> 906 obj.append(peak)
908 return obj
File ~\pyenv\230703\lib\site-packages\swprocess\peakssuite.py:80, in PeaksSuite.append(self, peaks)
78 msg = "There already exists a member object with an "
79 msg += f"identifier = {peaks.identifier}."
---> 80 raise KeyError(msg)
81 self.peaks.append(peaks)
82 self.ids.append(peaks.identifier)
KeyError: 'There already exists a member object with an identifier = -20.0.'`
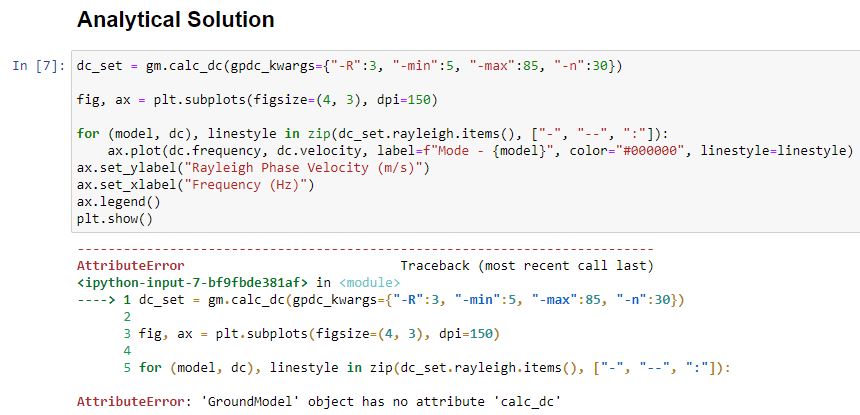
Hello Joseph
While running the code vis_model_0.ipynb, it shows an error(attached error_3) during obtaining the analytical solution. Kindly let me know what to do.
Dear, Joseph
Hello,
This is Youngjun Jeon from Korea University, again.
I trimmed dispersion data following the example script.
Now I'm looking for how to adjust the number of extracted dispersion points (final output).
If you don't mind, can you let me know which code (or *.py file) should I modify for the adjustment?
Best regards,
Youngjun
The file format that my system puts out does not include the STACK object in the header. This creates an issue with sensor1c.py when trying to import the data.
For now I have just deleted the line, but having a condition in there to deal with missing header objects may be beneficial.
I am trying to install swprocess on a Mac M1 device. But the machine does not support PyQt5. I tried installing it by changing the dependency to PyQt6. Even though it was successfully installed, I cannot run codes. Is swprocess not supported by PyQt6? Is there any alternative to installing swprocess?
Hello Joseph
I have velocity time histories from 24 receivers as an output of MASW (.xlsx format, 24 columns). How can I use masw.ipynb code for it to generate dispersion image using different methods ("fk", "slantstack", "phaseshift", "fdbf" etc.) or how can I convert it to seg2 or SU data format?
When performing 2D MASW testing, researchers may choose to use one long array to collect data. This array can then be analyzed as multiple smaller "sub-arrays" when processing the data, such that multiple 1D Vs profiles are obtained from one large array. However, swprocess does not currently allow for analyzing subsets of data when importing su or segy files.
To allow for analyzing subsets of data, it would be helpful to add an option that allows the user to select specific receivers. This would allow for users to have more control over the length of their array as well as the number of receivers they are interested in analyzing.
Hi @jpvantassel. Thanks for this package!! I am looking forward to using it. This is more of a question than an issue, but not sure where to post it. It would be nice to have an example of how to run your MASW tools on just a numpy array. I don't have segy or su files, so I am trying to figure out how to do it now. Here is where I am at, and I am wondering how best to proceed. Below I tried to make an example with random data.
# make the source object
source = swprocess.Source(-10.0, 0.0, 0.0)

# make some noise data
nstats = 11
npts = 1000
amplitude = np.random.rand(npts, nstats)

x = np.linspace(0, 100, nstats)
y = np.zeros(nstats)
z = np.zeros(nstats)

# make the sensor object
sensors = []
for i in range(nstats):
    sensor = swprocess.Sensor1C(amplitude[:,i], dt, x[i], y[i], z[i])
    sensors.append(sensor)

data_array = swprocess.Array1D(sensors, source)

_ = data_array.plot()
_ = data_array.waterfall()
Everything seems good to here and the plots look at expected. data_array is swprocess.array1d.Array1D.
Now, if I build settings following your jupyter notebook example, I more or less end up thinking I should be able to run something like
swprocess.Masw.run(fnames=data_array, settings=settings)
Obviously this dos not work. fnames should be a list of filenames. Any tips on how to proceed and run MASW on this data matrix?
Dear Joseph
Hello,
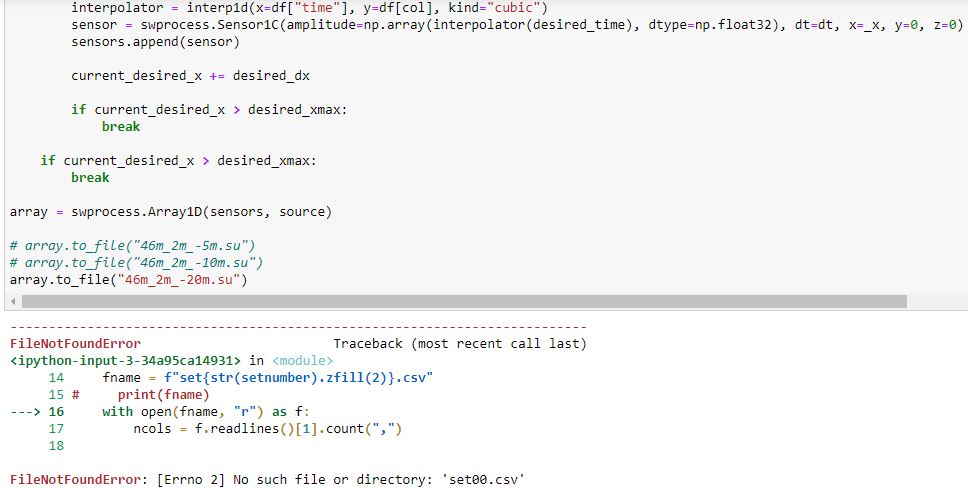
I am Aniket Desai from the Indian Institute of Technology, Roorkee, India.
While running the code create_su.ipynb, it shows the error '[Errno 2] No such file or directory: 'set00.csv''. (Figure attached).
I guess this .csv files are missing in the folders model_0, model_1, model_2 and model_3. I request you to provide these files.
Also, I have velocity time histories from 24 receivers as an output of MASW (.xlsx format, 24 columns). How can I use masw.ipynb code for it to generate dispersion image using different methods ("fk", "slantstack", "phaseshift", "fdbf" etc.) or how can I convert it to seg2 or SU data format?
Hi Joseph,
I was trying to use your software to process active MASW data. Each offset is already stacked I was getting error at the "Analysis" section of the jupyter notebook. I know you mentioned the input is unstacked shot record at each shot location. Is there any walk around for using already stacked data?
I'm getting an error with the MASW that seems to be related to the .dat example files. Please see attached file with full error message
There is no data in the extract_startandend.csv file in the extract example
I need more clarification about using .dat files for the MASW survey to get a 2D section, I followed the steps in "examples/masw/masw.ipynb" and it was useful to get the dispersion curve and other info, Is there any Jupiter Notebook to get 2D section, I searched in your documentation to find any code doing this step, could you tell me how to do this step with simple way, please
Hi Joe,
My name is Chukwuma Okonkwo and I am a PhD student at University of Southern California. I am encountering an issue running the stats notebook. When I try running the Launch section of the code under Interactive Trimming, I get the error "C:\Users\chris\anaconda3\Lib\site-packages\swprocess\peaks.py:400: UserWarning: reject_outside called, but limits were both None, therefore no values were rejected.", and the code runs non-stop. I will be glad if you can help resolve the issue. Thanks for your consideration.
Hi Joe,
I have been trying to run the stats notebook on Designsafe as well as my school's HPC but I when I run the section "Launch" for the trimming, it just keeps running for hours non-stop and there is no error message. Is that normal or could I be doing something wrong?
Thanks.
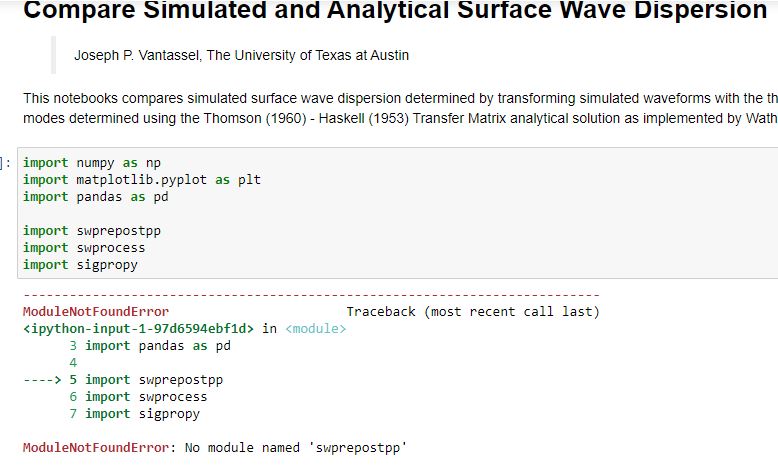
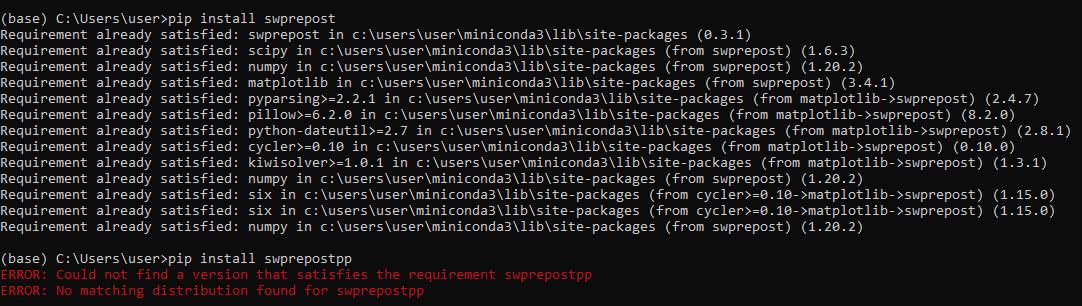
Hello Joseph
While running the code vis_model_0.ipynb and other such codes(vis_model_1.ipynb and others), it shows an error(attached error_1). While doing pip install, it again shows an error (attached error_2). Kindly let me know what to do.
A declarative, efficient, and flexible JavaScript library for building user interfaces.
🖖 Vue.js is a progressive, incrementally-adoptable JavaScript framework for building UI on the web.
TypeScript is a superset of JavaScript that compiles to clean JavaScript output.
An Open Source Machine Learning Framework for Everyone
The Web framework for perfectionists with deadlines.
A PHP framework for web artisans
Bring data to life with SVG, Canvas and HTML. 📊📈🎉
JavaScript (JS) is a lightweight interpreted programming language with first-class functions.
Some thing interesting about web. New door for the world.
A server is a program made to process requests and deliver data to clients.
Machine learning is a way of modeling and interpreting data that allows a piece of software to respond intelligently.
Some thing interesting about visualization, use data art
Some thing interesting about game, make everyone happy.
We are working to build community through open source technology. NB: members must have two-factor auth.
Open source projects and samples from Microsoft.
Google ❤️ Open Source for everyone.
Alibaba Open Source for everyone
Data-Driven Documents codes.
China tencent open source team.