Coder Social home page Coder Social logo

vmware-grafana's Introduction

How to monitor a VMware vSphere Environment using Telegraf, InfluxDB and Grafana

Once you import the Grafana Dashboards on your Environment, it should look all like these:

VMware vSphere Overview Dashboard VMware vSphere Overview Dashboard

VMware vSphere Hosts Dashboard VMware vSphere Hosts Dashboard

VMware vSphere Datastores Dashboard VMware vSphere Datastores Dashboard

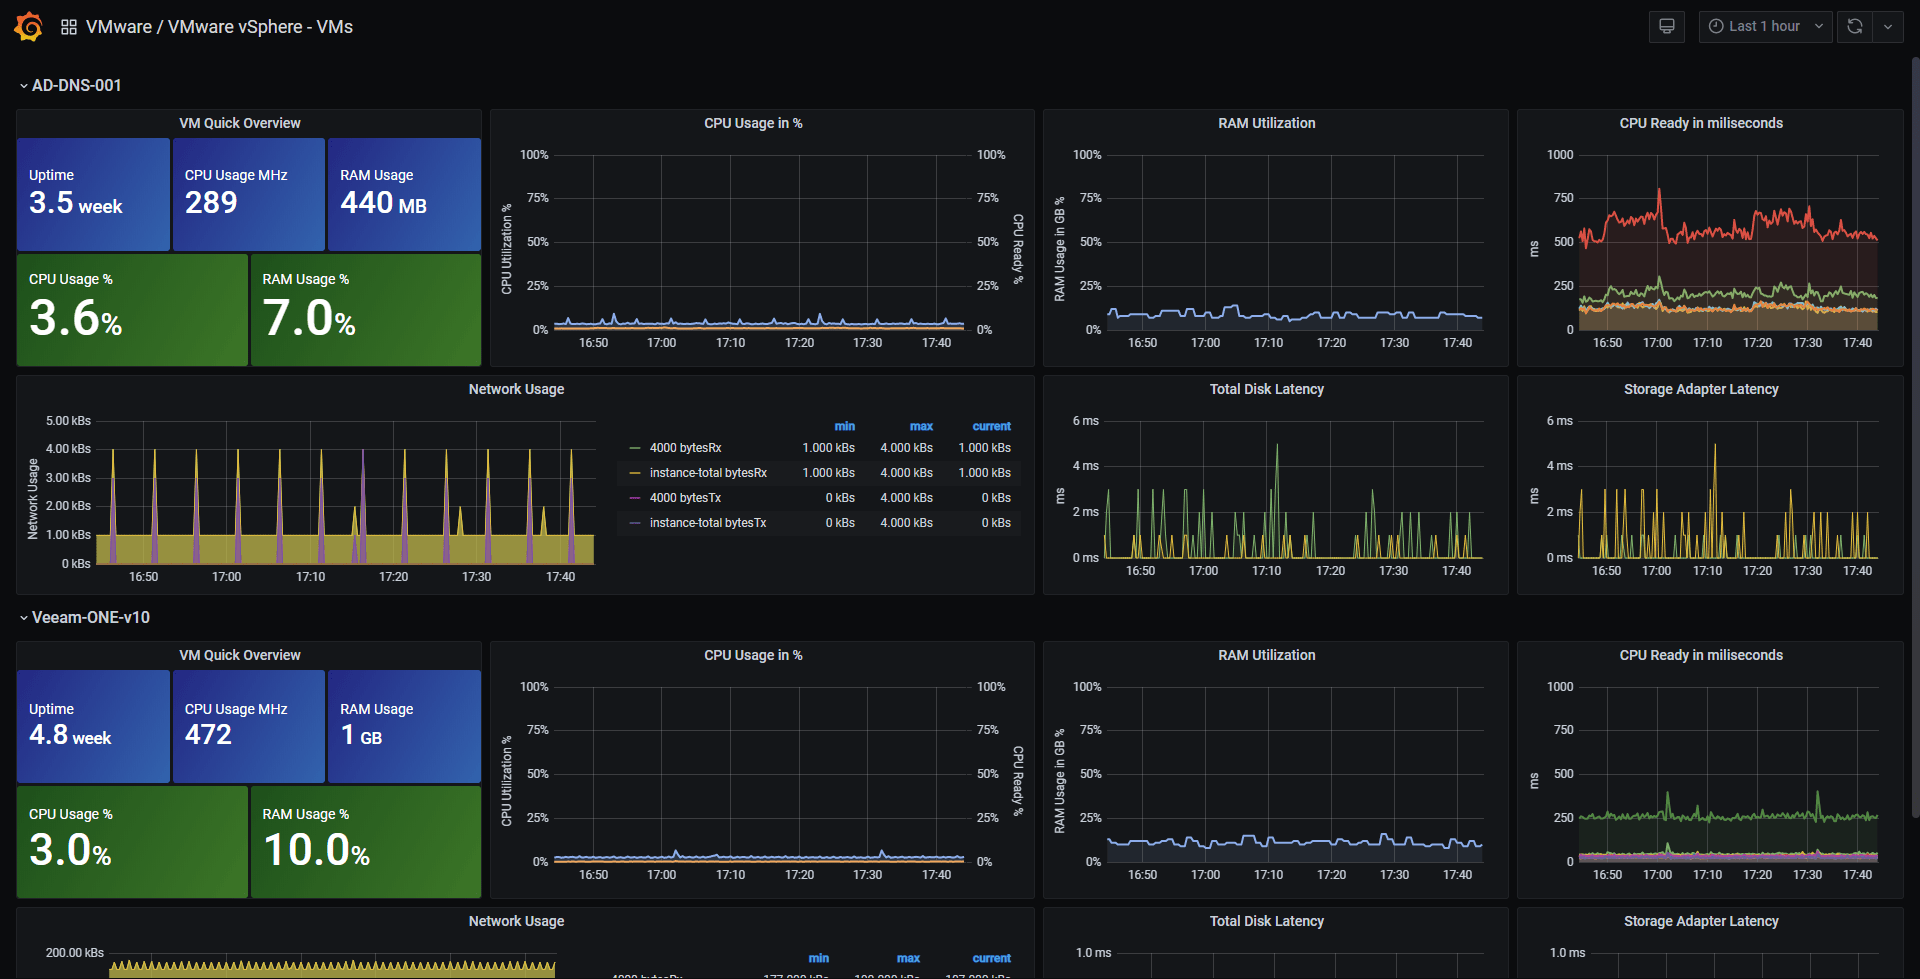
VMware vSphere VMs Dashboard VMware vSphere VMs Dashboard


Getting started

You can follow the steps on the next Blog Post in English - https://jorgedelacruz.uk/2018/10/01/looking-for-the-perfect-dashboard-influxdb-telegraf-and-grafana-part-xii-native-telegraf-plugin-for-vsphere/

But in case you want a quick bullet point list:

  • Make sure you have Telegraf v1.8.0 or above, then read about the vSphere Plugin here - https://github.com/influxdata/telegraf/tree/release-1.8/plugins/inputs/vsphere
  • Edit the vSphere Plugin and add your vCenter IP or FQDN, user and credentials, and enable the sections you want to monitor or exclude from your vSphere.
  • Restart the Telegraf service
  • Download the VMware vSphere Grafana Dashboards JSON filee and import them into your Grafana
  • Enjoy (:

Additional Information

  • This repository it's just intended to provide the Dashboard json files and some help

Legacy steps for PowerShell Information

This project consists in two Powershell scripts by Mike Nisk - https://github.com/vmkdaily to retrieve the vSphere information and send it directly to InfluxDB, then in Grafana: a Dashboard is created to present all the information.

Getting started

You can follow the steps on the next Blog Post in Spanish - https://www.jorgedelacruz.es/2017/06/12/en-busca-del-dashboard-perfecto-influxdb-telegraf-y-grafana-parte-vii-monitorizar-vsphere/

But in case you can't read Spanish:

  • Download the Scripts from the official repo https://github.com/vmkdaily/vFlux-Stats-Kit to the computer you want to run the Scripts periodically
  • You should have VMware PowerCLI on this machine
  • Edit the Scripts and add your InfluxDB IP or FQDN, InfluxDB users and Database, logging, etc.
  • Run the Scripts to check that you can retrieve the information properly
  • Schedule the Scripts in Windows to run every X minutes, where you decide the X
  • Download the VMware Stats Grafana JSON file and import it into your Grafana
  • Change your inforamtion inside the Grafana and enjoy :)

VMware vSphere Overview Dashboard using PowerShell alt tag

vmware-grafana's People

Contributors

drewstinnett avatar jorgedlcruz avatar

Stargazers

 avatar  avatar  avatar  avatar  avatar  avatar  avatar  avatar  avatar  avatar  avatar  avatar  avatar  avatar  avatar  avatar  avatar  avatar  avatar  avatar  avatar  avatar  avatar  avatar  avatar  avatar  avatar  avatar  avatar  avatar  avatar  avatar  avatar  avatar  avatar  avatar  avatar  avatar  avatar  avatar  avatar  avatar  avatar  avatar  avatar  avatar  avatar  avatar  avatar  avatar  avatar  avatar  avatar  avatar  avatar  avatar  avatar  avatar  avatar  avatar  avatar  avatar  avatar  avatar  avatar  avatar  avatar  avatar  avatar  avatar  avatar  avatar  avatar  avatar  avatar  avatar  avatar  avatar  avatar  avatar  avatar  avatar  avatar  avatar  avatar  avatar  avatar  avatar  avatar  avatar  avatar  avatar  avatar  avatar  avatar  avatar  avatar  avatar  avatar  avatar

Watchers

 avatar  avatar  avatar  avatar  avatar  avatar  avatar  avatar  avatar  avatar  avatar  avatar

vmware-grafana's Issues

CPU utilization is showing wrong in the grafana dashboard

  • CPU utilization is showing wrong on at the cluster level

    • Actual value in the Grafana dashboard:
      image

    • actual value in the vCenter level
      image

  • Calculation:

    • Memory used: (95.5/255.88)*100=37.27 % in GiB
    • CPU used: (5.5/23.97)*100= 22.95 % in GHZ

As per the above calculation the above memory utilization is showing correct but not the CPU utilization. And its same for all the clusters that I have in my vCenter. Seems like instead of showing the utilization its showing the free amount for CPU.

  • Similarly for another cluster, its continuously showing the CPU utilization s 100% but the actual utilization in vCenter is different.
    • Grafana utilization:
      image

    • vCenter utilization:
      image

invalid: compilation failed: error at :@xx:xx-xx:xx expected comma in property list, got LPAREN

  • Grafana is unable to load data from InfluxDB and showing the following error message in the dashboard:
invalid: compilation failed: error at :@xx:xx-xx:xx expected comma in property list, got LPAREN

image

  • Product version:

    • grafana: v7.5.4
    • influxdb: 2.0.4
    • telegraf: 1.18.1
    • vSphere 7.0 6.5, 6.7
  • Datasource configuration using Flux QL:

image

Data visible correctly at InfluxDB level but grafana is unable to read those.

vmware-vsphere-overview: VM Disk Performance values issue

Hi,
the module shows completely different values when choosing different time ranges. For example, in seven days at VM peak value = 1,053K iops, if you take in three days = 3,049K iops, if you select this peak value (cut in 5 hours) = 12,56K iops, in 30 minutes = 15,76K iops

image

image

image

image

Name of your dash [request]

Can you change the name of your json file without space. it is easier to integrate with script (via ansible) into grafana :).

Possible Wrong Filter

The "Network Usage" panel of the "VMware vSphere - VMs" dashboard has 2 queries. The one that's selecting bytesTx_average is grouping by tag(disk).

I'm not sure if this is intentional or not, but it creates an "undefined bytesTx" in the legend.

VMware vSphere -VMs - Large infrastructure

Is there any way to make the dashboard load all the panels, without trying to consume all the data?

We have about 600 vm's, and this page takes forever to load, and eats up lots of memory (60GB) just to render. Anyway to have this load without processing data unless a panel is clicked?

CPU Utilization Avg % not displaying data

Hi,
I've been trying to figure out why is there no data for usage_average in vsphere_vm_cpu - I can see in the telegraf.conf that there is no field usage_average? I've checked the official config here - https://github.com/influxdata/telegraf/tree/master/plugins/inputs/vsphere but the closest thing in vm_metric_include is cpu.used.summation - am I missing something?

It is interesting that in the sample output, they are showing vsphere_vm_cpu generating data for usage_average, but in the actual sample config, there is no such field? Is this supposed to be generated dynamically somehow, or calculated in the graph itself?

I'm collecting data from ESXi 6.7 hosts via vCenter Server Appliance 6.7

I know this is a most likely bug within Telegraf itself, just want to check if this is actually showing data for other people in the VM dashboard?

VMware - vSphere Overview : panel y axis wrongly named for DT usage capacity

Hello,

I noticed small issue about the overview dashboard. More precisely the panel "Datastores - Usage Capacity".

The data calculated is the used space and not the free space as mentioned on Y axis:

image

Adjusted label but good to know to fix by default on your side ;)

Good job for those impressive dashboard!

There are missing data in the Dashboard (Cluster & Datastore)

Relevant telegraf.conf:

## Realtime instance
[[inputs.vsphere]]
## List of vCenter URLs to be monitored. These three lines must be uncommented
## and edited for the plugin to work.
  interval = "20s"
  vcenters = [ "https://10.1.x.x/sdk" ]
  username = "[email protected]"
  password = "pass"

  vm_metric_include = []
  host_metric_include = []
  cluster_metric_include = []
  datastore_metric_exclude = ["*"]

  max_query_metrics = 256
  timeout = "120s"
  insecure_skip_verify = true

## Historical instance
[[inputs.vsphere]]
  interval = "300s"
  vcenters = [ "https://10.1.x.x/sdk" ]
  username = "[email protected]"
  password = "pass"

  datastore_metric_include = [ "disk.capacity.latest", "disk.used.latest", "disk.provisioned.latest"]
  insecure_skip_verify = true
  force_discover_on_init = true
  host_metric_exclude = ["*"] # Exclude realtime metrics
  vm_metric_exclude = ["*"] # Exclude realtime metrics

  max_query_metrics = 256
  collect_concurrency = 3

System info:

[root@centos]: $ cat /etc/*-release | grep "VERSION="
VERSION="8 (Core)"
CENTOS_MANTISBT_PROJECT_VERSION="8"
REDHAT_SUPPORT_PRODUCT_VERSION="8"

[root@centos]: $ telegraf --version
Telegraf 1.15.3 (git: HEAD fac81815)

[root@centos]: $ grafana-server -v
Version 7.2.0 (commit: efe4941ee3, branch: HEAD)

[root@centos]: $ influx --version
InfluxDB shell version: 1.8.3

Expected behavior:

  • Display the number of clusters available in the overview dash
  • View Datastore ReadAverage & WriteAverage metrics

Actual behavior:

  • Nothing is displayed on the Dashboard

Additional info:

Query for number of cluster:
SELECT count(distinct("clustername")) AS "Cluster" FROM (SELECT "totalmhz_average", "clustername" FROM "vsphere_cluster_cpu" WHERE $timeFilter)

Query for ReadAverage & WriteAverage:
SELECT mean("numberReadAveraged_average") FROM "vsphere_datastore_datastore" WHERE ("source" =~ /^$datastore$/) AND $timeFilter GROUP BY time(5m), "source" fill(none)

Connected to http://localhost:8086 version 1.8.3
InfluxDB shell version: 1.8.3
> use telegraf
Using database telegraf
> show measurements
name: measurements
name
----
vsphere_cluster_clusterServices
vsphere_cluster_mem
vsphere_cluster_vmop
vsphere_datacenter_vmop
vsphere_datastore_disk
vsphere_host_cpu
vsphere_host_datastore
vsphere_host_disk
vsphere_host_hbr
vsphere_host_mem
vsphere_host_net
vsphere_host_power
vsphere_host_rescpu
vsphere_host_storageAdapter
vsphere_host_storagePath
vsphere_host_sys
vsphere_host_vflashModule
vsphere_vm_cpu
vsphere_vm_datastore
vsphere_vm_disk
vsphere_vm_mem
vsphere_vm_net
vsphere_vm_power
vsphere_vm_rescpu
vsphere_vm_sys
vsphere_vm_virtualDisk

As you can see no measurement exists with the name vsphere_cluster_cpu or vsphere_datastore_datastore.

Can you look on your side and fix this please ? Gracias por tu ayuda :)

BR.

Graf look alike but different values

Hi,

I use InfluxDB v2.7.1 , Grafana Version 10.1.0 , Telegraf 1.27.4 , for collecting metric from my vmware environment.
In Grafan I import dashbord VMware vSphere - VMs ( ID 8168 ) .
I notice that i vCenter and Influx graph are the same but in Grafana dashboard witch represent network traffic are different.
Here are the picture of a problem.
NetDashbord
NetInflux
NetvCSA
I telegraph agent is collecting all metric for host and vms, nothing is exulted.
Here are the picture of a problem.

[input.vsphere]: Error while getting metric metadata.

Hi, Tried to implement the template telegraf.conf (Added InfluxDB as output)
unfortunately my telegraf gives me following errors:

2018-10-23T12:19:47Z I! Starting Telegraf 1.8.1
2018-10-23T12:19:47Z I! Loaded inputs: inputs.vsphere
2018-10-23T12:19:47Z I! Loaded aggregators: 
2018-10-23T12:19:47Z I! Loaded processors: 
2018-10-23T12:19:47Z I! Loaded outputs: influxdb
2018-10-23T12:19:47Z I! Tags enabled: host=17e81504ea04
2018-10-23T12:19:47Z I! Agent Config: Interval:10s, Quiet:false, Hostname:"17e81504ea04", Flush Interval:10s 
2018-10-23T12:19:50Z E! [input.vsphere]: Error while getting metric metadata. Discovery will be incomplete. Error: ServerFaultCode: A specified parameter was not correct: entity

The database has information about VM names e.al. but no performance metrics.
Could you support with an idea of where things are going wrong?

Environment:
HPE Proliant Microserver Gen8, Vmware ESXi 6.7.0 (Build 8169922) Custom HPE build (free version)
Telegraf & InfluxDB running in a docker on the ESXi host.

telegraf.conf:

[[outputs.influxdb]]
      urls = ["http://192.168.10.14:8086"] # required
      database = "mumindalen_esxi" # required

      ## Write timeout (for the InfluxDB client), formatted as a string.
      ## If not provided, will default to 5s. 0s means no timeout (not recommended).
      timeout = "10s"
      username = "username"
      password = "password"
      ## Set the user agent for HTTP POSTs (can be useful for log differentiation)
      # user_agent = "telegraf"
      ## Set UDP payload size, defaults to InfluxDB UDP Client default (512 bytes)
      # udp_payload = 512


# Read metrics from one or many vCenters
[[inputs.vsphere]]
    ## List of vCenter URLs to be monitored. These three lines must be uncommented
  ## and edited for the plugin to work.
  vcenters = [ "https://mylocalIP/sdk" ]
  username = "" #Uing my normal password here (for webUI)
  password = "password"

  ## VMs
  ## Typical VM metrics (if omitted or empty, all metrics are collected)
  vm_metric_include = [
    "cpu.demand.average",
    "cpu.idle.summation",
    "cpu.latency.average",
    "cpu.readiness.average",
    "cpu.ready.summation",
    "cpu.run.summation",
    "cpu.usagemhz.average",
    "cpu.used.summation",
    "cpu.wait.summation",
    "mem.active.average",
    "mem.granted.average",
    "mem.latency.average",
    "mem.swapin.average",
    "mem.swapinRate.average",
    "mem.swapinRate.average",
    "mem.swapout.average",
    "mem.swapoutRate.average",
    "mem.usage.average",
    "mem.vmmemctl.average",
    "net.bytesRx.average",
    "net.bytesTx.average",
    "net.droppedRx.summation",
    "net.droppedTx.summation",
    "net.usage.average",
    "power.power.average",
    "virtualDisk.numberReadAveraged.average",
    "virtualDisk.numberWriteAveraged.average",
    "virtualDisk.read.average",
    "virtualDisk.readOIO.latest",
    "virtualDisk.throughput.usage.average",
    "virtualDisk.totalReadLatency.average",
    "virtualDisk.totalWriteLatency.average",
    "virtualDisk.write.average",
    "virtualDisk.writeOIO.latest",
    "sys.uptime.latest",
  ]
  # vm_metric_exclude = [] ## Nothing is excluded by default
  # vm_instances = true ## true by default

  ## Hosts
  ## Typical host metrics (if omitted or empty, all metrics are collected)
  host_metric_include = [
    "cpu.coreUtilization.average",
    "cpu.costop.summation",
    "cpu.demand.average",
    "cpu.idle.summation",
    "cpu.latency.average",
    "cpu.readiness.average",
    "cpu.ready.summation",
    "cpu.swapwait.summation",
    "cpu.usage.average",
    "cpu.usagemhz.average",
    "cpu.used.summation",
    "cpu.utilization.average",
    "cpu.wait.summation",
    "disk.deviceReadLatency.average",
    "disk.deviceWriteLatency.average",
    "disk.kernelReadLatency.average",
    "disk.kernelWriteLatency.average",
    "disk.numberReadAveraged.average",
    "disk.numberWriteAveraged.average",
    "disk.read.average",
    "disk.totalReadLatency.average",
    "disk.totalWriteLatency.average",
    "disk.write.average",
    "mem.active.average",
    "mem.latency.average",
    "mem.state.latest",
    "mem.swapin.average",
    "mem.swapinRate.average",
    "mem.swapout.average",
    "mem.swapoutRate.average",
    "mem.totalCapacity.average",
    "mem.usage.average",
    "mem.vmmemctl.average",
    "net.bytesRx.average",
    "net.bytesTx.average",
    "net.droppedRx.summation",
    "net.droppedTx.summation",
    "net.errorsRx.summation",
    "net.errorsTx.summation",
    "net.usage.average",
    "power.power.average",
    "storageAdapter.numberReadAveraged.average",
    "storageAdapter.numberWriteAveraged.average",
    "storageAdapter.read.average",
    "storageAdapter.write.average",
    "sys.uptime.latest",
  ]
  # host_metric_exclude = [] ## Nothing excluded by default
  # host_instances = true ## true by default

  ## Clusters
  # cluster_metric_include = [] ## if omitted or empty, all metrics are collected
# cluster_metric_exclude = ["*"] ## Nothing excluded by default
  # cluster_instances = true ## true by default

  ## Datastores
  # datastore_metric_include = [] ## if omitted or empty, all metrics are collected
  # datastore_metric_exclude = [] ## Nothing excluded by default
  # datastore_instances = false ## false by default for Datastores only

  ## Datacenters
  datacenter_metric_include = [] ## if omitted or empty, all metrics are collected
  datacenter_metric_exclude = [ "*" ] ## Datacenters are not collected by default.
  # datacenter_instances = false ## false by default for Datastores only

  ## Plugin Settings
  ## separator character to use for measurement and field names (default: "_")
  # separator = "_"

  ## number of objects to retreive per query for realtime resources (vms and hosts)
  ## set to 64 for vCenter 5.5 and 6.0 (default: 256)
   max_query_objects = 256

  ## number of metrics to retreive per query for non-realtime resources (clusters and datastores)
  ## set to 64 for vCenter 5.5 and 6.0 (default: 256)
   max_query_metrics = 256

  ## number of go routines to use for collection and discovery of objects and metrics
  collect_concurrency = 1
  discover_concurrency = 1

  ## whether or not to force discovery of new objects on initial gather call before collecting metrics
  ## when true for large environments this may cause errors for time elapsed while collecting metrics
  ## when false (default) the first collection cycle may result in no or limited metrics while objects are discovered
  force_discover_on_init = false

  ## the interval before (re)discovering objects subject to metrics collection (default: 300s)
  object_discovery_interval = "600s"

  ## timeout applies to any of the api request made to vcenter
  timeout = "20s"

  ## Optional SSL Config
  # ssl_ca = "/path/to/cafile"
  # ssl_cert = "/path/to/certfile"
  # ssl_key = "/path/to/keyfile"
  ## Use SSL but skip chain & host verification
  insecure_skip_verify = true

Auto scaling time interval - Overview Dashboard

Hey,

first thanks for your work, these Dashboards are awesome!
Today I ran a bit in trouble cause I wanted to show the Overview Dashboard for around 30 days. This first overload my influxDB but the failed the query.

In my case the issue were the VM stats on the Board. They didn´t scale the requested data points.
So for the "Virtual Machine CPU Usage in %" you query the mean usage_average and group them by 20 seconds.

For 30d that´s not needed to have it in 20 seconds steps so I´ve changed this to $_interval which will auto scale the "group by" requested time.
I´ve changed this for most of the querys on the overview dashboard which result in much faster loading.

Is there a specific reason why you use group by 20sec and not $_interval ?

Example here:
https://github.com/jorgedlcruz/vmware-grafana/blob/master/VMware%20vSphere%20-%20Overview.json#L4819

Alerts

Hows possible to generate Alerts for Special Tresholds?

Incorrect values due to use of mean() on already averaged values

I've noticed that the Overview dashboard showed incorrect IOPS when specific VM is selected. I've been executing a benchmark and I was closely monitoring the IOPS in the application and VMware earlier, but when I checked Grafana, the values were about twice as low compared to the actual values.
Looks like the mean() function which is used by default averages the values, however, the metric itself is averaged already (for example numberReadAveraged_average). When I selected last() instead, the correct values were shown for IOPS.
I guess this applies to several other metrics which are averaged in the data itself, using last() there would greatly improve the accuracy.

Query tags from InfluxDB with respect of timeFilter for Grafana variables templating

Hi,

You use InfluxDB tags as variables in Grafana and I would like to limit tags by time range selected there.

Using $timeFrame is supported for select InfluxDB queries but tags are returned by "SHOW TAGS" which doesn't support $timeFrame: influxdata/influxdb#5668

For example in the parameters of this variable I have old names of VMs that appear when they no longer exist following the selection of the time range
image

I tested the following query and it seems to work well (maybe to be optimized?) :

SHOW TAG VALUES FROM vsphere_vm_cpu WITH KEY=vmname WHERE "vcenter" =~ /$vcenter/ to SELECT DISTINCT("vmname") FROM (SELECT * FROM "vsphere_vm_cpu" WHERE $timeFilter AND "vcenter" =~ /$vcenter/)

The workaround appears to involve subqueries, and retrieves every point in the timeFilter -- grafana handles the de-dupe

SELECT "tag" FROM (SELECT "field", "tag" FROM "table" WHERE $timeFilter)

Could you fix this bug in all dashboards, please?

Thank you in advance for your help.

Not work

Hello.

Set up telegraph via vmware plugin in influxbd2. Everything is displayed in inffluxbd2, but as soon as it starts adding data to grafana, it does not display the data. It only sees host esxi, does not receive other data

Environment:

Grafana version: Grafana 8.3.4
Data source type & version: InfluxDb_v2
User OS & Browser:Centos7

vSphere - Hosts cpu usage

I use your VMware Vsphere - Hosts grafana dashboard, but when I looked at the CPU Usage, it didn't reflect what i was seeing in the vSphere client.
I found that the query didn't use the instance-total cpu WHERE clause
After adding this it reflected what I saw i vSphere.

SELECT mean("usage_average") FROM "vsphere_host_cpu" WHERE ("esxhostname" =~ /^$esxi$/ AND "cpu" = 'instance-total') AND $timeFilter GROUP BY time($__interval) fill(null)

Thanks a lot for creating great dashboards.

error parsing query: missing parameter: __interval

InfluxDB Error Response: error parsing query: missing parameter: __interval

Just testing this dashboard for first time... All the graphs show this error! Any idea what it means?

Thanks a lot,
Mohamed.

VM CPU Usage % Doesn't Seem Right

CPU Usage % doesn't seem to be accurately reflected.

This is what I see in Grafana:

image

This is what I see for the same timeframe within vCenter:

image

I would expect Grafana, since it claims to show % Usage, to somewhat match what vCenter says for Usage, which more or less matches Task Manager at the OS level.

In Grafana, all of my VMs never really get over 1% usage which is definitely not accurate. Am I doing something wrong?

  • Grafana v9.2.5 which a fresh grab yesterday of the Dashboards
  • InfluxDB v2.5.1

It looked like InfluxDB v2 was supported and most things are looking great so I didn't think it was that either.

Issue getting cluster names from vcenter

Specs:
VCenter 6.7 U3
Telegraf 1.15.2
CentOS 8
Grafana 7.1.1
Influxdb Shell 1.8.1

The clusternames variable in the dashboard is not populating. I have two clusters and neither appear in the list. The vcenter server and esxi hosts populate correctly. The cluster CPU and mem usage are reporting incorrectly as well but I think this might be a product of the clusternames variable not populating correctly. Is there anything I can do to help troubleshoot this?

Unable to get datastore details in Grafana Dashboard

I have configured Grafana dashboard for Single ESXi host and below are mentioned version I have used. I got all dashboard details except datastore. I am not able to get data store details as shown below screenshot & getting below error log in telegraf. Please refer telegraf config file and help me out.

Grafana: 9.4.3
InfluxDB: v2.6.1
Telegraf: 1.25.3

Telegraf Config file for Datastore.

Historical instance

[[inputs.vsphere]]
interval = "300s"
timeout = "300s"
separator = "_"
vcenters = [ "https://192.192.7.18/sdk" ]
username = "grafana"
password = "secret-pwd"
insecure_skip_verify = true
use_int_samples = false

force_discover_on_init = true
max_query_metrics = 256
collect_concurrency = 3

datastore_metric_include = []
host_metric_exclude = [""] # Exclude realtime metrics
vm_metric_exclude = ["
"] # Exclude realtime metrics

Error getting in Telegraf logs

D! [inputs.vsphere] Find(Datastore, /*/datastore/**) returned 4 objects
D! [inputs.vsphere] Found 202 metrics for ESX01.local
E! [inputs.vsphere] Getting metric metadata. Discovery will be incomplete. Error: ServerFaultCode: A specified parameter was not correct: entity
D! [inputs.vsphere] Found 0 metrics for EMC_6_1_LUN
E! [inputs.vsphere] Getting metric metadata. Discovery will be incomplete. Error: ServerFaultCode: A specified parameter was not correct: entity
D! [inputs.vsphere] Found 0 metrics for datastore1
E! [inputs.vsphere] Getting metric metadata. Discovery will be incomplete. Error: ServerFaultCode: A specified parameter was not correct: entity
D! [inputs.vsphere] Found 0 metrics for LenovoESX01
E! [inputs.vsphere] Getting metric metadata. Discovery will be incomplete. Error: ServerFaultCode: A specified parameter was not correct: entity
Datastore Details

Incorrect numbers

Hi!

VMWare monitoring and influxdb show different numbers than Grafana dashboard.

Seems like Dashboard cut of one number from the data like if i have 2000ms in Vmware and influx the dashboard cut back to only 200.

InfluxDB
image

Vmware monitoring:
image

Dashboard:
image

VMware vSphere -VMs - show only 10VMs

Hi,
i have more than 300+ VMs and in VM dashboard i can only see 10 random VMs

is there any way to increase number of showed VMs/page
thanks
tomislav

Query to Database Failing - Large Number of VMs

I have a large environment of over 400 virtual machines on 1 vCenter, with these VMs having fairly long names (20+ characters).

This issue only occurs on the Overview dashboard when all VMs in the top bar is selected. Selecting multiple VMs manually (up to around 100) will work fine, but as soon as you go over a certain number, it fails to query. I suspect this is a limit on how long the query can be, with all VMs being selected it would have to include all the VM names in the query, and with over 400 long VM names I could see that being the issue.

This mainly affects the VM-related monitoring graphs at the bottom of the overview, but can also cause other graphs, such as the main overview at the top of the dashboard to fail at random times.

Thank you for the great dashboard templates, hopefully, this can be resolved someway.

VMware vSphere -VMs - show only 20VMs

Hi,
i have more than 300+ VMs and in VM dashboard i can only see 20 random VMs

is there any way to increase number of showed VMs/page
thanks

My System Version
telegraf-1.13.1-1.x86_64
influxdb-1.7.9-1.x86_64
grafana-6.5.3-1.x86_64

1
2

Gaps in collected metric

Hia !

I don't know if it's the best place for my issue but I'm facing gaps in the collected metric.
https://i.imgur.com/gnjmSMN.png
Is this an issue you've been facing ?
Here is my telegraf.conf :

metric_batch_size = 30000
metric_buffer_limit = 10000000
round_interval = true
flush_interval = "300s"

and my input.conf

[[inputs.vsphere]]

  interval = "20s"

  ## List of vCenter URLs to be monitored. These three lines must be uncommented
  ## and edited for the plugin to work.
  vcenters = [ "https://vcenter/sdk" ]
  username = "username"
  password = "password"

  ## VMs
  ## Typical VM metrics (if omitted or empty, all metrics are collected)
  vm_metric_include = []
 
 ## Hosts
  host_metric_include = []

  ## Datastores
  datastore_metric_include = [] ## if omitted or empty, all metrics are collected
  datastore_metric_exclude = [] ## Nothing excluded by default

  ## Datacenters
  datacenter_metric_include = [] ## if omitted or empty, all metrics are collected
  datacenter_metric_exclude = [ "*" ] ## Datacenters are not collected by default.

  ## number of go routines to use for collection and discovery of objects and metrics
  collect_concurrency = 5
  discover_concurrency = 5

 timeout = "240s"

 insecure_skip_verify = true

Telegraf logs don't report anything stange happening, just that sometimes, the number of metrics pulled from the Hosts varies.

Could you provide your Telegraf settings + input for comparison ?
Do you use the concurrency ?

Thank you !

vSphere view is just showing 3 objects

  • vSphere view is showing just 3 objects like vCenter, ESXi & datastore.
    image

  • Other components like VM, cluster & overall vCenter level utilization is missing which is there in your document:
    image

Not sure from which version its broken because from the beginning I can see only 3 objects of a vCenter.

not working in my stack

X-Influxdb-Version: 1.8.10
Telegraf 1.23.4 (git: HEAD 5b48f5da)
Grafana: v9.1.0 (82e32447b4)

Chronograf Version: 1.9.4:

SNAG-0131

SNAG-0132

But when put all into grafana
SNAG-0133

how can solve this?

Metric Mappings are wrong for some Panels Hosts/vms

Total Disk Latency = it shows "KBps" but should be ms

Storage Adapter Latency = should be deviceReadLatency_average and deviceWriteLatency_average (but it shows numberReadAveraged_average and numberWriteAveraged_average). So instead of Latency it shows the Commands Issues per Second

it would be nice to see how to implement as well kernel latency and guest latency and other kind of Panels if needed.

vSphere overview - blank

Just installed telegraf and imported your grafana dashboards. The only dashboard that works, is the one for HOSTS. Overview, VM and Datastore are blank.
Anyone have any insight to what could be wrong?

Standalone ESXi compatability

Does this work with standalone ESXi servers. I have a fully licensed ESXi instance and am successfully gathering "VMware vSphere - Hosts" & "- Overview" statistics. However "- VMs" & "-Datastore" graphs are empty.

If this is the wrong forum, I apologize. I'm a newbie and just getting my feet wet.

Chris

Recommend Projects

  • React photo React

    A declarative, efficient, and flexible JavaScript library for building user interfaces.

  • Vue.js photo Vue.js

    🖖 Vue.js is a progressive, incrementally-adoptable JavaScript framework for building UI on the web.

  • Typescript photo Typescript

    TypeScript is a superset of JavaScript that compiles to clean JavaScript output.

  • TensorFlow photo TensorFlow

    An Open Source Machine Learning Framework for Everyone

  • Django photo Django

    The Web framework for perfectionists with deadlines.

  • D3 photo D3

    Bring data to life with SVG, Canvas and HTML. 📊📈🎉

Recommend Topics

  • javascript

    JavaScript (JS) is a lightweight interpreted programming language with first-class functions.

  • web

    Some thing interesting about web. New door for the world.

  • server

    A server is a program made to process requests and deliver data to clients.

  • Machine learning

    Machine learning is a way of modeling and interpreting data that allows a piece of software to respond intelligently.

  • Game

    Some thing interesting about game, make everyone happy.

Recommend Org

  • Facebook photo Facebook

    We are working to build community through open source technology. NB: members must have two-factor auth.

  • Microsoft photo Microsoft

    Open source projects and samples from Microsoft.

  • Google photo Google

    Google ❤️ Open Source for everyone.

  • D3 photo D3

    Data-Driven Documents codes.