This repo contains advanced methods, please check my other repos or watch Phone Hacking Series 1 for introductory videos.
If we are to be accurate and precise in informing the world about how mobile malware, and spyware work, we must be able to do a proper forensic analysis that can definitively say when a camera was turned on, when microphones were turned off, the frequency of these services running, what application are they attaching to, and how is the data being exfiltrated.
- Kernel Trace Analysis
- Wake Lock Analysis
- Power Monitor Analysis
Currently I am teaching live phone hacking sessions and I will be updating this repository each week. Phone Hacking Season 2 can be found on my Youtube Channel https://www.youtube.com/jonathandata1
- iOS
- WatchOS
- iPadOS
- TizenOS
- WebOS
- FireOS
- FlightOS
- PebbleOS
- More...
I created ATSEND to easily send AT Commands to devices https://github.com/jonathandata1/atsend
brew install android-platform-tools
sudo apt install android-tools-adb
https://github.com/jonathandata1/android-file-transfer-linux
- I have forked this repo and modified it to work with MacOS Monterey 12.1
- The compiled binary is already available for use /android-file-transfer-linux/build/cli/aft-mtp-cli
Bugs are a reality in any type of development—and bug reports are critical to identifying and solving problems. All versions of Android support capturing bug reports with [Android Debug Bridge (adb)(http://developer.android.com/tools/help/adb.html); Android versions 4.2 and higher support a Developer Option for taking bug reports and sharing via email, Drive, etc.
Android bug reports contain
dumpsys,dumpstate, andlogcatdata in text (.txt) format, enabling you to easily search for specific content. The following sections detail bug report components, describe common problems, and give helpful tips andgrepcommands for finding logs associated with those bugs. Most sections also include examples forgrepcommand and output and/ordumpsysoutput.
Source: https://source.android.com/setup/contribute/read-bug-reports
-
- Android Versions 5.0+
adb bugreport > bugreport.zip - Android Versions 4.2 -4.4.4
adb bugreports > bugreport.zip
- Android Versions 5.0+
-
- Open developer options and manually tap "bug report"
- Android Version 11 & 12 will say "Bug report"
- Android Version 9 & 10 will say "Take bug report"
- Android Version 7 & 8 will say "Submit bug report"
- You get the point for lower versions
- Open developer options and manually tap "bug report"
-
AT+SYSDUMP=1,0,1- This will trigger the SysDump (You don't have to send this command, it's only to demonstrate the trigger)
AT+SYSDUMP=0,0,0,0,0,0- This will dump the modem logs
- You will be asked to press ok when done (this can be done programmatically if the digitizer is damaged)
- This will dump the modem logs
AT+SYSDUMP=1,0,0,0,0,0- This will AP/CP Logs
- When complete you will see the location of the log file
- This will AP/CP Logs
- Programmatically
aft-mtp-cli 'get log'- This will pull the logs from the device through mtp
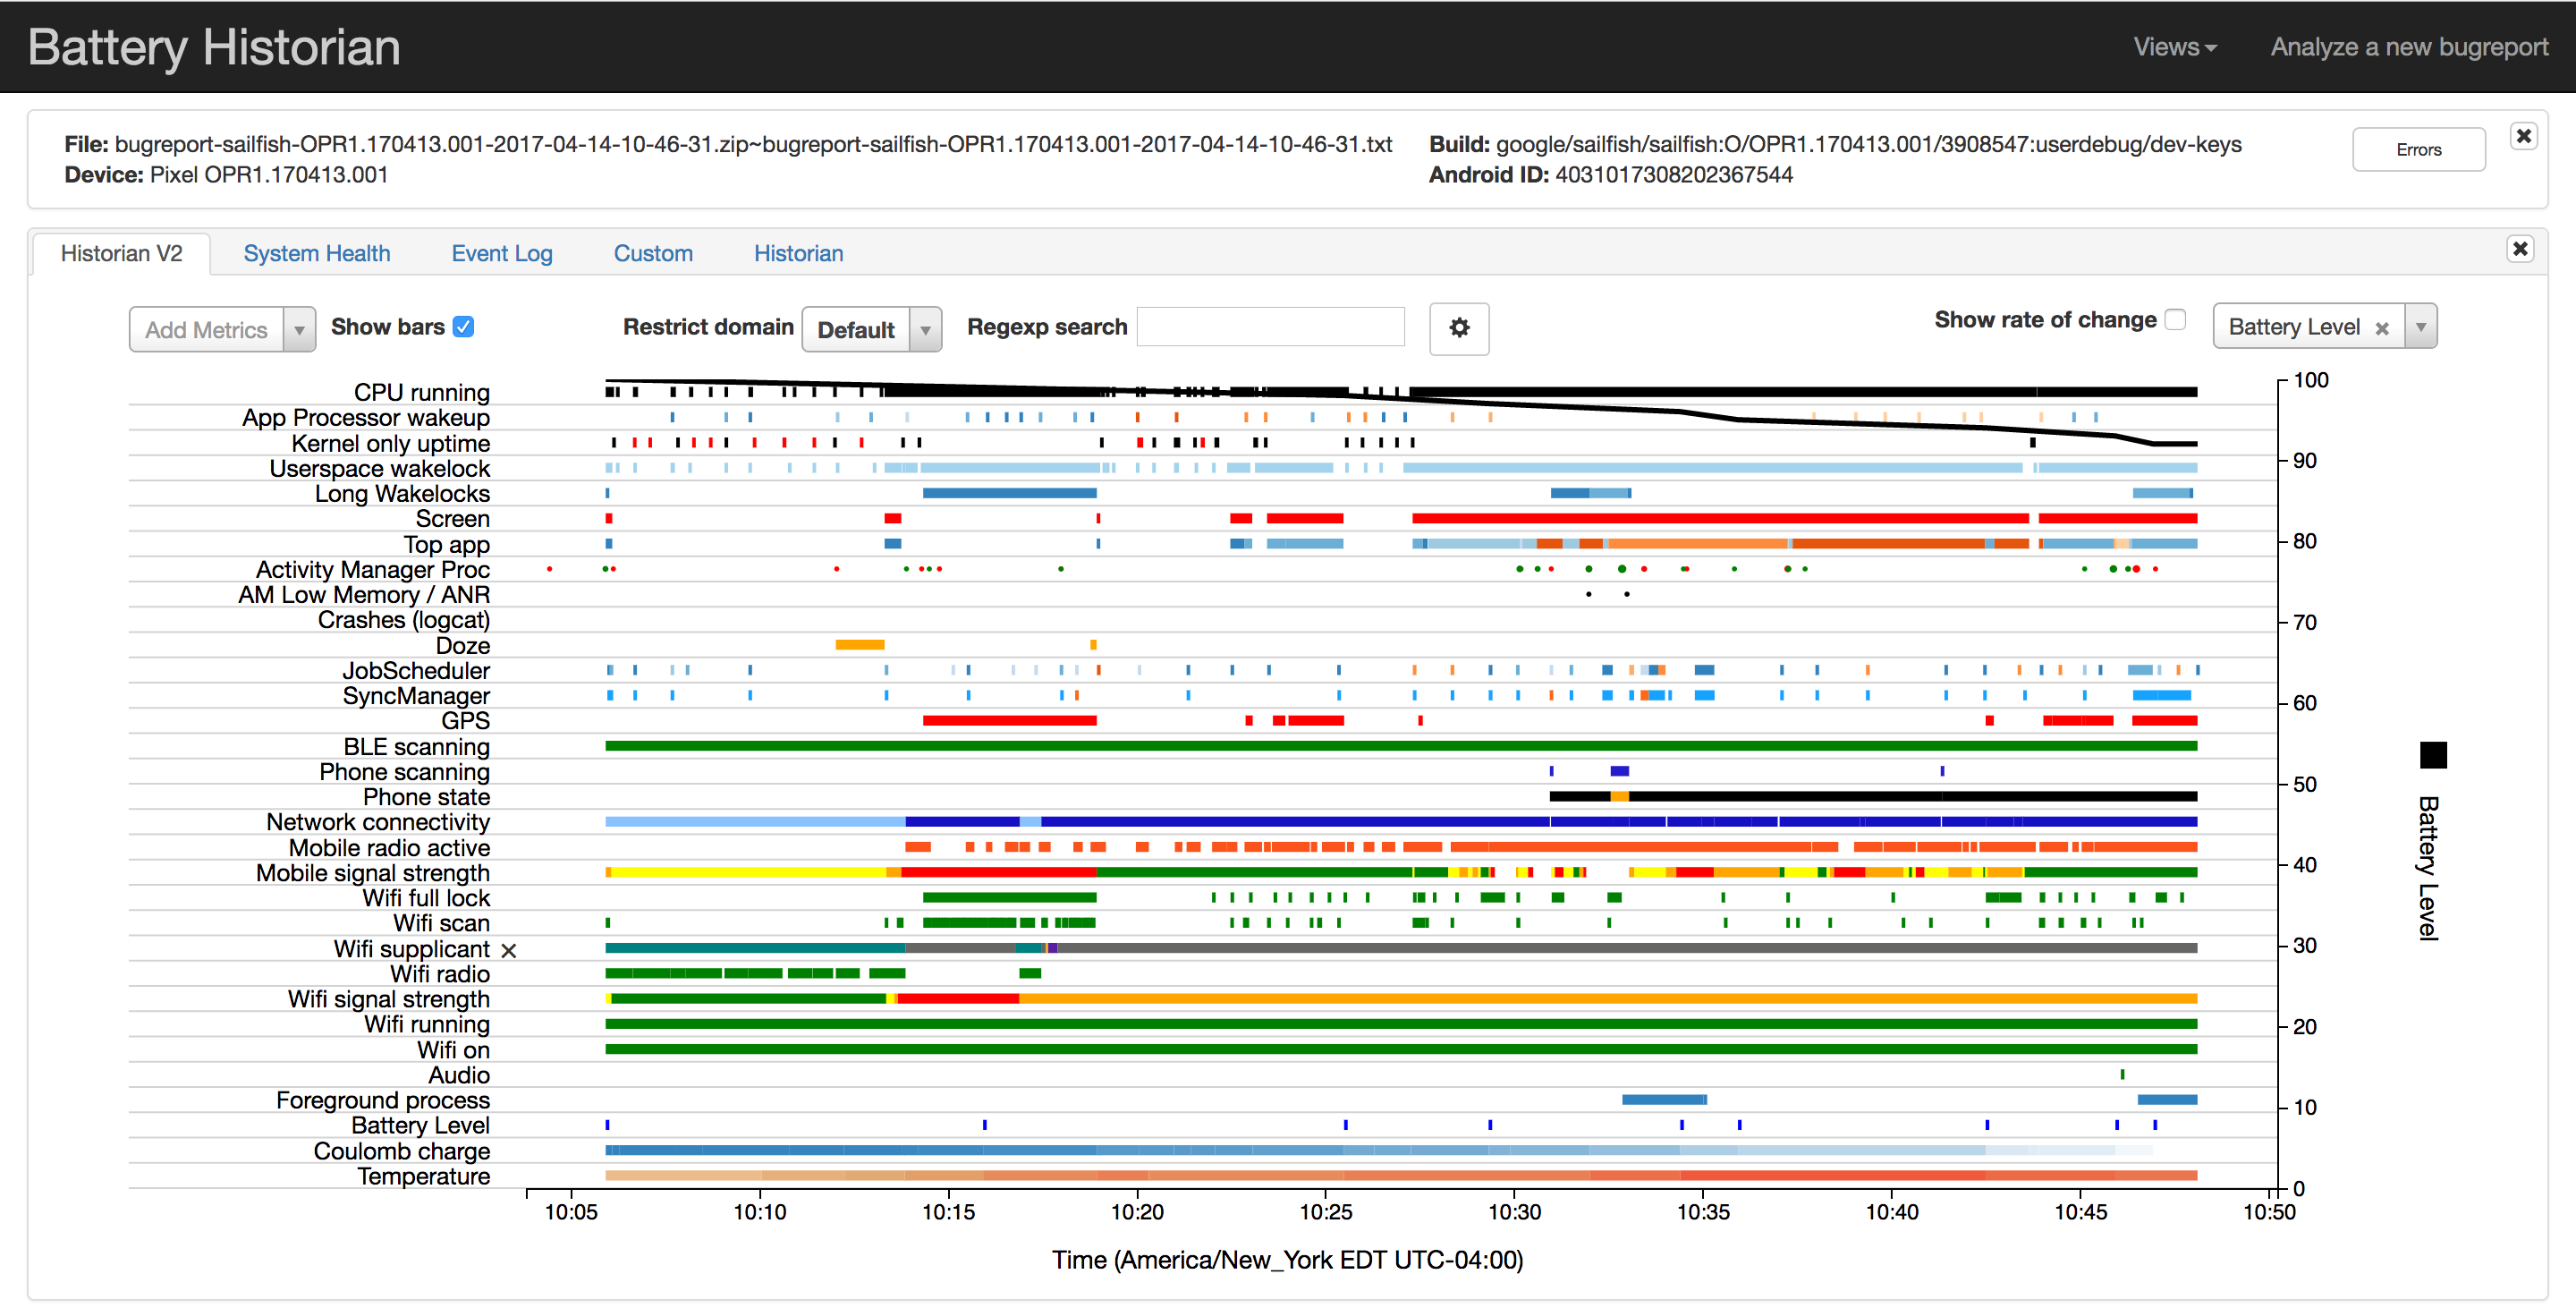
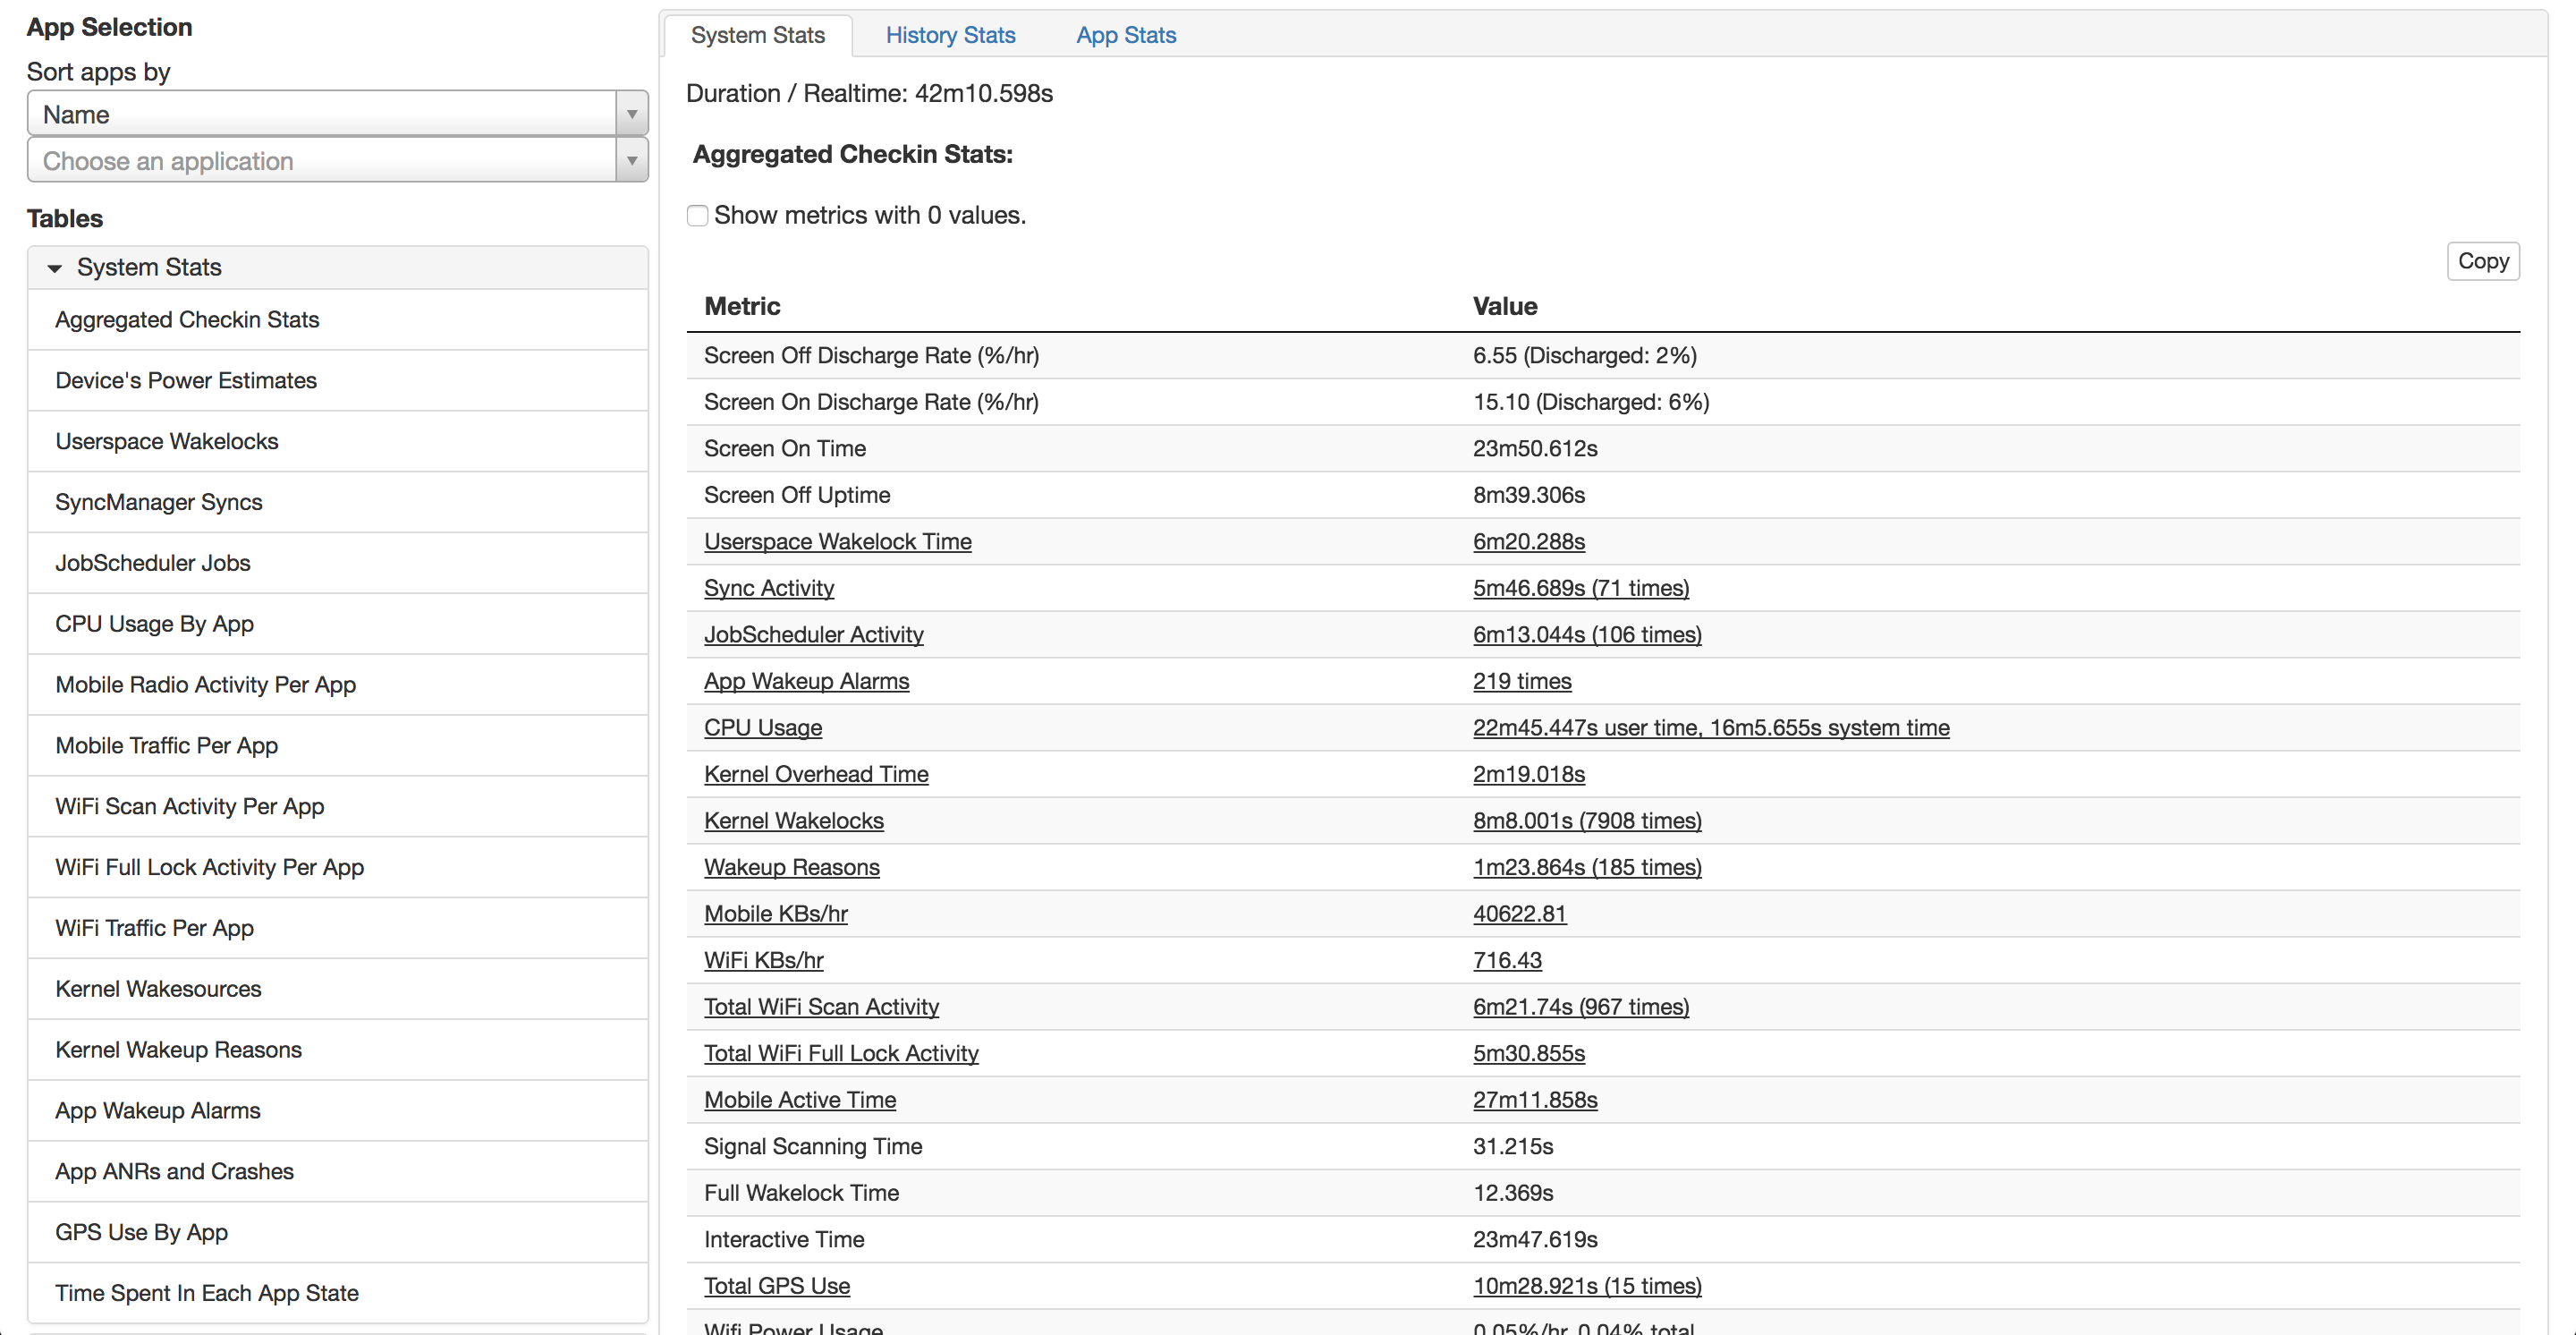
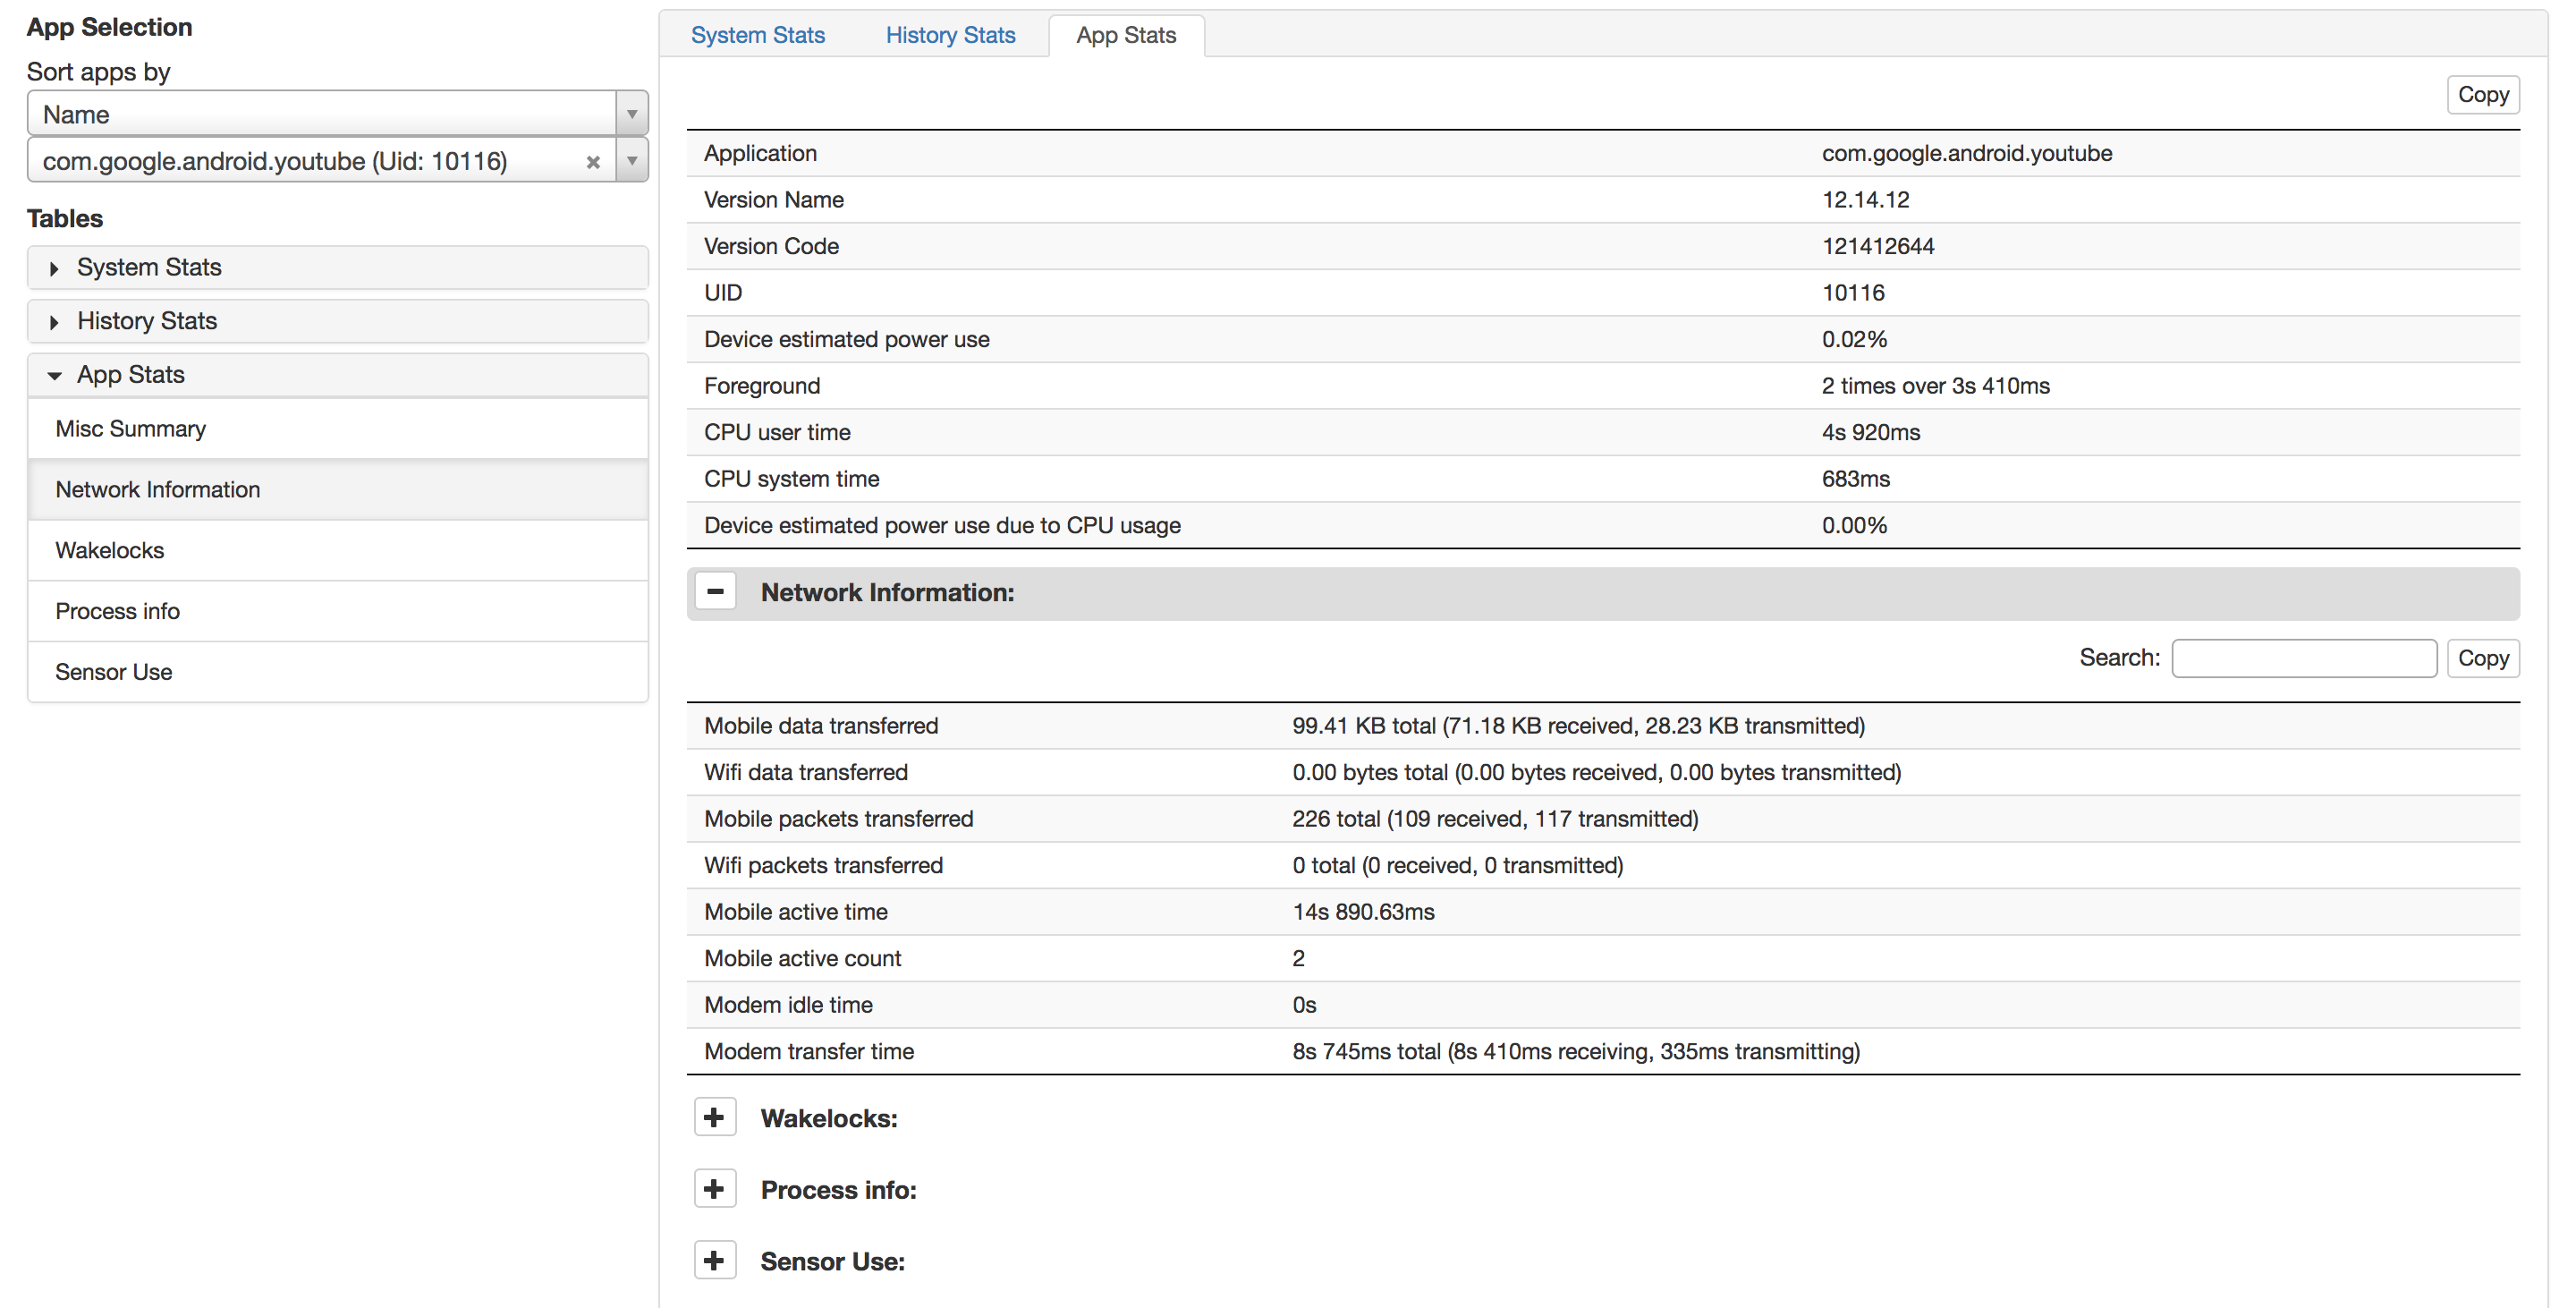
This is what Google Calls their analysis program https://github.com/google/battery-historian
docker -- run -p 8111:9999 gcr.io/android-battery-historian/stable:3.0 --port 9999
- I used port 8111 but you can change it to anything you want
- open a browser and go to
127.0.0.1:8111- You will be asked to load your bug report, you can load .zip, txt, log
- You can also compare 2 reports
I have included 2 sample logs for you to test with in this repo. Phone2 sample is a report from a device that contains Pegasus Spyware.
To reset aggregated battery stats and history:
adb shell dumpsys batterystats --reset
By default, Android does not record timestamps for application-specific userspace wakelock transitions even though aggregate statistics are maintained on a running basis. If you want Historian to display detailed information about each individual wakelock on the timeline, you should enable full wakelock reporting using the following command before starting your experiment:
adb shell dumpsys batterystats --enable full-wake-history
Note that by enabling full wakelock reporting the battery history log overflows in a few hours. Use this option for short test runs (3-4 hrs).
To generate a trace file which logs kernel wakeup source and kernel wakelock activities:
- First, connect the device to the desktop/laptop and enable kernel trace logging:
$ adb root
$ adb shell

# Set the events to trace.
$ echo "power:wakeup_source_activate" >> /d/tracing/set_event
$ echo "power:wakeup_source_deactivate" >> /d/tracing/set_event

# The default trace size for most devices is 1MB, which is relatively low and might cause the logs to overflow.
# 8MB to 10MB should be a decent size for 5-6 hours of logging.

$ echo 8192 > /d/tracing/buffer_size_kb

$ echo 1 > /d/tracing/tracing_on
-
Then, use the device for intended test case.
-
Finally, extract the logs:
$ echo 0 > /d/tracing/tracing_on
$ adb pull /d/tracing/trace <some path>

# Take a bug report at this time.
$ adb bugreport > bugreport.txt
Historian plots and relates events in real time (PST or UTC), whereas kernel trace files logs events in jiffies (seconds since boot time). In order to relate these events there is a script which approximates the jiffies to utc time. The script reads the UTC times logged in the dmesg when the system suspends and resumes. The scope of the script is limited to the amount of timestamps present in the dmesg. Since the script uses the dmesg log when the system suspends, there are different scripts for each device, with the only difference being the device-specific dmesg log it tries to find. These scripts have been integrated into the Battery Historian tool itself.
Lines in power monitor files should have one of the following formats, and the format should be consistent throughout the entire file:
<timestamp in epoch seconds, with a fractional component> <amps> <optional_volts>
OR
<timestamp in epoch milliseconds> <milliamps> <optional_millivolts>
Entries from the power monitor file will be overlaid on top of the timeline plot.
To ensure the power monitor and bug report timelines are somewhat aligned, please reset the batterystats before running any power monitor logging:
adb shell dumpsys batterystats --reset
And take a bug report soon after stopping power monitor logging.
- If using a Monsoon:
Download the AOSP Monsoon Python script from https://android.googlesource.com/platform/cts/+/master/tools/utils/monsoon.py
# Run the script.
$ monsoon.py --serialno 2294 --hz 1 --samples 100000 -timestamp | tee monsoon.out

# ...let device run a while...

$ stop monsoon.py
If you want to modify the proto files (pb/*/*.proto), first download the additional tools necessary:
Install the standard C++ implementation of protocol buffers from https://github.com/google/protobuf/blob/master/src/README.md
Download the Go proto compiler:
$ go get -u github.com/golang/protobuf/protoc-gen-go
The compiler plugin, protoc-gen-go, will be installed in $GOBIN, which must be in your $PATH for the protocol compiler, protoc, to find it.
- Make your changes to the proto files.
Finally, regenerate the compiled Go proto output files using
regen_proto.sh.
# System stats
$ go run cmd/checkin-parse/local_checkin_parse.go --input=bugreport.txt

# Timeline analysis
$ go run cmd/history-parse/local_history_parse.go --summary=totalTime --input=bugreport.txt

# Diff two bug reports
$ go run cmd/checkin-delta/local_checkin_delta.go --input=bugreport_1.txt,bugreport_2.txt


