Spyre is a Web Application Framework for providing a simple user interface for Python data projects.
Spyre runs on the minimalist python web framework, cherrypy, with jinja2 templating. At it's heart, spyre is about data and data visualization, so you'll also need pandas and matplotlib.
$ pip install dataspyre
Here's a very simple spyre example to showcase the primary components of a spyre app
from spyre import server
import matplotlib.pyplot as plt
import numpy as np
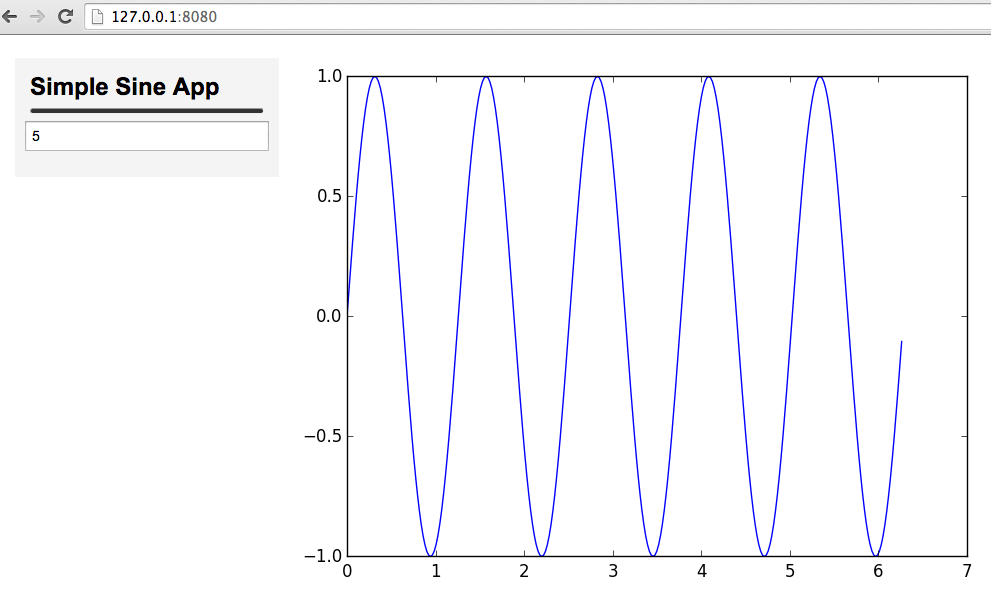
class SimpleSineApp(server.App):
title = "Simple Sine App"
inputs = [{ "input_type":"text",
"variable_name":"freq",
"value":5,
"action_id":"sine_wave_plot"}]
outputs = [{"output_type":"plot",
"output_id":"sine_wave_plot",
"on_page_load":True }]
def getPlot(self, params):
f = float(params['freq'])
print f
x = np.arange(0,2*np.pi,np.pi/150)
y = np.sin(f*x)
fig = plt.figure()
splt1 = fig.add_subplot(1,1,1)
splt1.plot(x,y)
return fig
app = SimpleSineApp()
app.launch()
The SimpleSineApp class inherits server.App which includes a few methods that you can override to generate outputs. In this case we want our app to display a Plot so we'll overide the getPlot method. This method should return a matplotlib figure.
We also need specify the attributes of our inputs and outputs which we can do by overriding the App's inputs and outputs variables.
This is a list of input dictionaries. In our simple example above, there's only one input, of type "text". We give it a label and initial value with the keys "label" and "value". The value from this input will be used as an input parameter when generating the outputs (a plot in this case), so we need to also give it a variable_name. Finally, "action_id" is an optional variable that equals either an output_id from the list of outputs, or a control_id from the list of controls (we'll get to controls in the next example). When action_id is defined, a change in the input will result in an update to the referenced output, or a call to the functions connected to the referenced control.
output_types can be "plot", "image", "table", or "html". In addition to the output_type, we also need to provide a unique output_id. If this output is suppose to get updated on execution of one of the controls specified in the list of controls, we need to also specify the control_id of that controller. If we want this output to load on the page load, we can also set "on_page_load" to True (this is false by default).
Controls are one mechanism by which a spyre app can update its outputs. A controls's control_id can be referenced by either an input or an output. When outputs reference the control_id, executing the control updates that output. When an input references the controld_id (via the "action_id"), updating the input executes the control. The two control_types are "button" and "hidden". "button" will add a button to the left panel. No control is added to the left-panel for control_types "hidden". "hidden" controls are useful for linking a single input action to multiple outputs.
Let's get back to our getPlot method. Notice that it takes a single argument: params. params is a dictionary containing:
- all of the input values (with key equal to the variable_name specified in the input dictionary)
- the output_id for the output that needs to get created.
For this simple example you can ignore the output_id (it will be useful when defining multiple outputs of the same type). With the exception of the input type "checkboxgroup", the value of each of the params is a string. In this example our one input variable represents a frequency, which is a number, so we'll need to cast it as a float before we use it. The matplotlib figure returned by getPlot will be displayed in the right panel of our Spyre app.
To launch our app we just need to create an instance of our SimpleSineApp class and call the launch method. The launch method takes to optional parameters: host and port. By default, apps are served locally on port 8080. Set host='0.0.0.0' to serve your app to external traffic.
Assuming you name this file "simple_sine_example.py" you can launch this app from the command line with:
$ python simple_sine_example.py
The output will indicate where the app is being served (usually something like http://127.0.0.1:8080)
If all goes smoothly your spyre app should look like this:
Let's look at another example to introduce controls, tabs, and a second output type, tables. Many apps will require multiple outputs. In these cases, it's often cleaner to put each output in a separte tab.
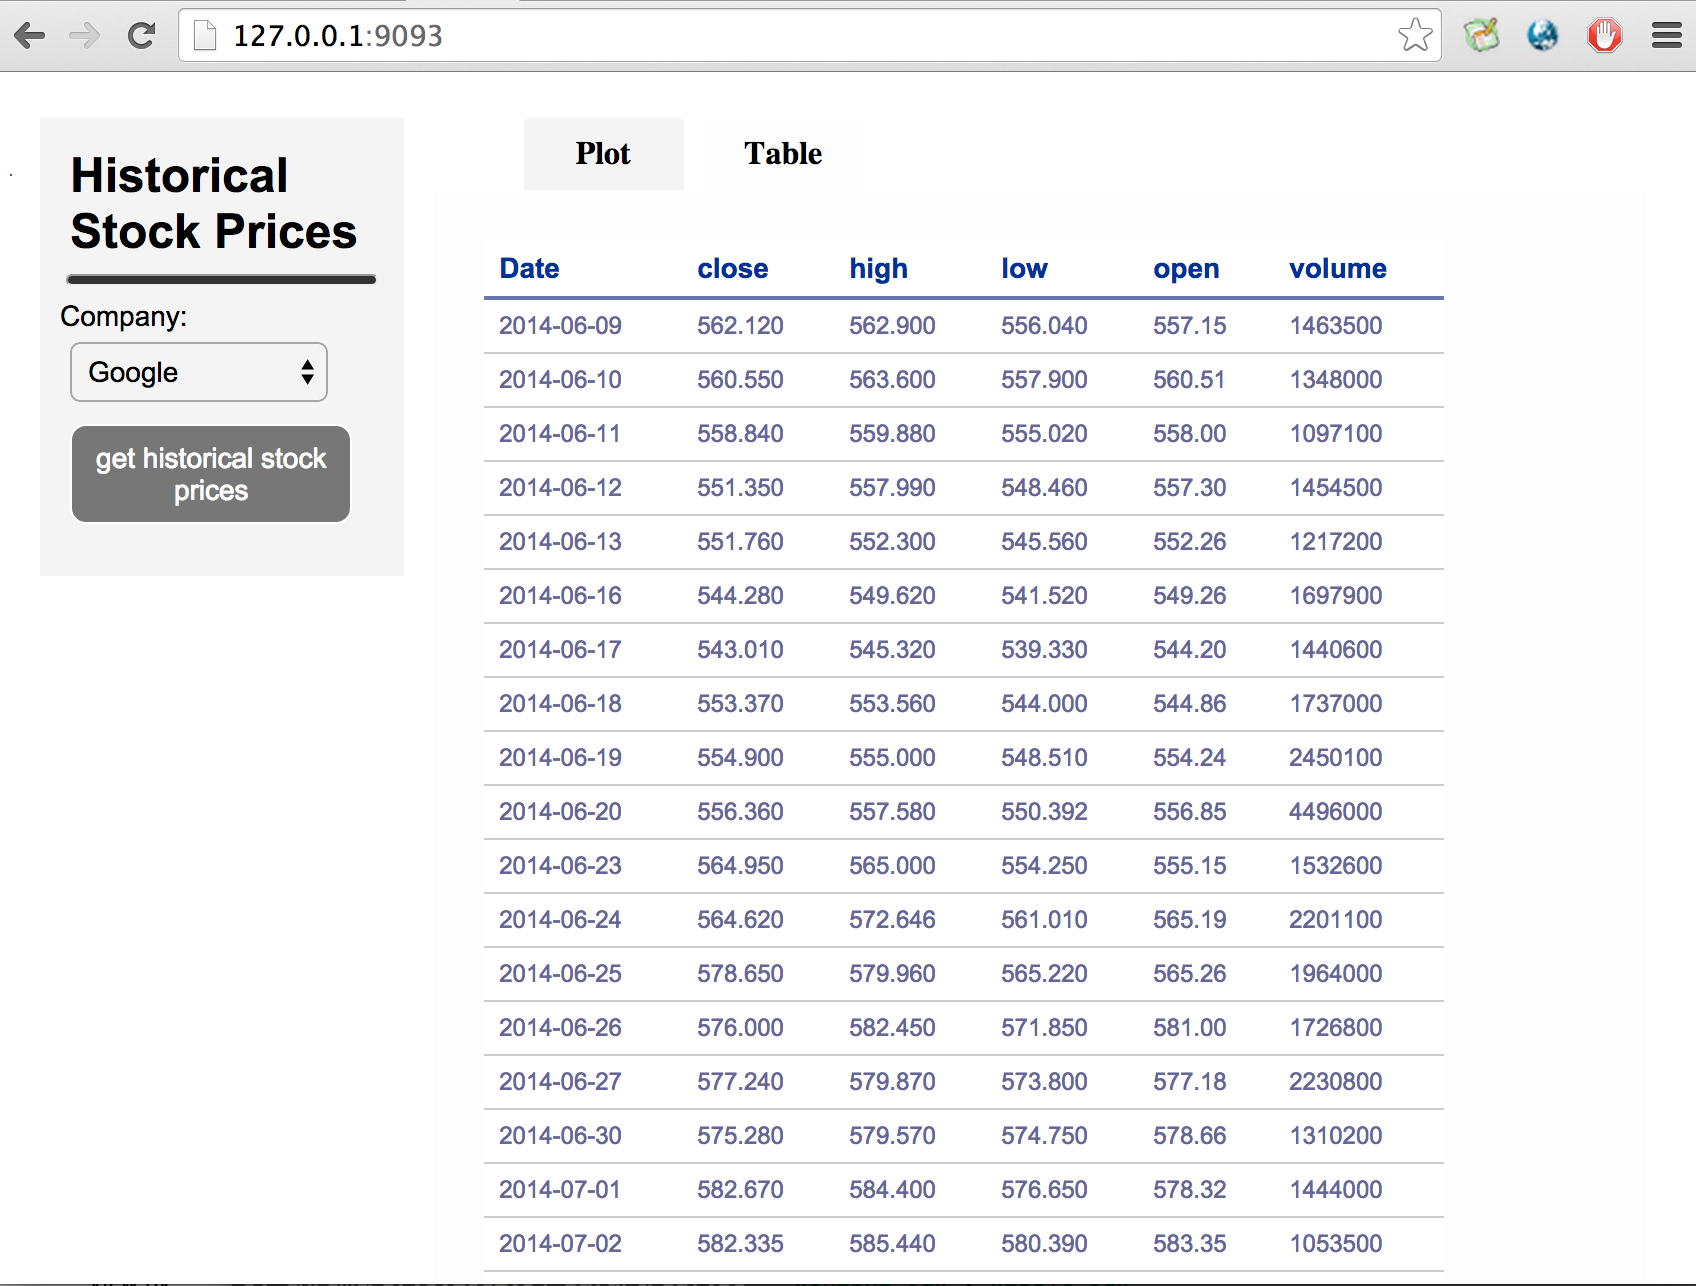
In the example below we'll show historical stock data in a line graph and a table, each in it's own tab. Since inputs can only have a single action_id (and we have two outputs), we'll need to introduce a button control in order to update both outputs.
from spyre import server

import pandas as pd
import urllib2
import json

class StockExample(server.App):
	title = "Historical Stock Prices"

	inputs = [{		"input_type":'dropdown',
					"label": 'Company',
					"options" : [ {"label": "Google", "value":"GOOG"},
								  {"label": "Yahoo", "value":"YHOO"},
								  {"label": "Apple", "value":"AAPL"}],
					"variable_name": 'ticker',
					"action_id": "update_data" }]

	controls = [{	"control_type" : "hidden",
					"label" : "get historical stock prices",
					"control_id" : "update_data"}]

	tabs = ["Plot", "Table"]

	outputs = [{	"output_type" : "plot",
					"output_id" : "plot",
					"control_id" : "update_data",
					"tab" : "Plot",
					"on_page_load" : True },
				{	"output_type" : "table",
					"output_id" : "table_id",
					"control_id" : "update_data",
					"tab" : "Table",
					"on_page_load" : True }]

	def getData(self, params):
		ticker = params['ticker']
		# make call to yahoo finance api to get historical stock data
		api_url = 'https://chartapi.finance.yahoo.com/instrument/1.0/{}/chartdata;type=quote;range=3m/json'.format(ticker)
		result = urllib2.urlopen(api_url).read()
		data = json.loads(result.replace('finance_charts_json_callback( ','')[:-1])  # strip away the javascript and load json
		self.company_name = data['meta']['Company-Name']
		df = pd.DataFrame.from_records(data['series'])
		df['Date'] = pd.to_datetime(df['Date'],format='%Y%m%d')
		return df

	def getPlot(self, params):
		df = self.getData(params)
		plt_obj = df.set_index('Date').drop(['volume'],axis=1).plot()
		plt_obj.set_ylabel("Price")
		plt_obj.set_title(self.company_name)
		fig = plt_obj.get_figure()
		return fig

app = StockExample()
app.launch(port=9093)
There's a few things to point out here. Let's start by looking at templateVars:
- This app uses a dropdown input type. It still has a label and variable_name (that's common to all input types), but you now also need to enumerate all of the options for the dropdown menu. For each of the options, "label" is displayed in the menu and "value" is value of that input variable when that option is selected.
- The tabs variable is a list of tab names. These names are used as labels for the tabs as well as html ids so they can't contain any spaces.
- Theres a "table" output type that requires all of the same parameters as the plot output type.
- Additionally, we need to specify a "tabs" parameter for each output. This should match the name of one of the items listed in the tabs list.
- The control variable has control_type, label, and control_id properties. Each output has an optional control_id used to reference a control. When a control action is taken (such as clicking a button), every output that references that control will be updated.
We're also overriding getData, a method which should fetch or generate the data that will go into the table. Just like getPlot, it takes a params argument which is a dictionary containing all of our input variables. getData should return a pandas DataFrame.
Launch the app just as you did in the previous example. The app now has two tabs.

MIT


