Coder Social home page Coder Social logo

inspectit / inspectit-ocelot Goto Github PK

View Code? Open in Web Editor NEW
199.0 199.0 68.0 92.35 MB

inspectIT Ocelot - Java agent for collecting application performance, tracing and behavior data

Home Page: http://www.inspectit.rocks/

License: Apache License 2.0

Java 84.14% Dockerfile 0.01% Shell 0.10% HTML 0.02% JavaScript 15.67% CSS 0.05%
agent apm application-monitoring end-user-monitoring hacktoberfest java-agent jvm monitoring observability openapm opencensus opentelemetry

inspectit-ocelot's Introduction

๐Ÿ”ฅ inspectIT OpenCensus Edition has been released ๐Ÿ”ฅ
The inspectIT OCE project provides an improved Java agent newly developed from scratch focusing on scalability, compatibility, flexibility and interaction with other awesome open source tools and frameworks.

๐Ÿ”ธ Check it out: inspectIT OpenCensus Edition

Build Status License

inspectIT

inspectIT

inspectIT is the leading Open Source APM (application performance management) tool for monitoring and analyzing your Java(EE) software applications.

Various sensors capture end-to-end information for every request from the end user, to the business tier all the way to the backends. inspectIT is based on an application-centric, business-focused approach, where each technical request is mapped to an application and to a business use-case. With inspectIT you always know about the health of your software and can easily analyze any problems that arise.

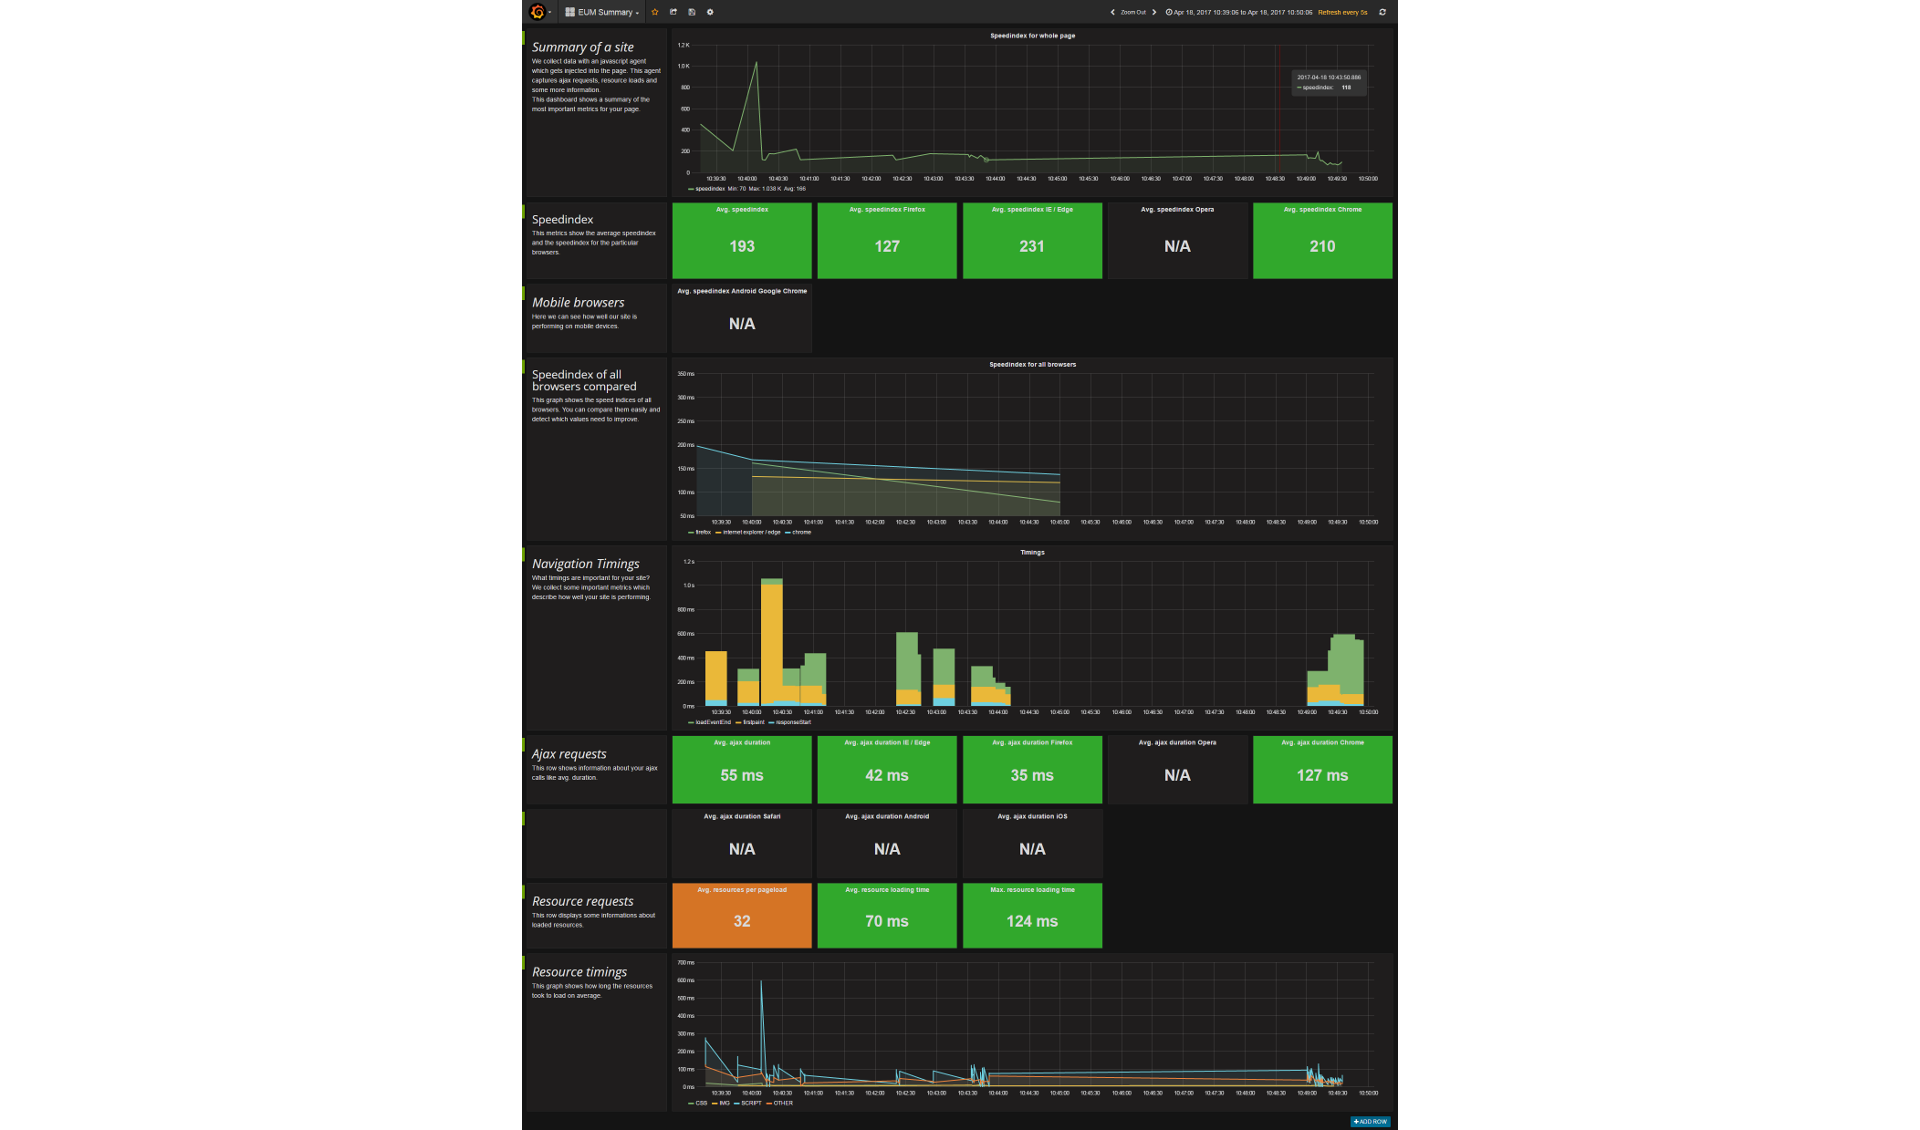
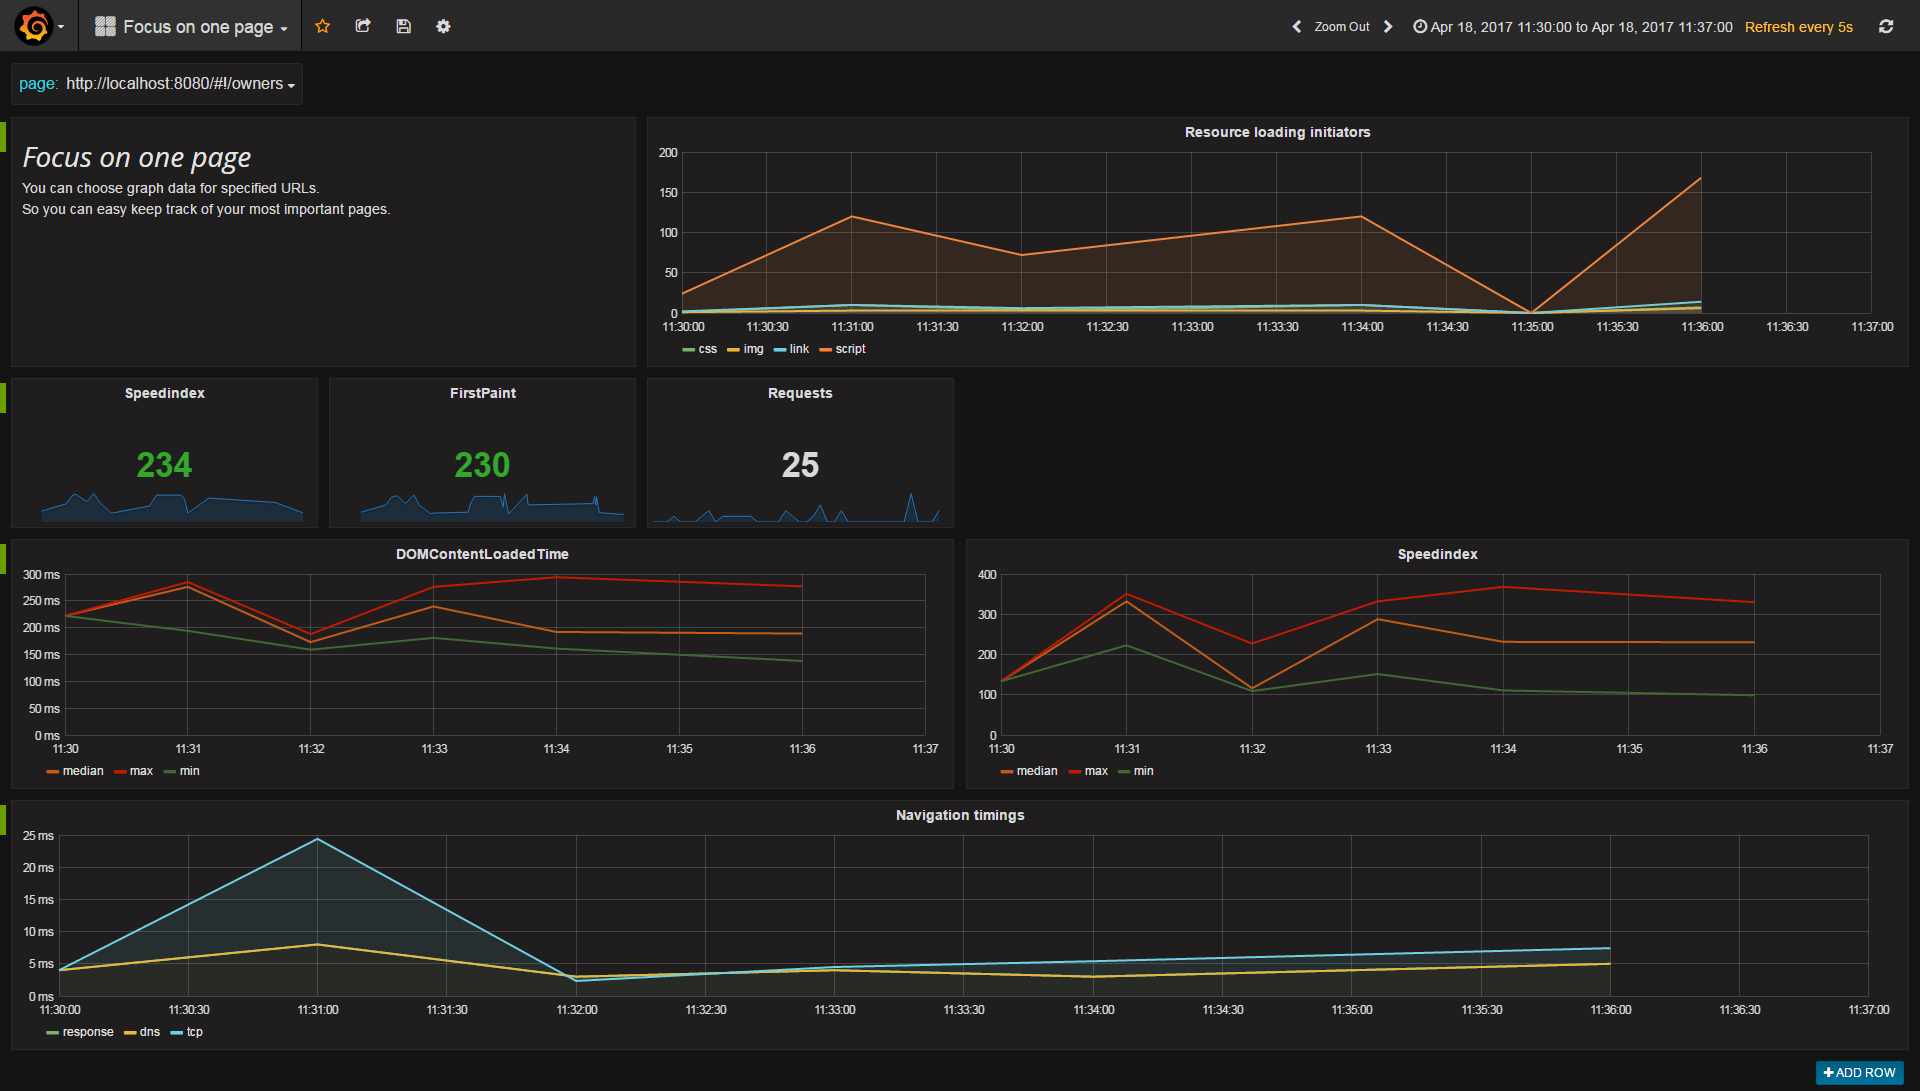
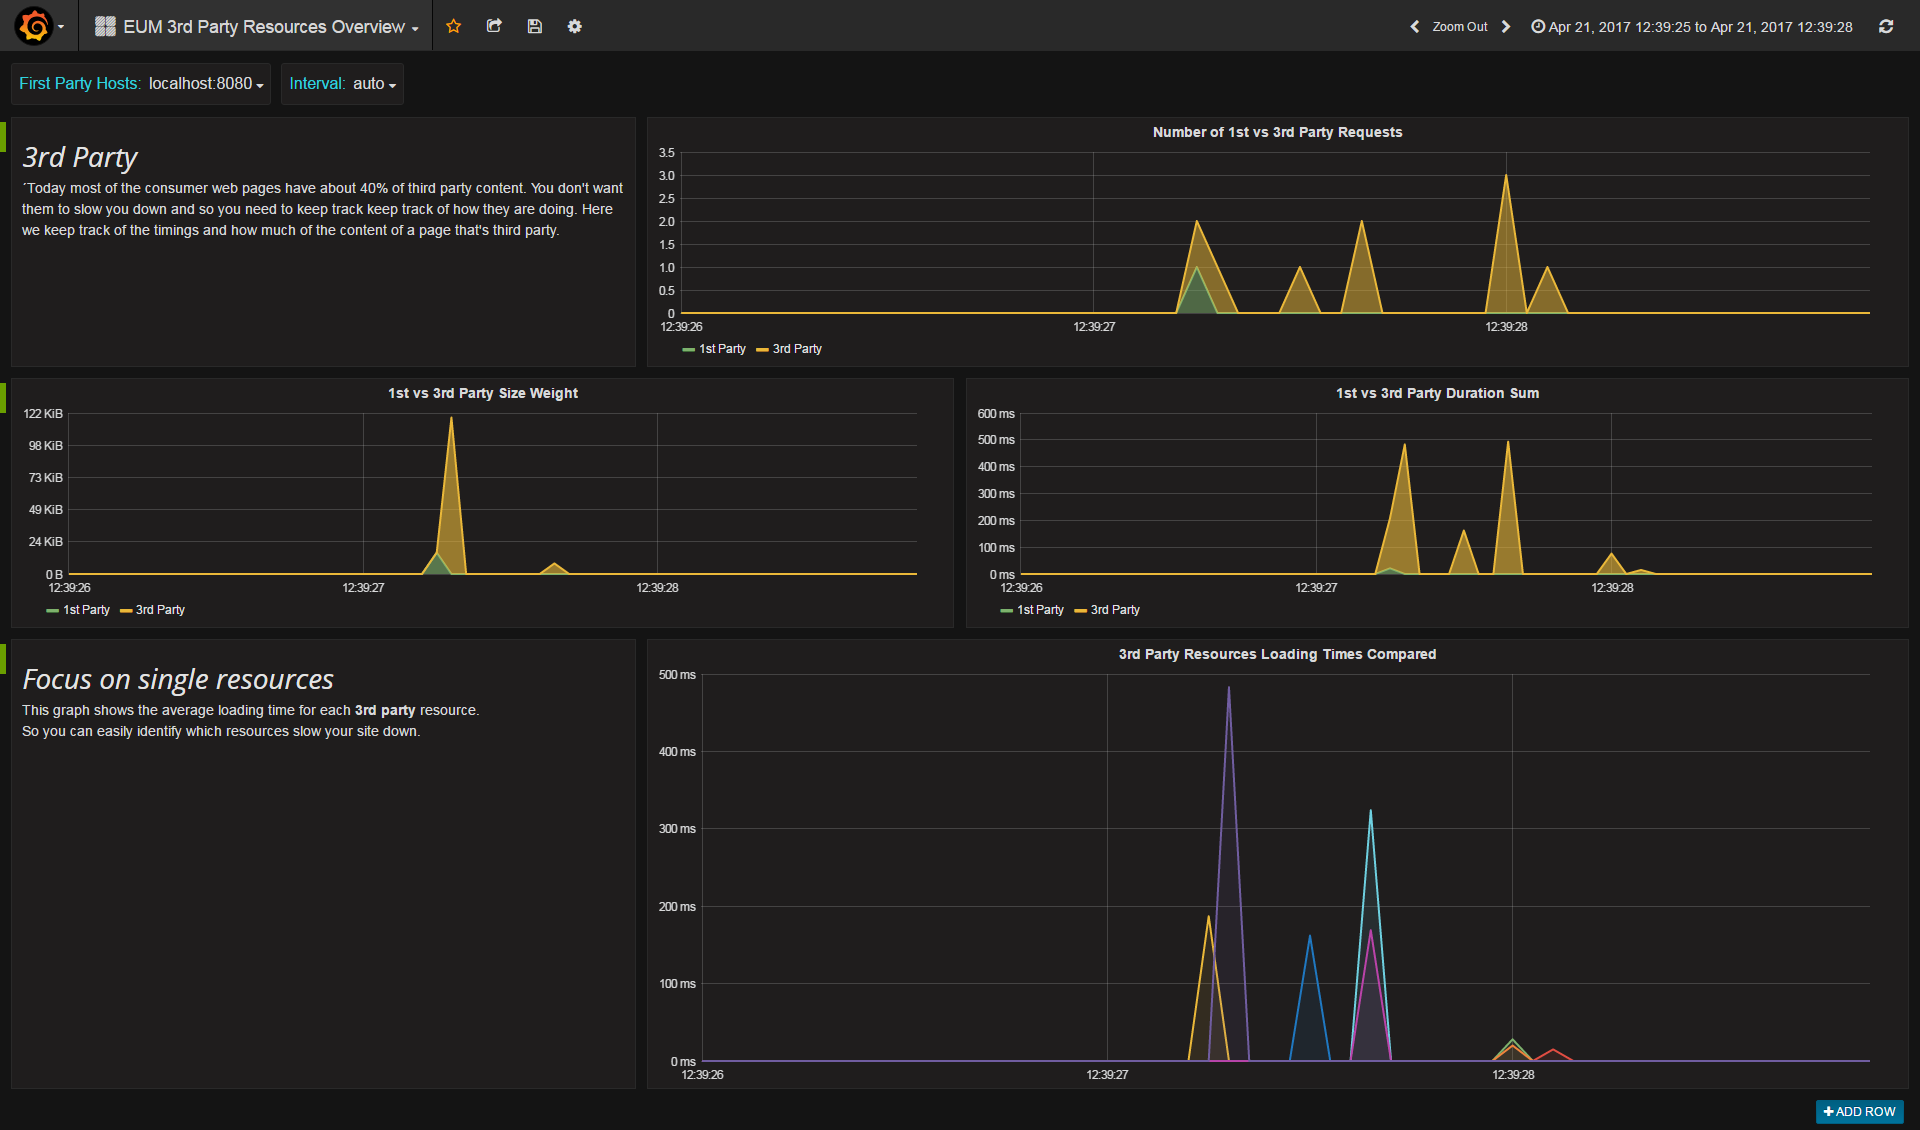
For Web applications the tool integrates the End user monitoring using automatic JavaScript agent injection. This allows easy monitoring of the performance that real users are facing in the browser. In addition, the inspectIT can correlate all user actions in the browser to the backend traces, thus providing a complete picture on the user experience.

We hope that together we can build an alternative to the (great!) commercial tools available so that it is up the end user to choose his tooling. Let's make inspectIT even more awesome!

๐Ÿ“ฃ Road-Map Announcement
The inspectIT team would like to inform the public and our open source community about the future plans for our beloved APM tool and the planned roadmap. You can read more in our public announcment.

Features

See all requests Trace-based analysis Remote traces Details (SQL)
Details (Exceptions) Sensor configuration Business context Alerting
Monitoring dashboards EUM Summary EUM Single Page EUM 3rd Party Content
  • Browser End User Monitoring: automatic injection of a JavaScript agent into your application HTML code.
  • Trace Based
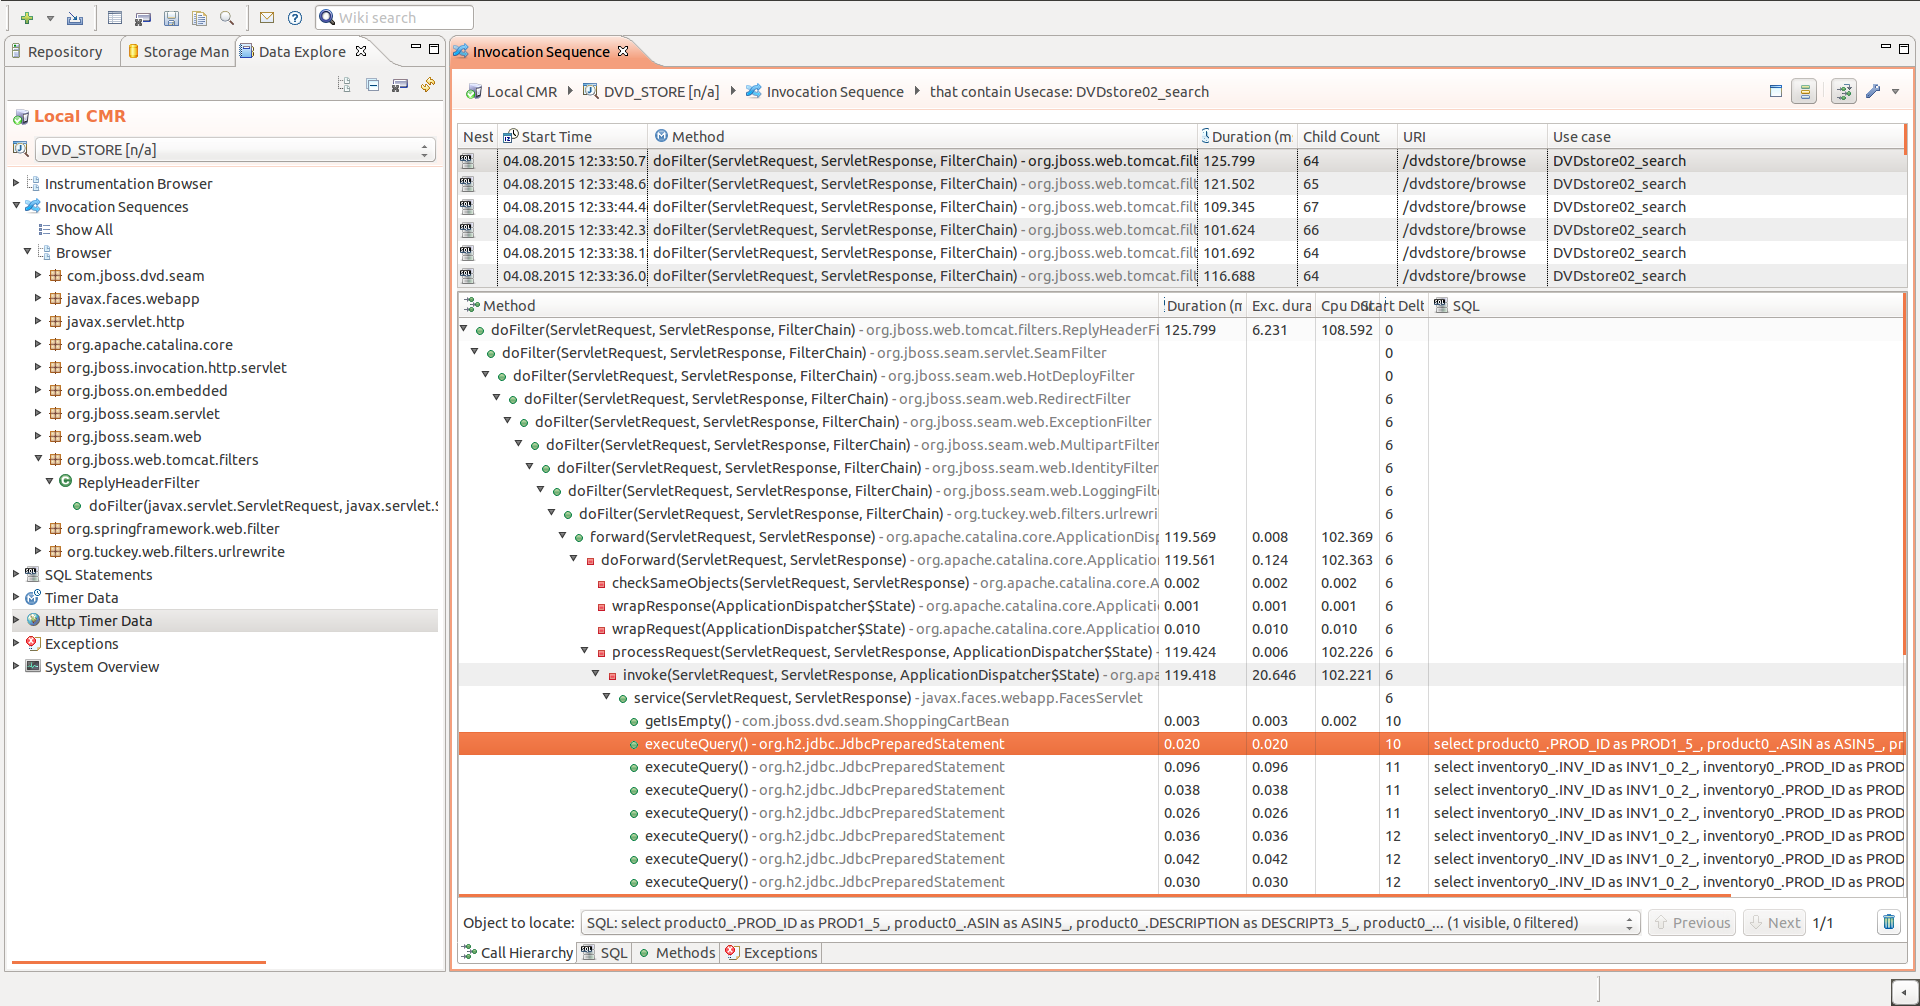
    • Detailed trace representation (invocation sequence) for every request containing all interactions with the systems.
    • Support for inter-JVM communication based on HTTP and JMS: each trace shows interaction with all correlated JVMs.
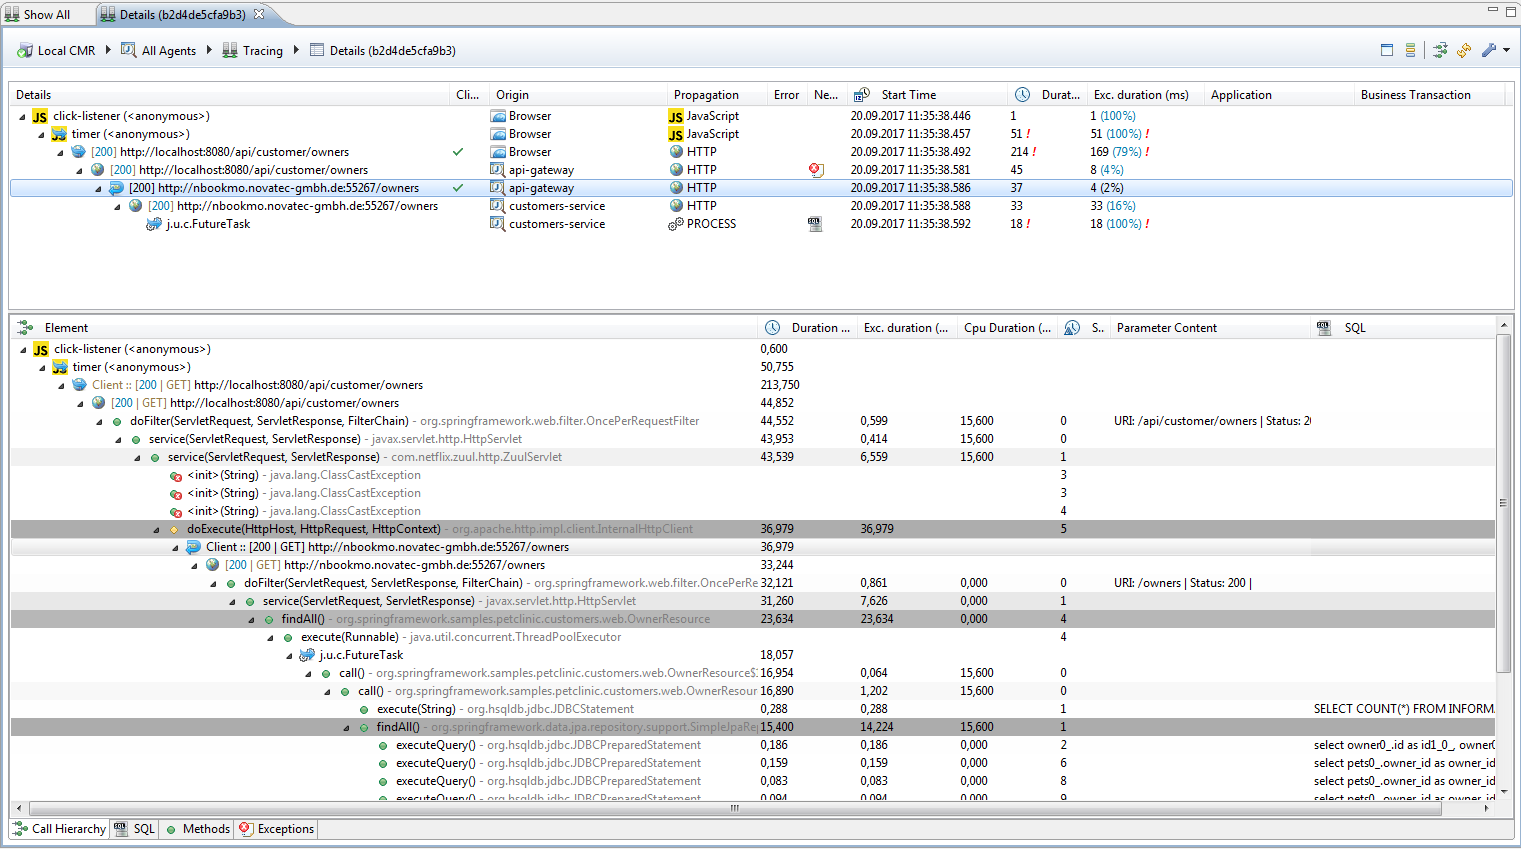
    • Support for browser-JVM communication: correlation between user actions in the browser and backend requests.
    • SDK which implements the OpenTracing.io API. All user spans are combined with inspectIT measurements in a single trace.
  • Variety of Information
    • Automatic enrichment of every trace with HTTP information, SQL queries, exceptions, parameters and many more.
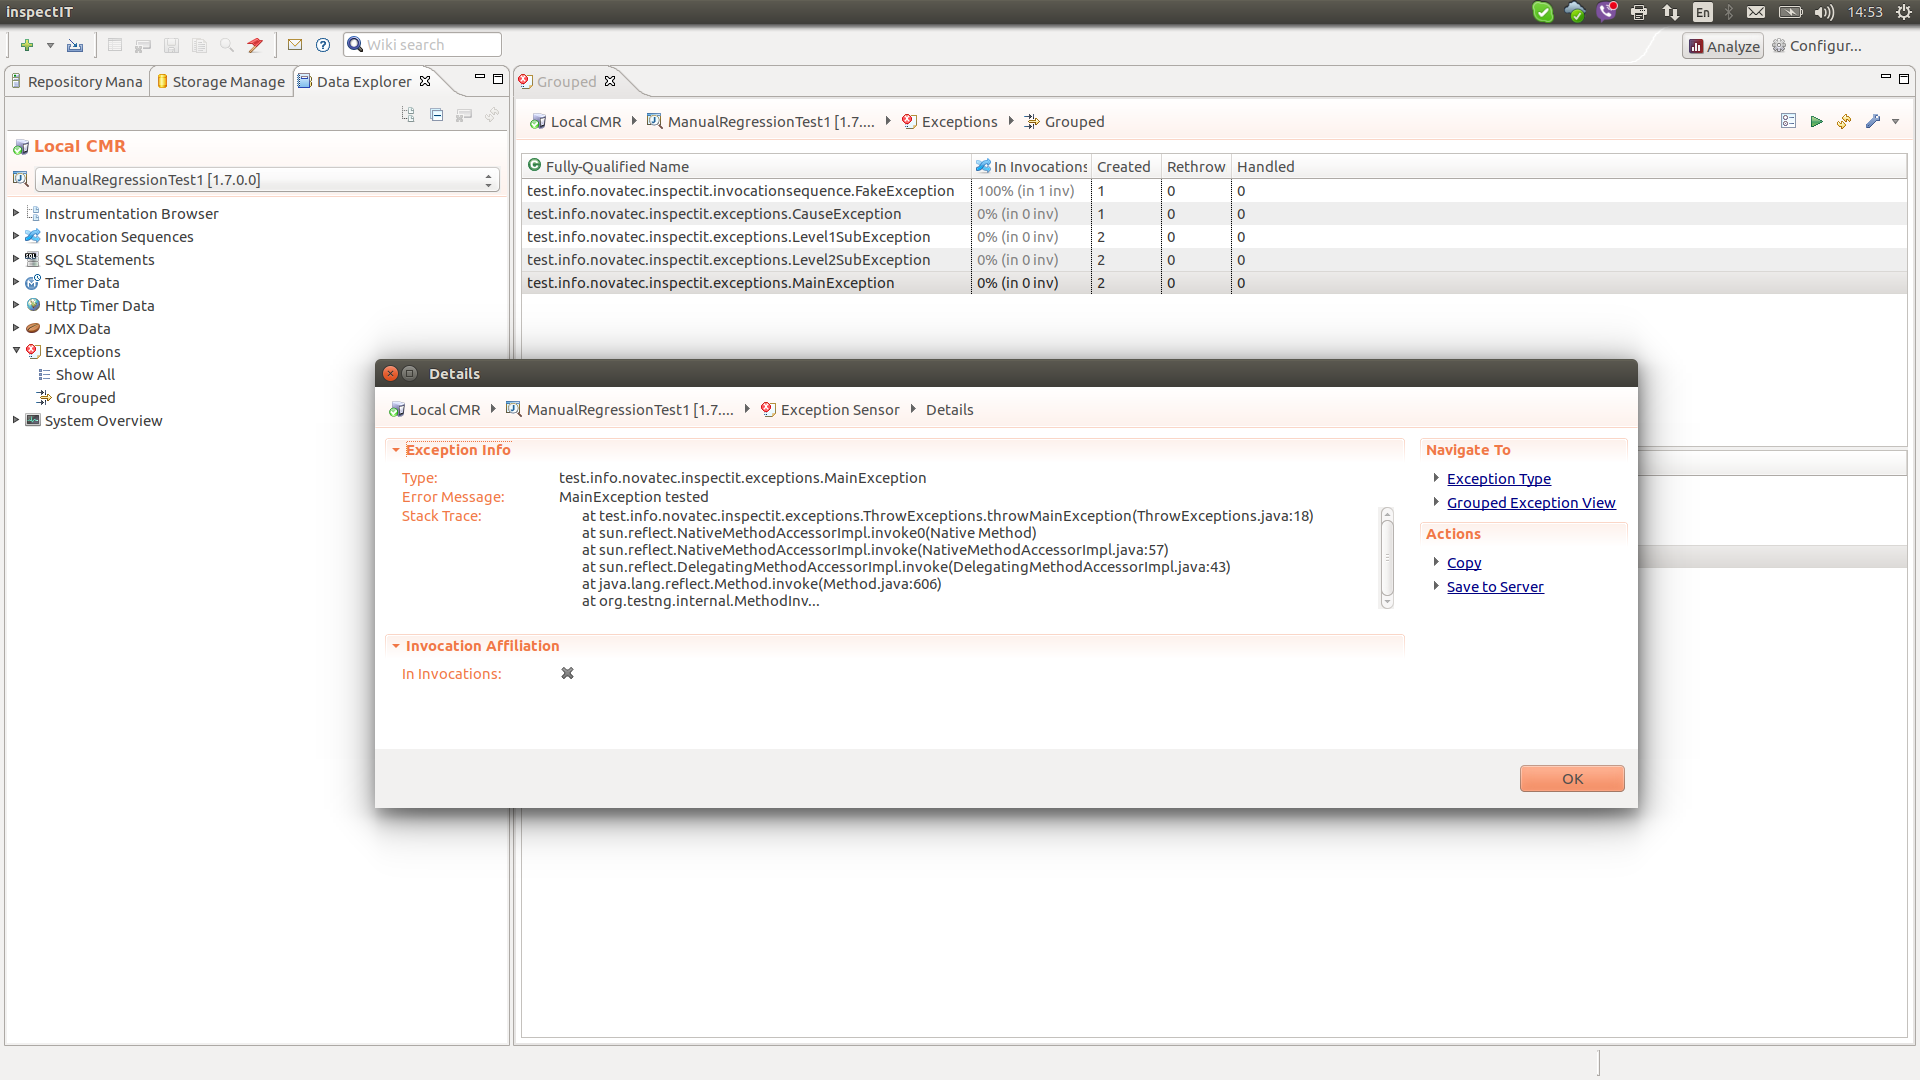
    • Detailed exception capturing allows to analyze functional problems.
    • Drill down into one invocation sequence to find and analyze problematic requests.
    • Drill up from an problem within an invocation sequence and find business-related information like the URL the request was sent to.
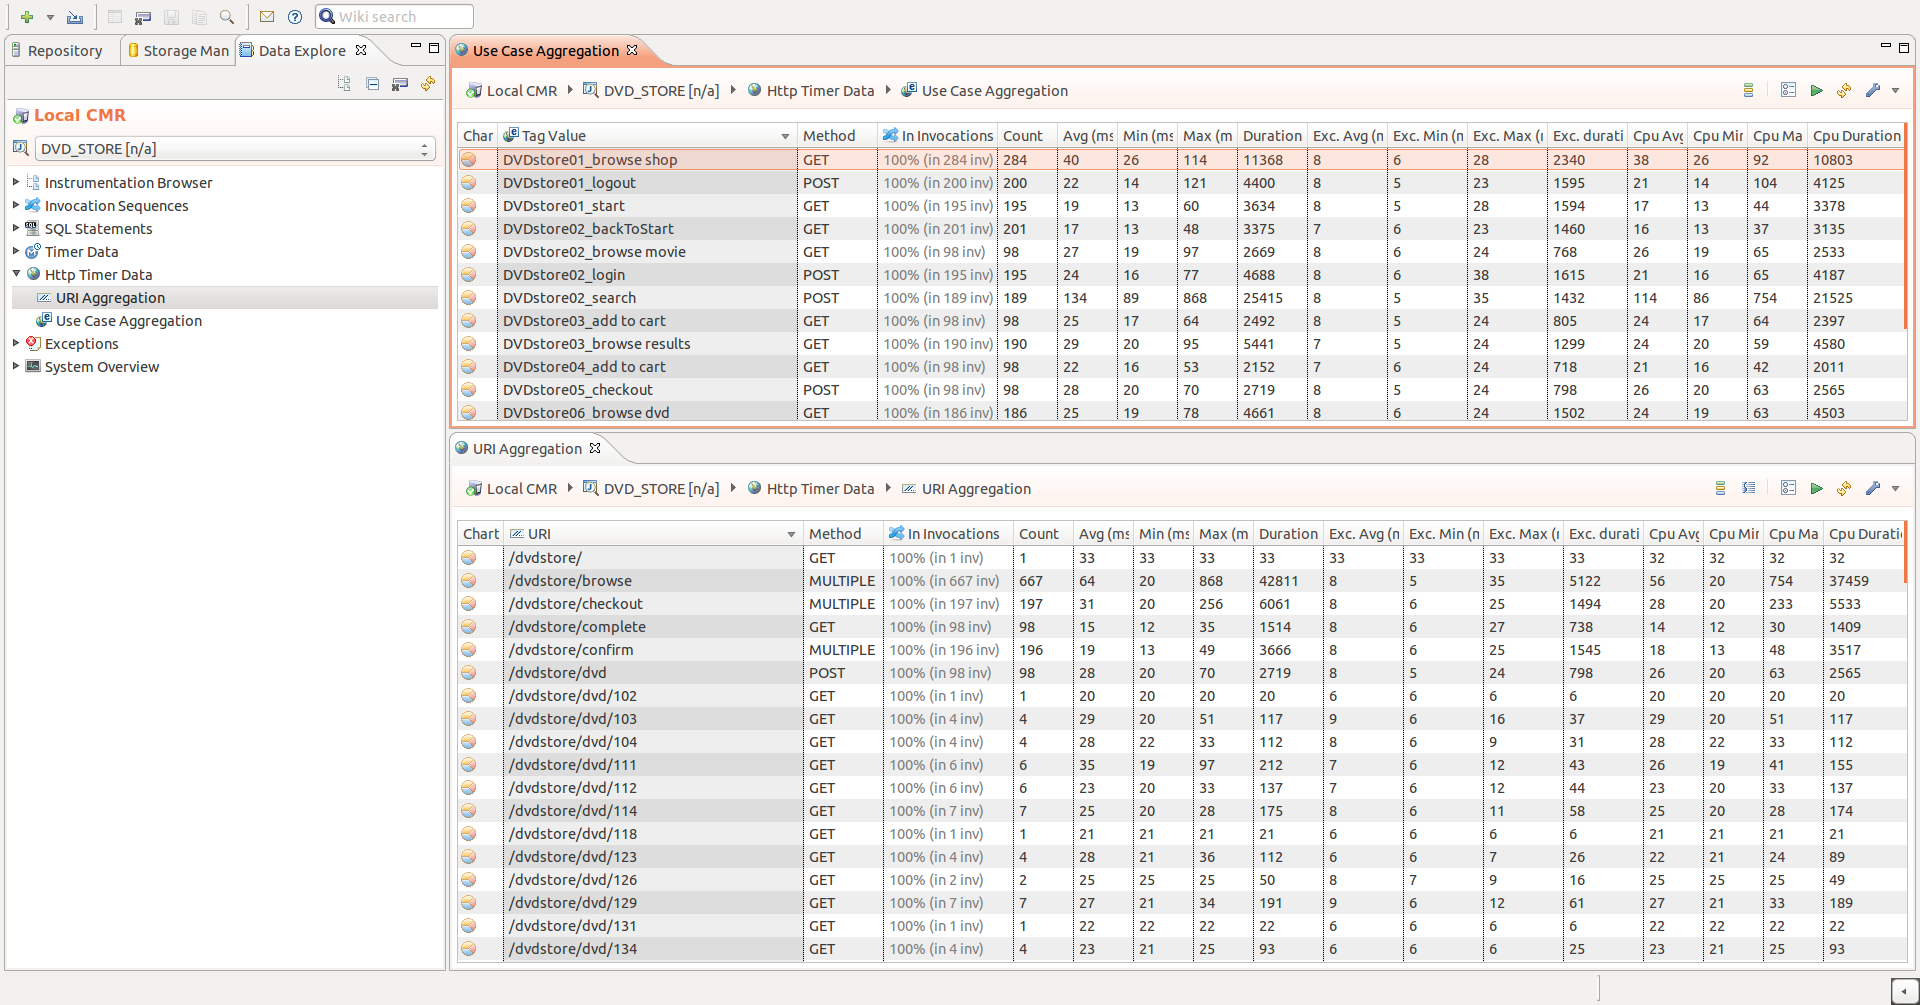
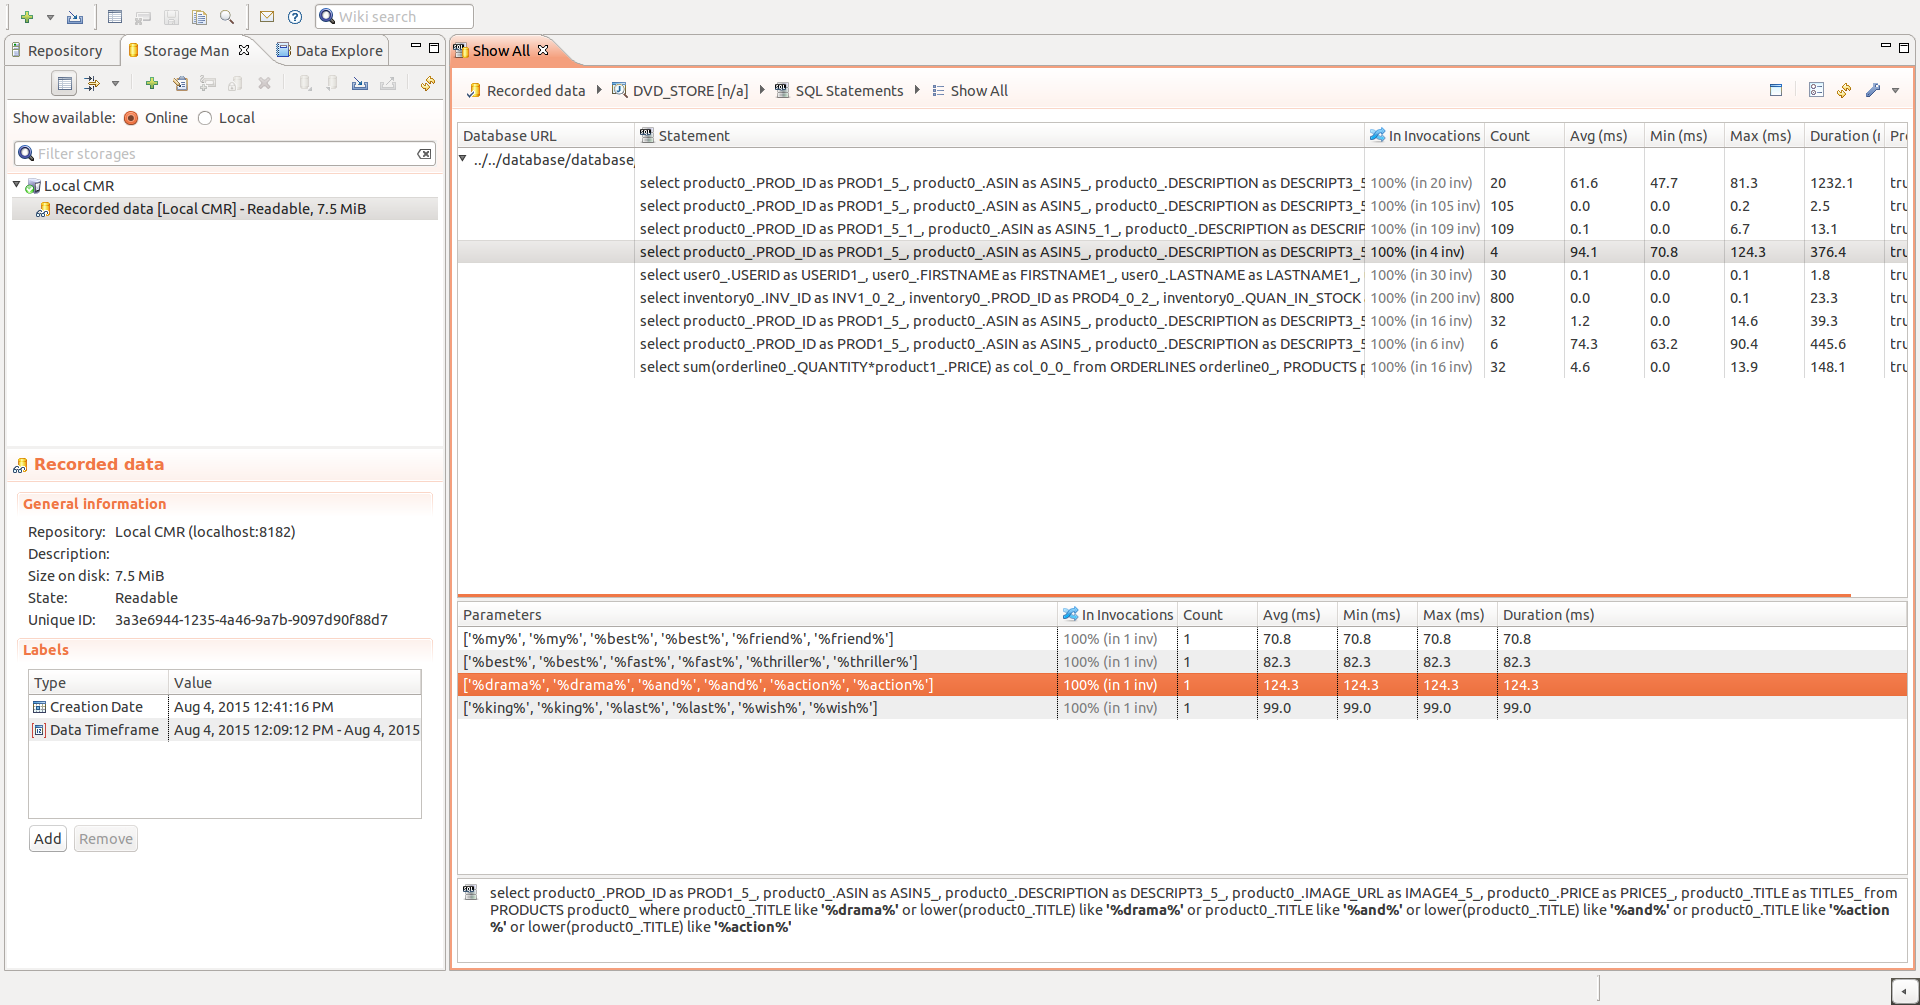
    • Aggregated views for every captured metric, e.g. aggregated SQL overview shows metrics aggregated by SQL query.
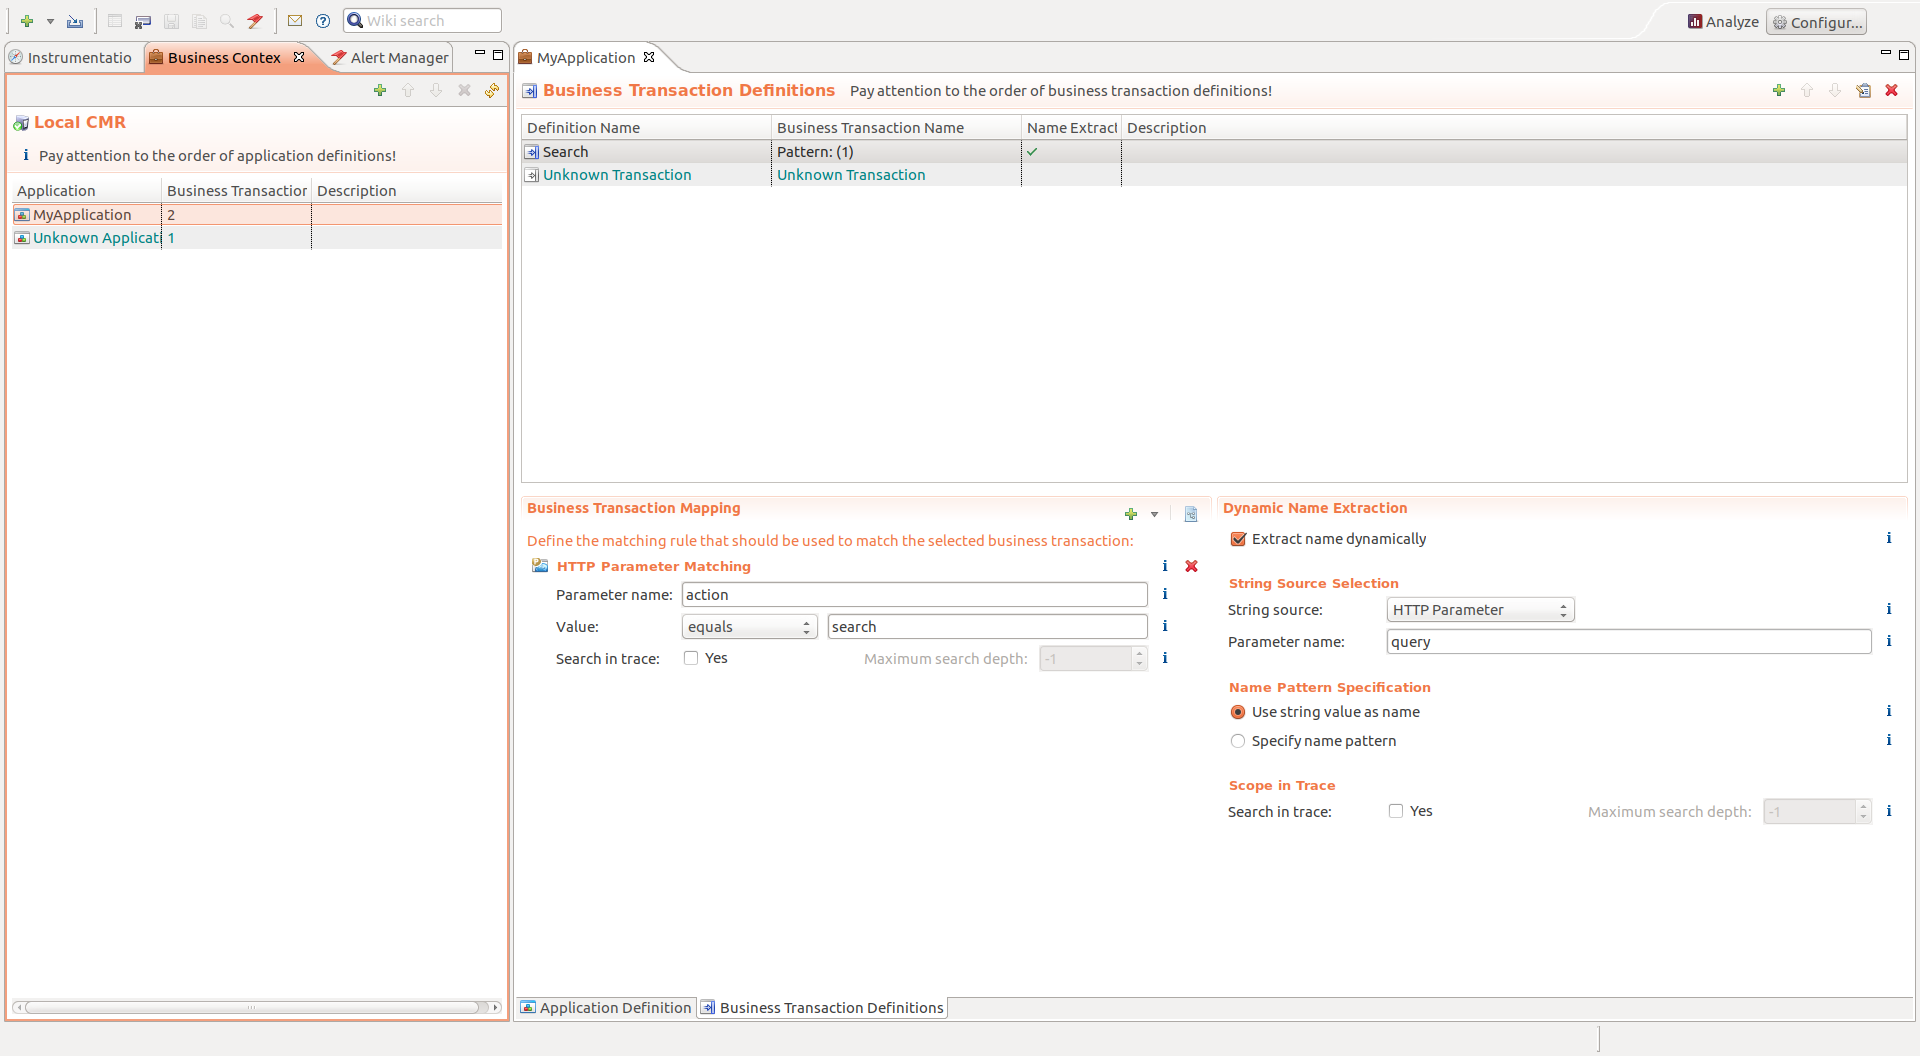
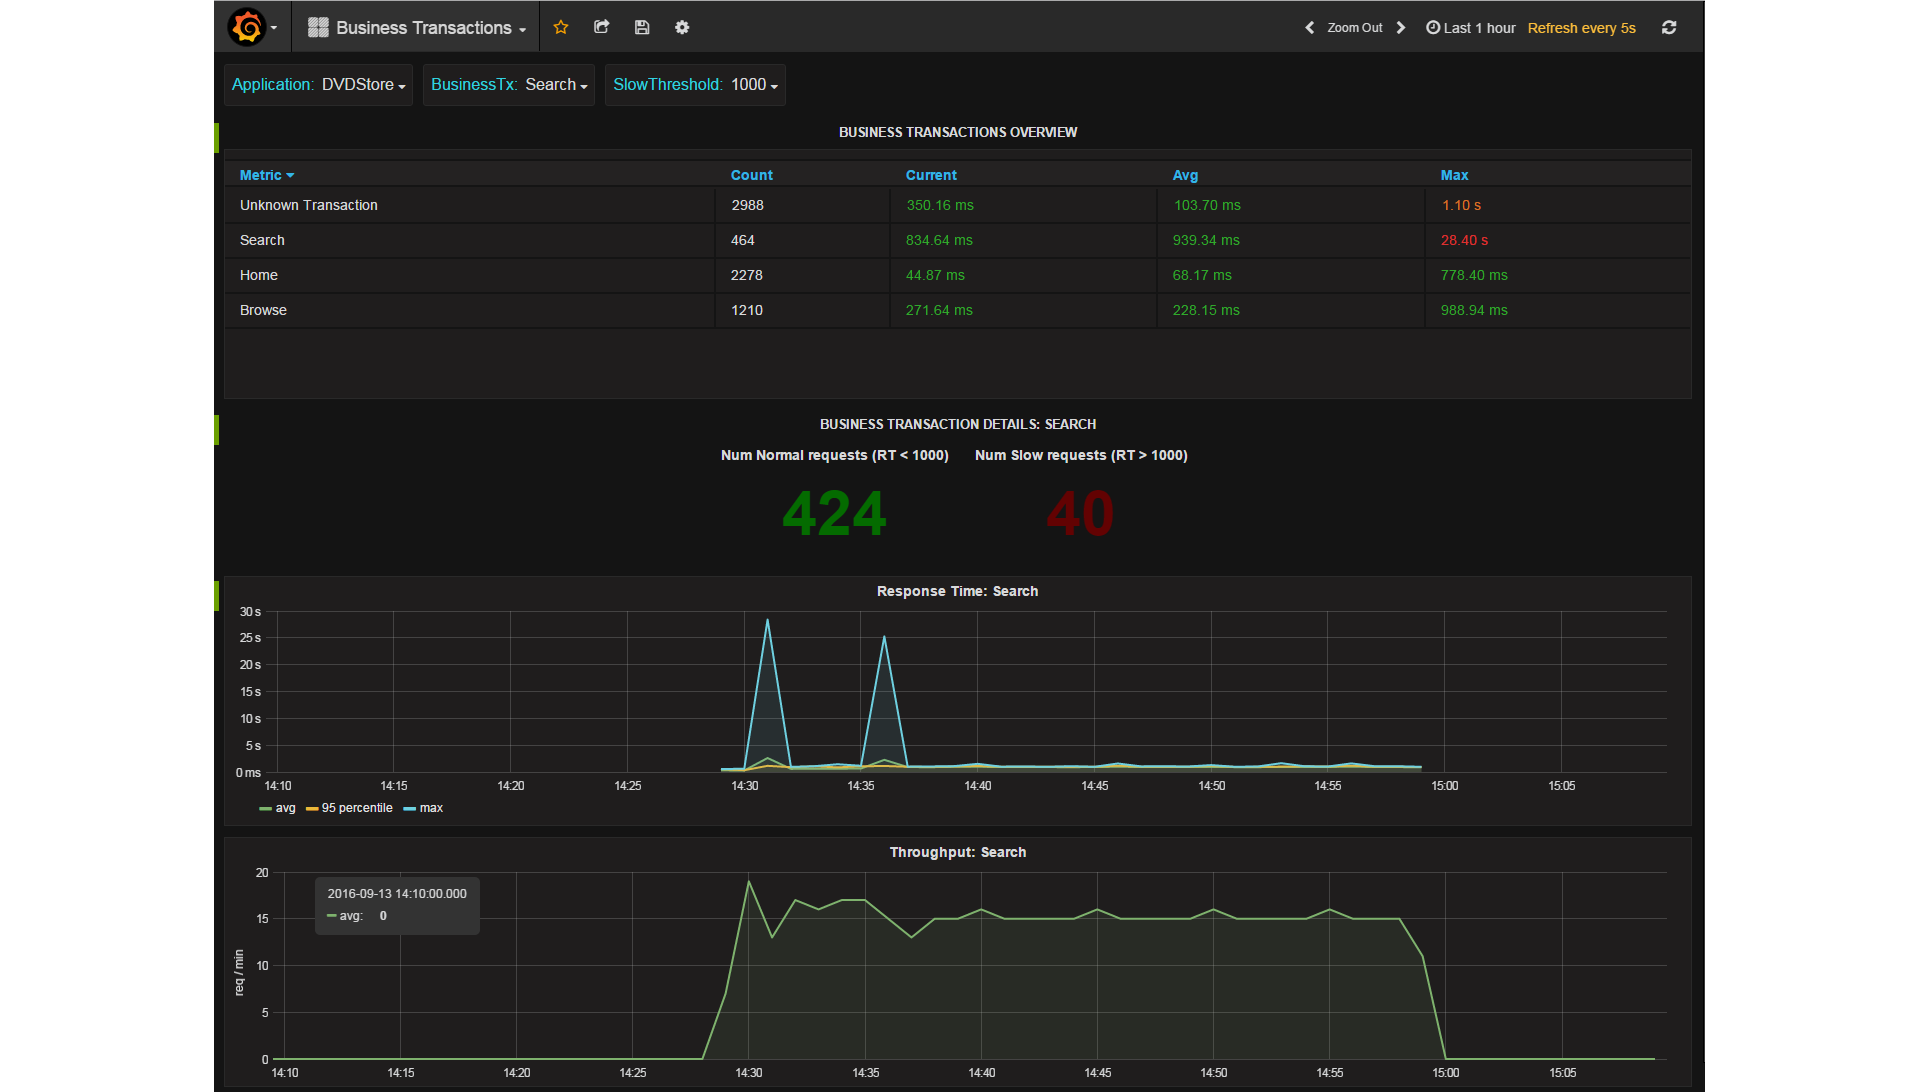
  • Business Context
    • Have a view on your application's business transactions by using flexible business context definitions.
    • Monitor and analyze requests by the functional use-case.
  • Monitoring
    • Monitor your hardware metrics like cpu, memory or threads.
    • Monitor metrics exposed via JMX beans.
    • Integration with influxDB and Grafana for easy monitoring with pre-defined dashboards.
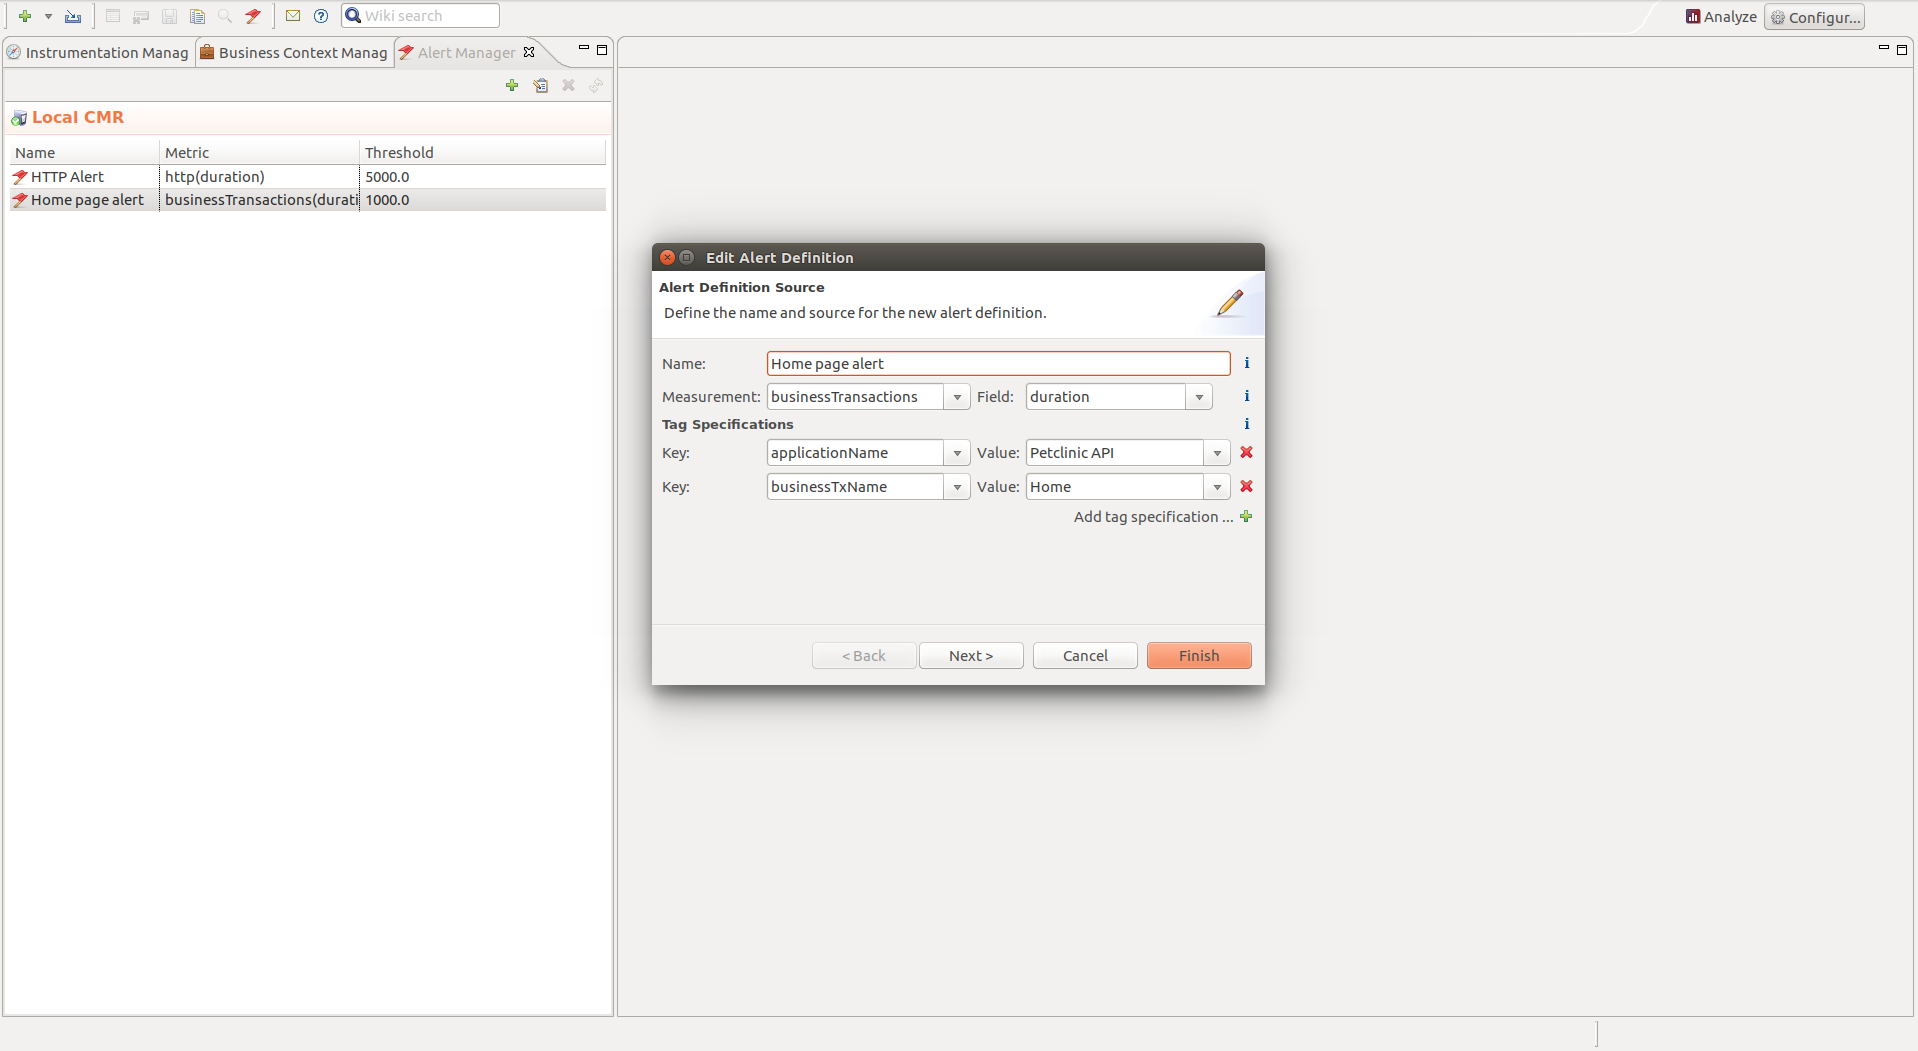
    • Simple e-mail alerting is possible on all long-term monitoring data.
  • Diagnosis Service for automatic performance problem detection.
  • RESTful API for automation and integration with other tools.
  • Usability at Its Best
    • Easy and transparent integration of the inspectIT agent in your application (compatible with Java 6, 7, 8, and 9).
    • Out-of-the-box profiles for a quick start.
    • Dynamic instrumentation - change measurement points on the monitored JVM without a need for restart.
    • Store, import and export detailed traces with all information instead of noting down which user-clicks led to a problem.
    • No more config-files! We have fully adaptable, graphical configuration interfaces for everything.
  • Optimized for Low Overhead
    • Production-proof: Used for >8 years at our customers and during performance firefights.
    • One server is enough for most environments supporting a medium number of agents.
  • Extendable system: Missing something? Write your own extensions.

End User Monitoring

โš ๏ธ We recommend to try this feature on a system configuration in a safe environment first.

The inspectIT 1.8 line comes with a new feature: Browser End User Experience Monitoring (EUM). This feature allows you to measure the performance at the browser side of the end user, giving more detailed insights than the back-end instrumentation alone. This is done by automatically injecting a JavaScript agent into your applications HTML code, which in turn captures relevant metrics at the client-side and sends them back to inspectIT using AJAX Requests. Check the official feature documentation to help you started.

Tracing

OpenTracing Badge

inspectIT provides a set of remote sensors in order to create traces and correlate calls made between JVM nodes in your application. These traces can provide an end-to-end view on the user request execution, even they are spanning over multiple JVMs. In addition, if end-user-monitoring is active inspectIT is capable of correlating browser side actions, like page loads or clicks, to resulting back-end requests (screenshot).

The remote tracing is done in inspectIT as per OpenTracing.io specification, with a similar data model based on spans. Furthermore, inspectIT combines the captured spans with the invocation sequences created on each JVM and, thus, is able to provide not only the landscape of the interacting JVMs but also provide detailed information on the invocation execution during complete traces. This includes all the data that is captured as a part of invocation sequence, SQL statements, exceptions, method calls, etc. Visit the official feature documentation to help you get started.

With a set of default inspectIT profiles you get automatic tracing for following technologies and libraries without a need to change your source code nor dependencies. Currently, we support:

  • Java
    • Executor service (Java 6+)
  • HTTP
    • Apache HttpComponents Async Client (version 4.x)
    • Apache HttpComponents Client (version 4.x)
    • Java Servlet API (version 2.x & up)
    • Java URL Connection (Java 6+)
    • Jetty Http Client (versions 7.x & 8.x)
    • Spring Rest Template (version 3.x & 4.x)
  • JMS
    • Java Message Service API (version 1.x & up)

The OpenTracing.io API implementation is provided as a part of inspectIT's inspectit.agent.java.sdk project. Users of the OpenTracing.io API can easily use inspectIT as the implementation.

Automatic Performance Problems Detection

โš ๏ธ Experimental

As s result of the diagnoseIT research project, inspectIT's version line 1.8 offers an integrated diagnosis service for automatic performance problems detection. This service can analyze requests lasting longer than a user-defined baseline and provides insights on where the performance problems can be. An overview of found problems is provided as a part of the monitoring dashboards. Visit the official feature documentation to help you started.

Out-Of-The-Box Profiles

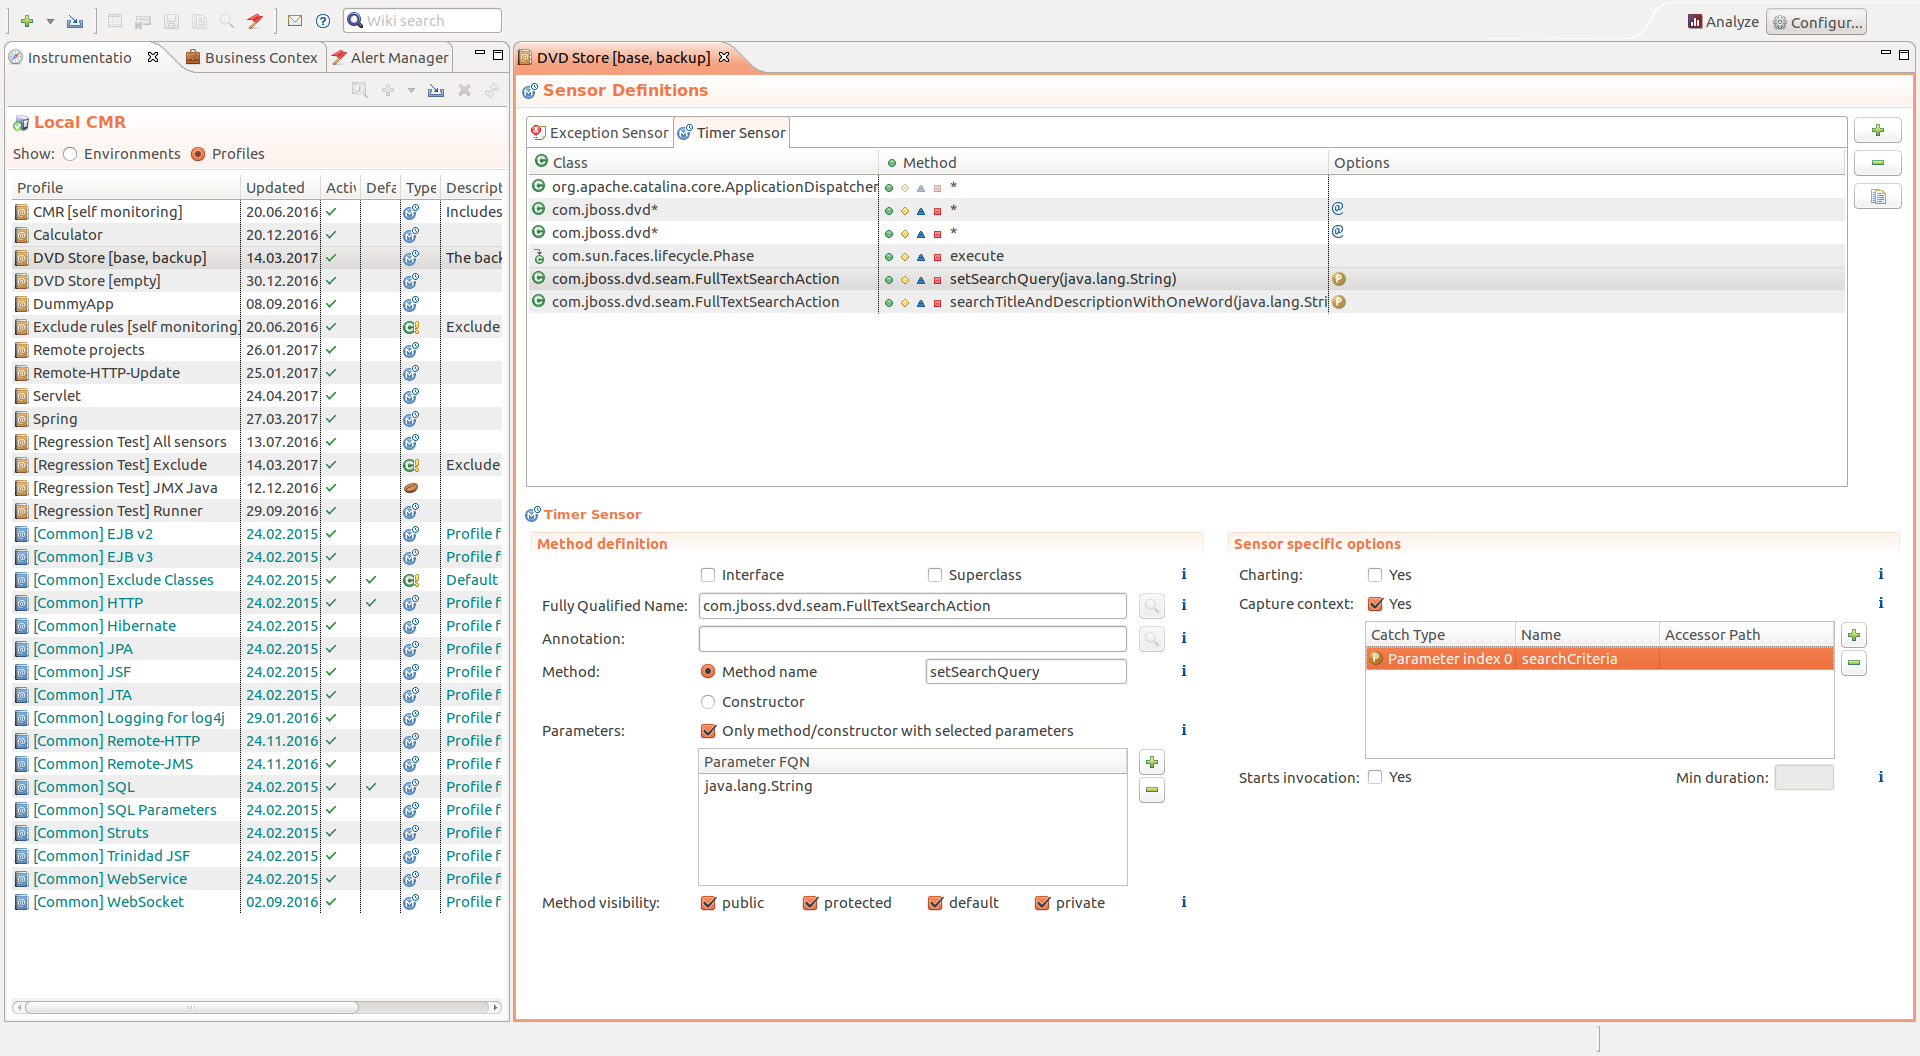
inspectIT already ships with out-of-the-box instrumentations for commonly used Java technologies. If your technology is missing, you can easily instrument it manually (or request a new profile). We currently support:

  • JavaEE
    • Enterprise Java Beans (EJB)
    • Java Server Faces (JSF)
    • Java Transaction API (JTA)
    • Servlets API
    • WebServices
    • WebSockets
  • Java Persistence
    • JDBC
    • JPA
    • Hibernate
  • Remote Communication Tracing
    • HTTP
    • JMS
  • Others
    • Apache Struts
    • Apache MyFaces Trinidad
    • Executor service tracing

Supported Application Platforms

  • Glassfish
  • IBM WebSphere
  • Jetty
  • JBoss / Wildfly
  • Oracle Weblogic
  • Resin
  • Tomcat
  • ..
  • and any plain Java application

Project Structure

Project Description
inspectit.agent.java Agent for instrumenting and monitoring Java 6+ applications.
inspectit.agent.java.sdk Java SDK that implements opentracing.io API.
inspectit.server Server component know as Central Measurement Repository (CMR).
inspectit.server.diagnosis Component for automatic performance problems diagnosis (see diagnoseIT project).
inspectit.shared.all Classes shared between all projects.
inspectit.shared.cs Classes shared between server and UI projects.
inspectit.ui.rcp inspectIT user interface based on Eclipse RCP.

Related Projects

  • Experimental features and supporting components of inspectIT are located at inspectIT Labs
  • Our Docker integration projects are located at inspectIT Docker

Integration

The integration of inspectIT in your application is completely transparent, you do not have to change a single line of code. The only thing you have to do is to place our agent with your application and integrate it into your startup script.

The integration is as simple as adding the following to the startup of your application.

-javaagent:[INSPECTIT_AGENT_HOME]/inspectit-agent.jar -Dinspectit.repository=[REPOSITORY_IP]:[REPOSITORY_PORT] -Dinspectit.agent.name=[AGENT_DISPLAY_NAME]

The end user documentation provides in-depth documentation on the installation of inspectIT for all supported platforms. If you have further questions please get in touch with us.

Getting Started

For an easy and quick start using inspectIT check out the following video resources.

alte

Download

Docker Pulls Docker Pulls Docker Pulls Docker Pulls Docker Pulls Docker Pulls

You can get inspectIT in three ways:

โš ๏ธ Mac OSX users: please read the Running on MacOS to find out how to start the inspectIT UI on Mac.

Try it out with a demo application!

You can easily test the inspectIT features by starting out the demo based on the Spring Petclinic application. The repository inspectit-labs/spring-petclinic-microservices contains start-up and docker scripts that integrate the inspectIT into the famous Spring demo app. Also check the inspectit-labs/workshop for the in-detail step-by-step workshop that will walk you through using inspectIT with the demo application.

Awesome inspectIT List

You can find a lot more helpful resources in the inspectIT's awesome list.

Get in Touch

Twitter Account Gitter LinkedIn Group

We are interested in your feedback. Come chat with us and other users on Gitter. Visit the forum or simply drop us a line. You also might want to follow us at Twitter @inspectIT_apm or join discussions in our LinkedIn group.

Documentation

We are running an Atlassian Confluence for all sorts of documentation (thanks to Atlassian for the free license): From end user documentation to the road-map.

Contribute

You do not have to be a programmer to contribute to inspectIT, but if you are you are certainly welcome. Here is a short list of how you can contribute. Please see our Contribution Documentation

Developers

If you want to fix Bugs or implement Features on your own, you're very welcome to do so! For the easiest start, you just need to follow our Development Environment Documentation for installing Eclipse with all projects and settings already pre-configured via the new official Oomph installer.

Ticketing

We primarily use Atlassian JIRA for ticketing. But if you are in a hurry, please feel free to open a GitHub issue.

Licensing

inspectIT is licensed under Apache License version 2.0. Please see our licensing documentation for more details. (Note that releases up to 1.6.7 were licensed using AGPLv3)

Commercial Support

If you need the commercial support for the inspectIT please check the transparent package offering by NovaTec Consulting GmbH and feel free to contact us if you are interested.

Sponsoring

inspectIT is mainly driven by NovaTec Consulting GmbH, a German consultancy firm that specializes in software performance. Sponsoring a feature in inspectIT is always possible and welcome. Just get in touch with us through Sponsor a feature.

Research / Further Readings

inspectIT is the base for the research project diagnoseIT, sponsored by German federal ministry of education and research with more than 500.000โ‚ฌ.

inspectit-ocelot's People

Contributors

aaronweissler avatar abhishekb03 avatar alexanderwert avatar arianekraus avatar arolfes avatar boris-unckel avatar claudiowaldvogel avatar danipaniii avatar dependabot[bot] avatar dimi-ma avatar eddeccc avatar fylip97 avatar henning-schulz avatar ivansenic avatar jonaskunz avatar mahir-isikli avatar marcel-haag avatar mariusbrill avatar mariusoe avatar matthias-huber avatar mc-chaos avatar nttechnicaluser avatar patrick-eichhorn avatar quandor avatar salim-1997 avatar sbraitsch avatar timwildberger avatar tingrida avatar tituslabs avatar tobiangerstein avatar

Stargazers

 avatar  avatar  avatar  avatar  avatar  avatar  avatar  avatar  avatar  avatar  avatar  avatar  avatar  avatar  avatar  avatar  avatar  avatar  avatar  avatar  avatar  avatar  avatar  avatar  avatar  avatar  avatar  avatar  avatar  avatar  avatar  avatar  avatar  avatar  avatar  avatar  avatar  avatar  avatar  avatar  avatar  avatar  avatar  avatar  avatar  avatar  avatar  avatar  avatar  avatar  avatar  avatar  avatar  avatar  avatar  avatar  avatar  avatar  avatar  avatar  avatar  avatar  avatar  avatar  avatar  avatar  avatar  avatar  avatar  avatar  avatar  avatar  avatar  avatar  avatar  avatar  avatar  avatar  avatar  avatar  avatar  avatar  avatar  avatar  avatar  avatar  avatar  avatar  avatar  avatar  avatar  avatar  avatar  avatar  avatar  avatar  avatar  avatar  avatar  avatar

Watchers

 avatar  avatar  avatar  avatar  avatar  avatar  avatar  avatar  avatar  avatar  avatar  avatar  avatar  avatar  avatar  avatar  avatar  avatar

inspectit-ocelot's Issues

Enable tracing for entry points

Implement the method tracing based on our mind map. The entry-point should check if the remote context is available and if not check with sampler if tracing should be done or not. Don't cover non-entry point tracing impl in this issue. Add context key/value pairs to the span as the attributes.

System test: send a request to the own HTTP server with remote context and prove its passed on.

Improve error handling in case of a retransformation exception

In some cases the retransformation can fail, e.g. if another Agent performs some incorrect bytecode changes. This causes the retransformClasses call to throw an exception ,which we already catch. However, we submit the classes to retransform in batches (default is 10 classes). When an exception occurs, no class from the batch is transformed, event the ones which would have worked correctly.
Therefore we need an additional failure handling: If a batch fails, we retry a retransform for each class individually. In addition we should expose a self-monitoring metric exposing the number of classes which failed to instrument.

Implement a custom GRPC context value for passing data

OpenCensus uses GRPC to pass TagContexts around. We however see our "data" passed around as a superset of the tags. For example, the data is not limited to being a String type, data can be arbitrary objects. For this reason we need to implement a custom Context, which however keeps the OpenCensus context in sync.

Concept for the default tag context

How are we initializing the default tags, so generic application tags (service-name, host-name, process-id, etc). What tags we want to collect. The goal should be zero-configuration (no need to specify anything like before -Dinspectit.agent.name). We also need a way to collect tags that could come from a specific application type (SpringBoot) or cloud provider (CloudFundry, Azure, Kubernetes).

In the scope of this ticket:

  • create a generic tag provider interface / base class; these should also have a priority for overwriting (f.e. if the cloud foundry sets VCAP_APPLICATION env var, we should use service-name from this, not the properties or default)
  • implement tag provider(s) that reads values from properties (name?)
  • implement tag provider(s) that reads values from system (hostname, ip-address, etc)
  • showcase how priority works, maybe by creating something that works for SpringBoot
  • let the user have a possibility of adding a map of default tags via properties..

Kamon has a nice example on what can be defined in https://github.com/kamon-io/Kamon/blob/master/kamon-core/src/main/resources/reference.conf

Generic hook uses data providers for key/value context pairs

Create basic support for the data providers (collectors).

  • config model for the data providers
  • data provider impl can be different
  • they can collect data on entry, exit or both (have different methods for this of course)
  • figure out how can data providers be referenced in the instrumentation config
  • create/extend the hook, so that data providers are executed on the entry and exit
  • if we have before and after methods instead of proceed ensure that the result object of before hook is passed to the after one

Strategy to propagate the context up the stack trace

Use case: sometimes information related to the user request is not available in the entry point (f.e. business transaction is recognized somewhere in the impl flow). We need a way to propagate such information up so when metric is recorded we would have these tags also available.

  • data providers could opt to propagate up
  • propagation is done in the inspectIT specific GRPC context key at the exit
  • overwrite config option can be added to know what to do if key already available (f.e. two methods report the BT)

Fix occasional failure of system tests

The system tests occasionally fail because they try to read metrics from the OpenCensus API which are somehow not available. Strangely, the recording in inspectIT is executed prior to the tests, however it seems like the OpenCensus buffers the recorded data somewhere before it gets flushed and visible for the tests.

Currently we have added a sleep as a workaround, which however does not always work. We need to find a way to trigger the flushing of the metrics prior to performing test asertions. @ivansenic suggested that we could try to execute a synchronous get agains the prometheus endpoint. The hope is that this triggers the flushing of the metrics so that they are available for the tests.

Special sensor for Thread.start()

GRPC context propagation when a new thread has been started. Existing example from OC agent can be used.

  • provide system test
  • provide a config property that is enabled by default
  • add the Special Sensors chapter in the asciidoc

Create README.md files for project roots

We need to create the readme files for project roots where it makes sense.

Most important would be the repository root and this readme should be focused on users.

The readme files in the sub-projects should target the developer/contributor, explaining more what the purpose of the project is, what are the main things to consider, etc.

Externalize Agent into separate Container

In order to not download the agent for every single container, provide agent as separate container and mount it through a volume. For this we need:

  • creation of agent image with each release version
  • possibility to easily create current dev version image of the agent
  • package versioned demo with each release and provide it as ZIP download on GitHub release page

Logging strategy and configuration

Let's copy the old logging strategy we had with log-back originally in inspectIT.

But:

  • keep the log-back config in the classpath resources so it's used by default if the external file is not found
  • include the log-back configuration to the released artifact next to the inspectit-agent.jar (as now, but this time only use this as a reference for the user)
  • ensure that property exists that can point to some other location configuration file
  • remove the MinLog that we used originally because of Kryo

Maybe we should provide some easy logging config in the configuration file. This way a user can easily configure logging as everything else.

Minimal project setup

Create the minimal project setup:

  • gradle multip-project build (gradle 5.0 would be great if this is out)
    • since we would have only one project not sure if we need any crazy dependency strategy
    • keep jmh, jococo, etc
  • new project for the agent (inspectit-oce-agent?)
  • .gitignore that works with intellij (at best copy what's generated from Spring initz, I always found these to be good)
  • IntelliJ setup
    • save actions plugin, export configuration -> automatic formatting and import org when saved (Ivan can share configuration)
  • create CONTRIBUTE.MD and share any needed development environment setup

Confirm:

  • agent can be added by -javaagent (test versions 8 & 11)
  • agent can be attached to any already running JVM with utility like https://github.com/apangin/jattach (test versions 8 & 11)

Special sensor for scheduled executor services

Only one method should be targeted, we need to analyze which one. The old inspectIT does not have support for the scheduled executor service. Bottom line, we need to work against Callable and not Runnable. GRPC context has utility for wrapping the callable.

  • provide system test
  • provide a config property that is enabled by default
  • add the Special Sensors chapter in the asciidoc

Context propagation for the Apache HTTP client

Copy from the old inspectIT, should be straight forward if implemented after M3.

Add system test with latest Apache HTTP client (use 4.+ in Gradle) to always get the latest version.

Instrumentation fails when starting an application in IntelliJ using the agent

Starting an application directly in IntelliJ using the inspectIT agent will throw errors due to an instrumentation of the class com.intellij.rt.execution.application.AppMainV2$1. This is happening because IntelliJ adds an agent to the Java process as well.

When starting an application in debug-mode, the instrumentation of the Thread class will fail due to an error on an attempt to add a method to the class. Nevertheless, the error also appears when disabling our custom class file transformer. Due to this, it is most likly a problem to the agent attached by IntelliJ.

Basic method instrumentation config

  • define our own common instrumentation property in the config, maybe extract to a separate file that's added in the same way to the property sources as the default config
  • define basic stuff for supporting profiles, each profile should have a turn off property
  • have a possibility to define simple method references (className, methodName, interfaceName)
  • make sure that configurations for same method are merged
    • eaither solve this with ClassResolver or instrumentation callbacks
  • it would be nice to have information in the combined config because of which instrumentation entry/entries is this instrumentation acitve (we were missing this in the old inspectIT)

For testing purposes we should be able to have a simple hook that is for now simply logging the combined configuration out. IF we implement the knowledge about where the instrumentation is coming from, we could print this in a trace level.

Testing should be more done on the integration level, as for the system test it's quite hard to test this.

Remote span context read for the Servlet API 3.x

Entry point should be able to read the remote-span context if one is sent and thus continue the tracing appropriately. In this issue, we should just implement the reading of the context (already implemented in old inspectIT) and a way to provide it to the entry point.

No system test at this point.

Extending configuration to enable an annotation based target selection

Should support:

  • interface
  • super-class
  • class-annotation
  • method-annotation
  • method parameters (by default all methods with given name)
  • modifiers (only public by default? at least private should be not instrumented by default)

Please separate the class name, interface and super-class, we should allow configs that define all 3 and not like now only one FQN.

Nice to have (can be separated into further tickets and moved to another milestone):

  • wild-card (this is great, but we need to be careful here for what we want a wild-card to be possible)
    • don't allow * only
  • when the instrumenting by interface, instrument only methods available in that interface
  • when the instrumenting by super-class, instrument only methods available in that super-class

Setup project for the documentation

As agreed we will keep the end-user documentation in the same repository as the code. This way we can:

  • push documentation changes with code changes
  • release the versioned documentation
  • build the documentation at any time

As the scope of this ticket:

  • setup a project for this (f.e. inspectit-oce-documentation)
  • document everything that is important for the user until the time when the ticket is implemented

User defined instrumentation possibility

Allow users to define their own instrumentations for metrics collection. For now, only allow the collection of the response time as distribution (or sum) and count.

System test: instrument a class for system-test and prove metric was collected.

Metric recorder for the client HTTP requests

Collect metrics about all outgoing requests:

  • response time
  • error count

Tags used should be related to the client HTTP context keys.

System test calls google.com and checks the metrics are available. One case for error as well.

Upload test reports after failures on TravisCI

Currently some test fail occasionally as they assert that no errors or logs are generated by the agent.
However, travis does currently not show the stdout of the executed tests.

Therefore we either need to make travis output the test logs to the build log or let travis upload the report to the S3 in case of a test failure.

Introduce the byte buddy to the core

  • byte buddy should be available to the Spring context
  • we'll need a way to have a generic byte buddy configuration, check if there is anything we would need to configure at the moment

Span context propagation for the java.net.URLConnection

Enrich the exit point to propagate the current span context. The implementation exists in the old inspectIT project and can be used if the interfaces are based on the OC. Figure our how can the Tracestate be altered by us in order to inject flow-map based tags.

Note that implementation should be generic and should require only a proper injector to be bounded to exit point.

System tests can be done with the Wiremock to provide that the correct headers are injected.

Add a polling based alternative to the directory watching mechanisms

I found out that the configuration change notification of the config folder does not work in certain cases.
For example when the configuration folder is mounted from the network, it is possible that the Java WatchServices misses file change events.

I discovered this when using our demo on a Docker-toolbox installation. The config files get mounted perfectly and also changes are visible in the docker container, however no file system notifications are sent.

A simple solution would be to add a polling based WatchService alternative. We could use the following apache features for this: https://commons.apache.org/proper/commons-io/javadocs/api-release/index.html?org/apache/commons/io/monitor/package-summary.html
I would recommend that we add a "frequency" property to the inspectit.config.filebased configuration.
If the frequency is zero (which is the default), the WatchService is used. Otherwise we use a polling based approach.

Add open-census and configure metric providers

  • Evaluate where to place the OpenCensus dependencies: both on the bootstrap or only the API on the bootstrap and the Impl on the core?
  • configure the metric providers
    • start with Prometheus
    • create Configuration class per exporter, activated on f.e. inspectit.oce.exporter.metrics.prometheus.enabled
    • all properties for the exporter needs to be in the properties (for example port for Prometheus, endpoint for Stackdriver)
    • make sure all props are validated (spring)
    • test the properties strategy and adapt the aprach if needed

Important: at this point make sure that any metric collected in the programatic way in the monitored application will be visible on our configured exporter.

Enable replacing of the agent when attaching the jar at runtime

When currently attaching the agent to a JVM where another agent version is already running only the old agent gets restarted. This is because the agent main and the jars are loaded again from the old jar instead of the new one. This happends due to the fact that they share the same namespace. This could be solved by for example generating a package prefix based on the agent version or another builder number.

Special sensor for executor services

Target to instrument one method only, I think the old inspectIT has a correct configuration for this, please check, I think it's the interface based. GRPC context has a wrapping runnable utility.

  • provide system test
  • provide a config property that is enabled by default
  • add the Special Sensors chapter in the asciidoc

Class loading strategy and bootstrap loader

Keep our existing class loading strategy (see https://github.com/inspectIT/inspectIT/blob/master/inspectit.agent.java/src/main/java/rocks/inspectit/agent/java/javaagent/JavaAgent.java), meaning that we have a class loader that will load all our dependencies.

But:

  • let's have a package inside of our code f.e. rocks.inspectit.oce.agent.boostrap where all classes that needed to be pushed to the system class loader are
  • pack those separately into inspectit-bootstrap.jar and add this jar to the agent jar
  • create a possibility to have other dependencies also loaded by the system class loader (but control this with the build parameter, we could later on release the versions without any bootstrap dependencies so that users can use their own versions and don't depend on us)
  • the agent jar should look like:
/
  - boostrap/
    - inspectit-bootstrap.jar
    - opecensus-api.jar
    ...
  - libs/
    - spring-context.jar
    ... other dependencies loaded by our CL
  - manifest/
  .. agent classes

Let's also make some changes from the original JavaAgent:

  • don't use java.util.logging at all, for now simply collect log messages into some kind of list and optionally print that using System.out.. Later on we would push these to the created Spring context where we would have a logger for this.
  • adapt code for loading bootstrap and normal dependencies (the existing code should be optimized, as it was written for java 5)
  • update the fix related to the PlatformClassLoader in order that it works also for java 10, 11, etc.. Currently this fix is bound to work with java 9 only

A very good reference for the ticket is the OC javaagent project: https://github.com/census-instrumentation/opencensus-java/tree/master/contrib/agent

Add a minimal set of dependencies:

  • implementation: spring-context, slf4j with logback
  • test: junit5, assertj

Have a possibility to label different instances of same service

We need an instance tag that would set by default and which would report the instance id of the running service. In the future, we can read this information from the env vars if a service run on a specific could platform or service.

OpenCensus already has some means of reading the env information from AWS, k8s and Azure, maybe we could pull this in as well. However, this information is not related to the instance id, but more to region, etc.

Collect the HTTP request metrics for the Servlet API 3.x

Collecting metrics about the

  • response time
  • error count

for incoming HTTP requests. Use tags provided by the HTTP server data provider.

We need to support async servlet execution as well, thus this is a perfect moment to analyze all possibilities about the metric collection in case of async action. We should start by checking how do the special sensors help here (if at all). If they are not, we need a way of attaching the start time (or actually anything else to a request object). This would extend the process in our mind map.

System test: spin up the HTTP server and do a request against it. Test error case as well.

Initialize Spring context and properties

  • initialize the spring context on the agent start-up (log messages, add Instrumentation to the context we will need this later on)
  • create a default properties file
  • create properties strategy (we need to brainstorm this a while); idea is that we have set of default properties that would be overwritten with the env vars, but we need a long-term idea how can we deal with external properties. One idea could be to try to load the external files and maintain them together with our default properties. Then the system could always answer to the "property value request" as if not provided externally then default.

Before starting, have a look on:

Collect basic JVM metrics (cpu, memory, threads, gc, etc)

This should be a proof of concept that everything that we set up until now is correct. Let's not spend too much time thinking about what needs to be collected and how the Micrometer project already has most of the stuff figured out. Use that as the reference.

Make sure that everything is configurable:

  • each metric set could be disabled/enabled
  • each metric set could have an own collecting frequency, f.e. cpu every 10s, a memory every 1m
  • we need to already think here on how could the update of the configuration work, this is actually the most important task imo.. So how in the runtime we can disable something, how can we change the frequency and so on.. At the end not everything needs to be configurable, but it would be nice to have some idea on how this should work..
  • update integration tests, more focus on the integration test (unit test can be used to prove that interaction with the properties work, covering branches that we are not testing in the integration test)

Setup continuous integration service

  • evaluate available services (at least TravisCI should be working for the open source projects fine)
  • build/test on the pull request including integration tests
  • support testing with Java 8 and Java 11 (two containers)
  • check what static code analysis we could add (pmd, findbugs, etc)

Goal: pull request check already works with the submitted PR

Possibility to specify configuration via agentArgs

The environment variables and java command parameters work fine for specifying configuration or pointing to the file-based config. However, this only works if the agent is included in java command. If the agent is attached no configuration changes from the default one could be specified. We could allow a user to specify a JSON based configuration as part of the agent arguments, as:

-javaagent:inspectit-oce.jar={"config-key": "config-value"}

The agent args are already passed to the agent initializer. We need a top priority property source based on the given JSON (this properties have bigger importance over system env vars and java args ones) .

Add configuration validation

Validate the configuration on changes in the ConfigurationCenter. We should use utilities from Spring that should make this quite simple. Don't update nor fire the update event if the new configuration is not valid.

Data provider for the HTTP server request properties

Showcase the possibilities of #61 by implementing the data provider for the HTTP request on Servlet API 3.x.

Analyze if @JonasKunz idea about the JavaAssist compile code can be already used here or we should go for reflection. The old inspectIT project is helpful here as we already have full support there.

Docker compose for fast start-up

Immediately create a docker compose that can be used to start everything with our agent. This should serve as the quick start for any user that wants to try inspectit-oce in under 3 minutes. Check if we need another docker compose for the development environment (I guess not as zipkin docker image would be enough) .

Components:

  • demo-app with agent (this should be optional -> maybe user want's it's own app)
  • prometheus
  • zipkin
  • grafana

As we need to showcase that exporting to influxDB is possible, another setup could be:

  • demo-app with agent (this should be optional -> maybe user want's it's own app)
  • telegraph
  • influxdb
  • zipkin
  • grafana

Make sure all components are correctly connected.

Self monitoring concept

Add ability to include our own metrics and export them in the same way as the application metrics are exported. Have an own namespace for this, f.e. inspectit.internal.

  • can be turned off/on completely, by default disabled
  • integrate into metrics collector(s) and expose collection operation time for example

OC also provides some kind of self-monitoring concept. Maybe we should check how we could be integrated there.

AgentImpl requires logger too soon

We must not have a logger as a static field, but loaded only when the logging initialization is done. Yes, this means we can not print anything before logging is initialized :(

10:07:55,117 INFO  [org.jboss.as] (Controller Boot Thread) WFLYSRV0025: WildFly Full 9.0.2.Final (WildFly Core 1.0.2.Final) started in 5009ms - Started 628 of 800 services (221 services are lazy, passive or on-demand)
Exception in thread "Attach Listener" 10:08:11,252 ERROR [stderr] (Attach Listener) java.lang.reflect.InvocationTargetException
10:08:11,253 ERROR [stderr] (Attach Listener) 	at sun.reflect.NativeMethodAccessorImpl.invoke0(Native Method)
10:08:11,253 ERROR [stderr] (Attach Listener) 	at sun.reflect.NativeMethodAccessorImpl.invoke(NativeMethodAccessorImpl.java:62)
10:08:11,253 ERROR [stderr] (Attach Listener) 	at sun.reflect.DelegatingMethodAccessorImpl.invoke(DelegatingMethodAccessorImpl.java:43)
10:08:11,253 ERROR [stderr] (Attach Listener) 	at java.lang.reflect.Method.invoke(Method.java:498)
10:08:11,253 ERROR [stderr] (Attach Listener) 	at sun.instrument.InstrumentationImpl.loadClassAndStartAgent(InstrumentationImpl.java:386)
10:08:11,253 ERROR [stderr] (Attach Listener) 	at sun.instrument.InstrumentationImpl.loadClassAndCallAgentmain(InstrumentationImpl.java:411)
10:08:11,254 ERROR [stderr] (Attach Listener) Caused by: javax.xml.parsers.FactoryConfigurationError: Provider __redirected.__SAXParserFactory not found
10:08:11,254 ERROR [stderr] (Attach Listener) 	at javax.xml.parsers.FactoryFinder.newInstance(FactoryFinder.java:200)
10:08:11,254 ERROR [stderr] (Attach Listener) 	at javax.xml.parsers.FactoryFinder.newInstance(FactoryFinder.java:152)
10:08:11,254 ERROR [stderr] (Attach Listener) 	at javax.xml.parsers.FactoryFinder.find(FactoryFinder.java:232)
10:08:11,254 ERROR [stderr] (Attach Listener) 	at javax.xml.parsers.SAXParserFactory.newInstance(SAXParserFactory.java:127)
10:08:11,254 ERROR [stderr] (Attach Listener) 	at ch.qos.logback.core.joran.event.SaxEventRecorder.buildSaxParser(SaxEventRecorder.java:79)
10:08:11,254 ERROR [stderr] (Attach Listener) 	at ch.qos.logback.core.joran.event.SaxEventRecorder.recordEvents(SaxEventRecorder.java:57)
10:08:11,254 ERROR [stderr] (Attach Listener) 	at ch.qos.logback.core.joran.GenericConfigurator.doConfigure(GenericConfigurator.java:151)
10:08:11,255 ERROR [stderr] (Attach Listener) 	at ch.qos.logback.core.joran.GenericConfigurator.doConfigure(GenericConfigurator.java:110)
10:08:11,255 ERROR [stderr] (Attach Listener) 	at ch.qos.logback.core.joran.GenericConfigurator.doConfigure(GenericConfigurator.java:53)
10:08:11,255 ERROR [stderr] (Attach Listener) 	at ch.qos.logback.classic.util.ContextInitializer.configureByResource(ContextInitializer.java:75)
10:08:11,255 ERROR [stderr] (Attach Listener) 	at ch.qos.logback.classic.util.ContextInitializer.autoConfig(ContextInitializer.java:150)
10:08:11,255 ERROR [stderr] (Attach Listener) 	at org.slf4j.impl.StaticLoggerBinder.init(StaticLoggerBinder.java:84)
10:08:11,255 ERROR [stderr] (Attach Listener) 	at org.slf4j.impl.StaticLoggerBinder.<clinit>(StaticLoggerBinder.java:55)
10:08:11,255 ERROR [stderr] (Attach Listener) 	at org.slf4j.LoggerFactory.bind(LoggerFactory.java:150)
10:08:11,256 ERROR [stderr] (Attach Listener) 	at org.slf4j.LoggerFactory.performInitialization(LoggerFactory.java:124)
10:08:11,256 ERROR [stderr] (Attach Listener) 	at org.slf4j.LoggerFactory.getILoggerFactory(LoggerFactory.java:412)
10:08:11,256 ERROR [stderr] (Attach Listener) 	at org.slf4j.LoggerFactory.getLogger(LoggerFactory.java:357)
10:08:11,256 ERROR [stderr] (Attach Listener) 	at org.slf4j.LoggerFactory.getLogger(LoggerFactory.java:383)
10:08:11,256 ERROR [stderr] (Attach Listener) 	at rocks.inspectit.oce.core.AgentImpl.<clinit>(AgentImpl.java:26)
10:08:11,256 ERROR [stderr] (Attach Listener) 	at java.lang.Class.forName0(Native Method)
10:08:11,256 ERROR [stderr] (Attach Listener) 	at java.lang.Class.forName(Class.java:348)
10:08:11,256 ERROR [stderr] (Attach Listener) 	at rocks.inspectit.oce.bootstrap.AgentManager.startOrReplaceInspectitCore(AgentManager.java:30)
10:08:11,256 ERROR [stderr] (Attach Listener) 	at rocks.inspectit.oce.agent.AgentMain.premain(AgentMain.java:36)
10:08:11,256 ERROR [stderr] (Attach Listener) 	at rocks.inspectit.oce.agent.AgentMain.agentmain(AgentMain.java:30)
10:08:11,257 ERROR [stderr] (Attach Listener) 	... 6 more
10:08:11,257 ERROR [stderr] (Attach Listener) Caused by: java.lang.ClassNotFoundException: __redirected/__SAXParserFactory
10:08:11,257 ERROR [stderr] (Attach Listener) 	at java.lang.Class.forName0(Native Method)
10:08:11,257 ERROR [stderr] (Attach Listener) 	at java.lang.Class.forName(Class.java:348)
10:08:11,257 ERROR [stderr] (Attach Listener) 	at javax.xml.parsers.FactoryFinder.getProviderClass(FactoryFinder.java:124)
10:08:11,257 ERROR [stderr] (Attach Listener) 	at javax.xml.parsers.FactoryFinder.newInstance(FactoryFinder.java:188)
10:08:11,257 ERROR [stderr] (Attach Listener) 	... 29 more
Agent failed to start!

Support for integration tests

Support for the integration test where a separate JVM is started with our agent and test is executed. A very good example is given in the https://github.com/census-instrumentation/opencensus-java/tree/master/contrib/agent, we could simply copy this.

Make sure:

  • opencensus-test is on the test classpath, this provides utilities to test the OC exporters
  • properties could be tampered with, -> we need a possibility to start integration test with f.e. inspectit.oce.some-property=false also if this is not default

Create a first test that serves as an example.

Improving system test for GCMetricsRecorder

The system test for the GCMetricsRecorder is often failing due to a missing GC. The test is depending on a GC in a certain timeframe. This GC will be enforce but it is not always working resulting in failing test - even the actual code is properly working.

The test should be more robust and be able to handle if no GC is happening in a certain duration without leting the build failing

Recommend Projects

  • React photo React

    A declarative, efficient, and flexible JavaScript library for building user interfaces.

  • Vue.js photo Vue.js

    ๐Ÿ–– Vue.js is a progressive, incrementally-adoptable JavaScript framework for building UI on the web.

  • Typescript photo Typescript

    TypeScript is a superset of JavaScript that compiles to clean JavaScript output.

  • TensorFlow photo TensorFlow

    An Open Source Machine Learning Framework for Everyone

  • Django photo Django

    The Web framework for perfectionists with deadlines.

  • D3 photo D3

    Bring data to life with SVG, Canvas and HTML. ๐Ÿ“Š๐Ÿ“ˆ๐ŸŽ‰

Recommend Topics

  • javascript

    JavaScript (JS) is a lightweight interpreted programming language with first-class functions.

  • web

    Some thing interesting about web. New door for the world.

  • server

    A server is a program made to process requests and deliver data to clients.

  • Machine learning

    Machine learning is a way of modeling and interpreting data that allows a piece of software to respond intelligently.

  • Game

    Some thing interesting about game, make everyone happy.

Recommend Org

  • Facebook photo Facebook

    We are working to build community through open source technology. NB: members must have two-factor auth.

  • Microsoft photo Microsoft

    Open source projects and samples from Microsoft.

  • Google photo Google

    Google โค๏ธ Open Source for everyone.

  • D3 photo D3

    Data-Driven Documents codes.