Coder Social home page Coder Social logo

ibm / visualize-food-insecurity Goto Github PK

View Code? Open in Web Editor NEW
28.0 31.0 26.0 17.7 MB

Use Watson Analytics and Pixie Dust to visualize US Food Insecurity

Home Page: https://developer.ibm.com/code/patterns/create-visualizations-to-understand-food-insecurity/

Jupyter Notebook 100.00%
ibmcode watson-analytics pixiedust data-science call-for-code watson-studio

visualize-food-insecurity's Introduction

Visualizing Food Insecurity with Watson Studio and PixieDust

This Code Pattern will guide you through downloading, cleaning and visualizing data using different tools. In particular this Code Pattern showcases food insecurity in the US, along with its associated factors.

Often in data science we do a great deal of work to glean insights that have an impact on society or a subset of it and yet, often, we end up not communicating our findings or communicating them ineffectively to non data science audiences. That's where visualizations become the most powerful. By visualizing our insights and predictions, we, as data scientists and data lovers, can make a real impact and educate those around us that might not have had the same opportunity to work on a project of the same subject. By visualizing our findings and those insights that have the most power to do social good, we can bring awareness and maybe even change. This Code Pattern walks you through how to do just that, with IBM's Watson Studio, Pandas, PixieDust.

For this particular Code Pattern, food insecurity throughout the US is focused on. Low access, diet-related diseases, race, poverty, geography and other factors are considered by using open government data. For some context, this problem is a more and more relevant problem for the United States as obesity and diabetes rise and two out of three adult Americans are considered obese, one third of American minors are considered obese, nearly ten percent of Americans have diabetes and nearly fifty percent of the African American population have heart disease. Even more, cardiovascular disease is the leading global cause of death, accounting for 17.3 million deaths per year, and rising. Native American populations more often than not do not have grocery stores on their reservation... and all of these trends are on the rise. The problem lies not only in low access to fresh produce, but food culture, low education on healthy eating as well as racial and income inequality.

The government data that I use in this Code Pattern has been conveniently combined into a dataset for our use, which you can find in this repo under combined_data.csv.zip. You can find the original, government data from the US Bureau of Labor Statistics https://www.bls.gov/cex/ and The United States Department of Agriculture https://www.ers.usda.gov/data-products/food-environment-atlas/data-access-and-documentation-downloads/.

Notebooks

Flow

  1. Open Watson Studio and create a notebook.
  2. Download the data in Watson Studio and explore it.
  3. Load Pixie Dust and use for visualizations.
  4. Download dataframe as a csv from Watson Studio.

Included components

  • IBM Watson Studio: Analyze data using RStudio, Jupyter, and Python in a configured, collaborative environment that includes IBM value-adds, such as managed Spark.
  • Jupyter Notebook: An open source web application that allows you to create and share documents that contain live code, equations, visualizations, and explanatory text.
  • PixieDust: Provides a Python helper library for IPython Notebook.

Featured technologies

  • Python: Python is a programming language that lets you work more quickly and integrate your systems more effectively.
  • Pandas: A Python library providing high-performance, easy-to-use data structures.

Watch the Video

Steps

Run using a Jupyter notebook in the IBM Watson Studio

  1. Create a new Watson Studio project
  2. Create the notebook
  3. Upload data
  4. Run the notebook
  5. Save and Share

1. Create a new Watson Studio project

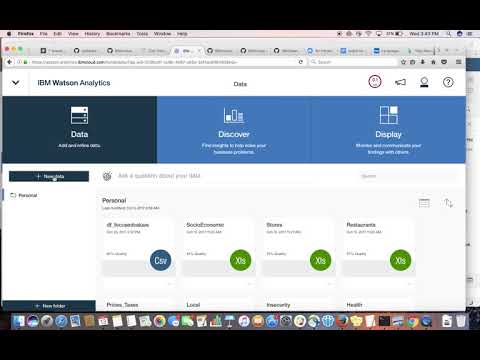
  • Log into IBM's Watson Studio. Once in, you'll land on the dashboard.

  • Create a new project by clicking + New project and choosing Data Science:

    studio project

  • Enter a name for the project name and click Create.

  • NOTE: By creating a project in Watson Studio a free tier Object Storage service and Watson Machine Learning service will be created in your IBM Cloud account. Select the Free storage type to avoid fees.

    studio-new-project

  • Upon a successful project creation, you are taken to a dashboard view of your project. Take note of the Assets and Settings tabs, we'll be using them to associate our project with any external assets (datasets and notebooks) and any IBM cloud services.

    studio-project-dashboard

2. Create the Notebook

  • From the new project Overview panel, click + Add to project on the top right and choose the Notebook asset type.

studio-project-dashboard

3. Upload data

  • This project uses the dataset in combined_data.csv.zip. We need to load this asset to our project.

  • Extract the zip file with your favorite unzip tool.

  • From the new project Overview panel, click + Add to project on the top right and choose the Data asset type.

    add asset

  • A panel on the right of the screen will appear to assit you in uploading data. Follow the numbered steps in the image below.

    • Ensure you're on the Load tab. [1]
    • Click on the browse option. From your machine, browse to the location of the combined_data.csv file in this repository, and upload it. [not numbered]
    • Once uploaded, go to the Files tab. [2]
    • Ensure the combined_data.csv appears. [3]

    add data

4. Run the notebook

  • Click the (►) Run button to start stepping through the notebook.

  • Stop at the second cell Insert your data as a Pandas DataFrame.

  • Click on the 1001 data icon in the top right. The data files should show up.

  • Click on each and select Insert Pandas Data Frame. Once you do that, a whole bunch of code will show up in the highlighted cell.

  • Make sure your combined_data.csv is saved as df_data_1, so that it is consistent with my notebook and so you do not have to change the code.

5. Save and Share

How to save your work:

Under the File menu, there are several ways to save your notebook:

  • Save will simply save the current state of your notebook, without any version information.
  • Save Version will save your current state of your notebook with a version tag that contains a date and time stamp. Up to 10 versions of your notebook can be saved, each one retrievable by selecting the Revert To Version menu item.

How to share your work:

You can share your notebook by selecting the Share button located in the top right section of your notebook panel. The end result of this action will be a URL link that will display a “read-only” version of your notebook. You have several options to specify exactly what you want shared from your notebook:

  • Only text and output: will remove all code cells from the notebook view.
  • All content excluding sensitive code cells: will remove any code cells that contain a sensitive tag. For example, # @hidden_cell is used to protect your dashDB credentials from being shared.
  • All content, including code: displays the notebook as is.
  • A variety of download as options are also available in the menu.

Analyzing output

By reviewing our visualizations in Watson Studio, we learn that obesity and diabetes almost go hand in hand, along with food insecurity. We can also learn that this seems to be an inequality issue, both in income and race, with Black and Hispanic populations being more heavily impacted by food insecurity and diet-related diseases than those of the White and Asian populations. We can also see that school-aged children who qualify for reduced lunch are more likely obese than not whereas those that have a farm-to-school program are more unlikely to be obese.

Like many data science investigations, this analysis could have a big impact on policy and people's approach to food insecurity in the U.S. What's best is that we can create many projects much like this in a quick time period and share them with others by using Pandas, PixieDust as well as Watson's predictive and recommended visualizations.

Links

Learn more

  • Data Analytics Code Patterns: Enjoyed this Code Pattern? Check out our other Data Analytics Code Patterns
  • AI and Data Code Pattern Playlist: Bookmark our playlist with all of our Code Pattern videos
  • Watson Studio: Master the art of data science with IBM's Watson Studio

License

This code pattern is licensed under the Apache Software License, Version 2. Separate third party code objects invoked within this code pattern are licensed by their respective providers pursuant to their own separate licenses. Contributions are subject to the Developer Certificate of Origin, Version 1.1 (DCO) and the Apache Software License, Version 2.

Apache Software License (ASL) FAQ

visualize-food-insecurity's People

Contributors

dolph avatar imgbot[bot] avatar kant avatar ljbennett62 avatar madisonjmyers avatar rhagarty avatar sanjeevghimire avatar scottdangelo avatar stevemar avatar stevemart avatar

Stargazers

 avatar  avatar  avatar  avatar  avatar  avatar  avatar  avatar  avatar  avatar  avatar  avatar  avatar  avatar  avatar  avatar  avatar  avatar  avatar  avatar  avatar  avatar  avatar  avatar  avatar  avatar  avatar  avatar

Watchers

 avatar  avatar  avatar  avatar  avatar  avatar  avatar  avatar  avatar  avatar  avatar  avatar  avatar  avatar  avatar  avatar  avatar  avatar  avatar  avatar  avatar  avatar  avatar  avatar  avatar  avatar  avatar  avatar  avatar  avatar  avatar

visualize-food-insecurity's Issues

add cell for pandas data frame

I'm not sure if it's necessary, but following the existing instructions to just add the data frame without clicking on a specific cell for that results in the data frame being added to the first cell.
This first cell is merely instructional, so the data frame info gets merged in and it has some weird formatting.

Fix typo(s)

".. one third of American minors are considered obsese,.."

Notebook getting warnings

@MadisonJMyers - using the latest version of IBM Watson Studio, I'm getting warnings in a couple of cells which I don't recall seeing before. The notebook appears to run correctly, but you should probably check it out.

Cell 2 - /opt/conda/envs/DSX-Python35/lib/python3.5/site-packages/IPython/core/interactiveshell.py:2698: DtypeWarning: Columns (208,209,211,214) have mixed types. Specify dtype option on import or set low_memory=False.
interactivity=interactivity, compiler=compiler, result=result)

Cell 13 - /opt/conda/envs/DSX-Python35/lib/python3.5/site-packages/seaborn/categorical.py:1460: FutureWarning: remove_na is deprecated and is a private function. Do not use.
stat_data = remove_na(group_data)

Remove notebook content from README

Lots of good info in README, but most of the steps describe is repeated in the notebook. I think you should just describe what you are going to accomplish/show with the notebook, then provide the steps to run it. Once there, they can see all of the specific detail about each of the steps/cells.

Notebook URL is not valid

Get a 404 for this:

https://github.com/IBM/visualize-food-insecurity/blob/visualize-food-insecurity/notebooks/Diet-Related-Disease-Exploratory.ipynb

README changes

@MadisonJMyers - nice progress, but still needs some minor tweeks. This will be easier once we move this repo to IBM, where I can just make changes directly.

  1. remove the dashes from your title
  2. remove the everything after that until the "This journey will guide ...". This will be your intro paragraph.
  3. remove the "architecture image" tag and title for your diagram.
  4. substitute the word "journey" with "Code Pattern".
  5. "Steps". Each of the steps should be a title with a section. Please check out how Dilip's does this in his journey in the section "Run using a jupyter notebook in the IBM data science experience".

Assuming your journey only runs in a notebook, your steps should probably mimic his journey steps. Note that each step has a section to provide details on how to accomplish the step. If you have additional steps on loading data, you would add those steps here.

We can talk about this more on Slack...

modify notebook name

use dashes instead of spaces in the notebook name. Otherwise you can't add the link in the README. If fact, to get it to work in the current README, dashes were added to the name which means if you click on it you get a 404 error.

@MadisonJMyers

Need journey files

From other Spark journeys, copy the following files:
ACKNOWLEDGMENT.md (add appropriate contributors here)
CONTRIBUTING.md (update links in the file to point to your repo - this can wait until you move to IBM)
MAINTAINERS.md (no changes needed)

Mismatch in notebook name

Link to copy in README is
https://github.com/IBM/visualize-food-insecurity/blob/master/notebooks/Diet-Related-Disease-Exploratory.ipynb

Current file in repo has name
https://github.com/IBM/visualize-food-insecurity/blob/master/notebooks/Diet-Related%20Disease%20Exploratory.ipynb

upload new example_output

The notebook has changed, so generate and save a new example of the output. Also, document where this lives in the README.

Bad Link

in the README text "but you can follow along with the steps below!", the "steps" link gives a 404 error

Update notebook

Please update text - replace "journey" with "Code Pattern" (case sensitive), and any references to "Bluemix" should be replaced with "IBM Cloud".

@MadisonJMyers

Issues creating Data Science projects in current steps

When signing up for Watson Studio using the link in:

https://github.com/IBM/visualize-food-insecurity?cm_sp=Developer-_-create-visualizations-to-understand-food-insecurity-_-Get-the-Code#1-sign-up-for-the-watson-studio

The Watson Studio account doesn't provide tooling for creating a Data Science project. Instead using the IBM Cloud Catalog to create the service instance for Watson Studio needs be used to be able to see the option for Data Science projects.

Issue on exporting dataframe/file

I´m in problem in the end of notebook to download dataframe from DSX to csv file (in order to import it to WA)

So according to this help I should get something like this ( https://medium.com/ibm-data-science-experience/working-with-object-storage-in-data-science-experience-python-edition-c96bc6c6101)

credentials_1 = {
        'auth_url': 'https://identity.open.softlayer.com',
        'project': 'object_storage_9-----3',
        'project_id': '7babac2********e0',
        'region': 'dallas',
        'user_id': '9603b8************70f',
        'domain_id': '2c66d***********b9d26',
        'domain_name': '1026***',
        'username': 'member_******************',
        'password': ""
        "***************"
        "",
        'container': 'TemplateNotebooks',
        'tenantId': 'undefined',
        'filename': 'data_by_var.json'
}

But instead I´m getting code like this :

credentials_100 = {
'IBM_API_KEY_ID': 'api-key-here',
'IAM_SERVICE_ID': 'service-id-here',
'ENDPOINT': 'https://s3-api.us-geo.objectstorage.service.networklayer.com',
'IBM_AUTH_ENDPOINT': 'https://iam.ng.bluemix.net/oidc/token',
'BUCKET': 'bucket-name-really-in-here',
'FILE': 'combined_data.csv'
}

It doesnt inclyude user_id etc. which are required in next notebook cell def_putfile - call and as you have in your examåple

What I´m doing wrong in here and anyidea how to fix this? Thanks a lot for great example =)

Recommend Projects

  • React photo React

    A declarative, efficient, and flexible JavaScript library for building user interfaces.

  • Vue.js photo Vue.js

    🖖 Vue.js is a progressive, incrementally-adoptable JavaScript framework for building UI on the web.

  • Typescript photo Typescript

    TypeScript is a superset of JavaScript that compiles to clean JavaScript output.

  • TensorFlow photo TensorFlow

    An Open Source Machine Learning Framework for Everyone

  • Django photo Django

    The Web framework for perfectionists with deadlines.

  • D3 photo D3

    Bring data to life with SVG, Canvas and HTML. 📊📈🎉

Recommend Topics

  • javascript

    JavaScript (JS) is a lightweight interpreted programming language with first-class functions.

  • web

    Some thing interesting about web. New door for the world.

  • server

    A server is a program made to process requests and deliver data to clients.

  • Machine learning

    Machine learning is a way of modeling and interpreting data that allows a piece of software to respond intelligently.

  • Game

    Some thing interesting about game, make everyone happy.

Recommend Org

  • Facebook photo Facebook

    We are working to build community through open source technology. NB: members must have two-factor auth.

  • Microsoft photo Microsoft

    Open source projects and samples from Microsoft.

  • Google photo Google

    Google ❤️ Open Source for everyone.

  • D3 photo D3

    Data-Driven Documents codes.