Coder Social home page Coder Social logo

home-assistant / analytics.home-assistant.io Goto Github PK

View Code? Open in Web Editor NEW
25.0 25.0 20.0 1.77 MB

Home of the Home Assistant usage stats.

Home Page: https://analytics.home-assistant.io/

License: Apache License 2.0

Shell 3.52% HTML 25.14% TypeScript 55.85% JavaScript 12.73% CSS 2.25% Liquid 0.49%
hacktoberfest

analytics.home-assistant.io's Introduction

Home Assistant Chat Status

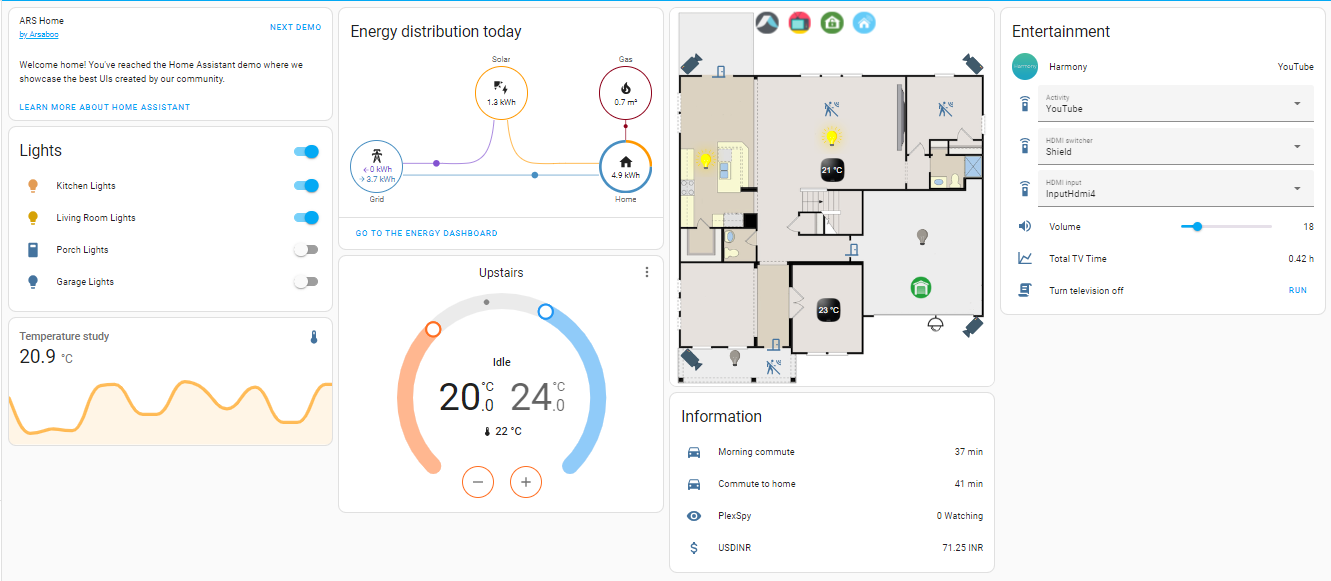
Open source home automation that puts local control and privacy first. Powered by a worldwide community of tinkerers and DIY enthusiasts. Perfect to run on a Raspberry Pi or a local server.

Check out home-assistant.io for a demo, installation instructions, tutorials and documentation.

This is a project of the Open Home Foundation.

screenshot-states

Featured integrations

screenshot-integrations

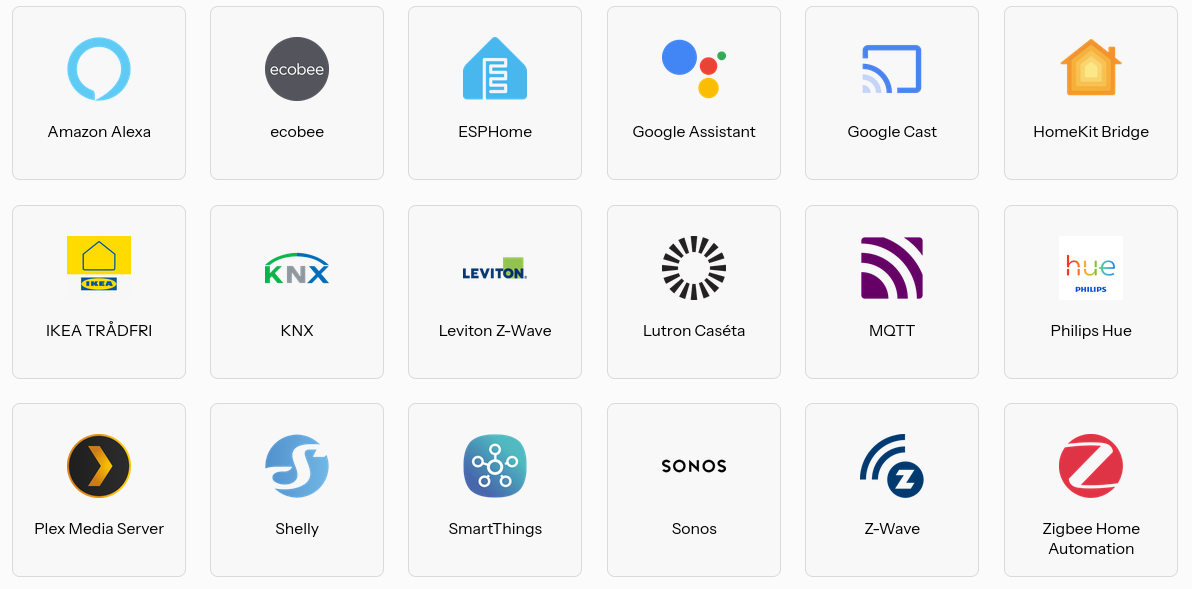
The system is built using a modular approach so support for other devices or actions can be implemented easily. See also the section on architecture and the section on creating your own components.

If you run into issues while using Home Assistant or during development of a component, check the Home Assistant help section of our website for further help and information.

analytics.home-assistant.io's People

Contributors

agners avatar balloob avatar bessarabov avatar bramkragten avatar cdce8p avatar darkxst avatar davet2001 avatar dependabot[bot] avatar liju09 avatar ludeeus avatar mbo18 avatar plakna avatar

Stargazers

 avatar  avatar  avatar  avatar  avatar  avatar  avatar  avatar  avatar  avatar  avatar  avatar  avatar  avatar  avatar  avatar  avatar  avatar  avatar  avatar  avatar  avatar  avatar  avatar  avatar

Watchers

 avatar  avatar  avatar  avatar  avatar  avatar  avatar  avatar  avatar  avatar  avatar  avatar  avatar  avatar  avatar  avatar  avatar  avatar

analytics.home-assistant.io's Issues

Logaritmic scale

Very nice to see the analytics, but I am a bit surprised by the logarithmic scale on the vertical axis as set at

Isn't that a bit out of the ordinary since normally this is only used in two cases. The first is to respond to skewness towards large values; i.e., cases in which one or a few points are much larger than the bulk of the data. The second is to show percent change or multiplicative factors.

We are not dealing with percent changes or multiplication factors and when the bulk of the installations is sending analytics I am not sure if a (large) skewness is to be expected.

Input clear icon wrongly positioned in FF

In the latest FF version, the clear icon of the search field is wrongly positioned. Works fine though in current Chrome.

Firefox (100.0 (64-bit)):
grafik

Chrome (101.0.4951.54):
grafik

Ensure consistent decimals + blank before "%"

(${+(
(100 * entry.installations) /
this.currentData!.reports_integrations
).toFixed(1)}%)

Having consistent decimals would make the list rendering a bit nicer.
image

Not really sure if an explicit Number() conversion is required for the decimal to be guaranteed. In the browser console this seems to behave correctly:
console.log(((22369 * 100) / 58815).toFixed(1));

Also having a blank in front of the "%" would match what we do in the HA frontend and I think is the official ISO/DIN/... style.

Coloring scale of world map by population

Hey there,
I got curious about the Analytics world map presentation. Why is the US in darkest color? Turns out the countries are colored by absolute installation. That imho doesn't make sense. You should either divide by area or population to generate a more representative view.

installations: this.currentData?.countries[country] || 0,

I personally would go with the population of countries and there are many good sources for country population online, e.g. https://www.kaggle.com/erikbruin/countries-of-the-world-iso-codes-and-population?select=country-and-continent-codes-list-csv.csv

Best!

Custom Components Analytics is missing (Feature Request)

Hi team,

first of all a big thank you - the overall Home Assistant environment is fantastic. I saw in the logs that you collect custom component usage data too.

Would be good to see this in the analytics portal. This would help the hundreds of custom component developers (like me with my mercedes benz integration) to get a better usage understanding too.

Thanks
Rene

Todoist component not showing correct number of installations

I was checking the Todoist component docs for an unrelated issue, and I noticed that it shows 0 active installations.
That is clearly wrong since at least mine integration show be showing up hahaha

calendar:
  - platform: todoist
    token: !secret todoist_token

image

image

I'm using that integration for several months, so I guess it should be showing up in the analytics

analytics.home-assistant.io - Home Assistant Analytics website no longer hides system integrations

Bug? Home Assistant Analytics website (analytics.home-assistant.io) no longer hides system default integrations on statistics page:

https://analytics.home-assistant.io/integrations/

@ludeeus Before PR #648 was merged as part of #746 the filter hide system default integrations on the statistics page so that it did not show system integrations like; Webhook, Sun, Tags, Mobile App, Input Boolean, Input Number, etc.

This now makes the integrations page on the Home Assistant Analytics website show many system integrations that are IMHO probably not of much interest to most users and companies looking at that page for quick statics to see which IoT protocols and ecosystems are popular and promoted, like example; ESPHome, MQTT, Zigbee, Z-Wave, Matter, and Bluetooth, etc.

https://www.home-assistant.io/integrations/

It does no longer make sense with what was previously said that analytics would be used to promote integrations to and for manufacturers of IoT products who might be interested in joining the "Works with Home Assistant program" partner program:

https://www.home-assistant.io/blog/2021/11/12/100k-analytics/

https://www.home-assistant.io/blog/2022/07/12/partner-program/

https://partner.home-assistant.io/

Before

image

Now

image

New history graph shows past 17 hours

Is it wanted, that the new history graph only shows past 17 hours?

I think that it might be more useful, to show 7 days here or something. Otherwise the graphs will mostly be flat lines (except maybe for release day)
image

Filter out "default integrations" from integration list

Great idea / improvement!

Would it be an idea to be able to "filter out default integrations" - integrations that HA always loads - in the list of integration usage? Reason for bringing this up is that some integrations will always hog the first few lines as they are always (or almost always) loaded with HA (i.e. auth, zone, websocket, frontend etc)

Looking at the list now, this would for instance at least skip the first 23 lines potentially even more.

I am thinking of a checkbox style kind of thing, which upon selection removes the "ha default integrations" out of the list in the users browser. All at the user side - I am not suggesting to remove the data from the backend, just filter it in the frontend list when the box is ticked.

IPV6 not failing back to IPV4

If having local IPV6 but not IPV6 from ISP and the ISP DNS is doing IPV6 lockups OK is this module not working then its not testing IPV4 that working and getting error in the log.

Logger: homeassistant.components.analytics
Source: components/analytics/analytics.py:289
Integration: Analytics (documentation, issues)
First occurred: January 27, 2023 at 08:55:21 (2 occurrences)
Last logged: 08:55:21

Timeout sending analytics to https://analytics-api.home-assistant.io/v1

And ping from inside the container.

PING analytics-api.home-assistant.io (2606:4700:20::ac43:445a): 56 data bytes
^C
--- analytics-api.home-assistant.io ping statistics ---
19 packets transmitted, 0 packets received, 100% packet loss

I know its one not working ISP setting but i cant changing it the the ISP dont accepting it and its right they saying (instead delivering true IPV6).

But i think the module shall falling back to IPV4 if 6 is not working.

Google Translate & Microsoft TTS show as 0 installs

The analytics page shows that the Google Translate TTS and Microsoft TTS and other TTS integrations have 0 installs - which deemed odd. I think the numbers are actually included in the tts integration. I know for sure both should have at least 1 install (being mine ;-) )

image

Data missing from usage statistics

The usage statistics for integrations and add-ons seem to have dropped suddenly and drastically. The most popular integration is showing only 1260 installs.

image

Hard to read line graphs

The line graphs are very hard to read because the grid is so bright and the graphs are harder to distinguish from it.
If the grid lines were only as bright as the labels on the axes, that would be ideal:
Before:
image
After (photoshopped screenshot):
image

Missing country field in Basic Analytics

Hi everyone,

I recently upgraded to 2021.4.0 and enabled analytics, but az I can see country info is missing in sent data:

2021-04-07 22:15:09 INFO (MainThread) [homeassistant.components.analytics] Submitted analytics to Home Assistant servers. Information submitted includes {'uuid': 'xxxxxxxxxxxxxxxxxxxxxxxxxxxxxxxx', 'version': '2021.4.0', 'installation_type': 'Home Assistant Supervised', 'supervisor': {'healthy': True, 'supported': True}}

Documentation says IP address derived server-side from the IP address, but my HA runs on Debian in Docker container and both the host system and the container have private IP addresses. So is this the reason? Or can someone tell me how the IP address really derived?

Thank you in advance for the answers.

Recommend Projects

  • React photo React

    A declarative, efficient, and flexible JavaScript library for building user interfaces.

  • Vue.js photo Vue.js

    ๐Ÿ–– Vue.js is a progressive, incrementally-adoptable JavaScript framework for building UI on the web.

  • Typescript photo Typescript

    TypeScript is a superset of JavaScript that compiles to clean JavaScript output.

  • TensorFlow photo TensorFlow

    An Open Source Machine Learning Framework for Everyone

  • Django photo Django

    The Web framework for perfectionists with deadlines.

  • D3 photo D3

    Bring data to life with SVG, Canvas and HTML. ๐Ÿ“Š๐Ÿ“ˆ๐ŸŽ‰

Recommend Topics

  • javascript

    JavaScript (JS) is a lightweight interpreted programming language with first-class functions.

  • web

    Some thing interesting about web. New door for the world.

  • server

    A server is a program made to process requests and deliver data to clients.

  • Machine learning

    Machine learning is a way of modeling and interpreting data that allows a piece of software to respond intelligently.

  • Game

    Some thing interesting about game, make everyone happy.

Recommend Org

  • Facebook photo Facebook

    We are working to build community through open source technology. NB: members must have two-factor auth.

  • Microsoft photo Microsoft

    Open source projects and samples from Microsoft.

  • Google photo Google

    Google โค๏ธ Open Source for everyone.

  • D3 photo D3

    Data-Driven Documents codes.