Coder Social home page Coder Social logo

lumen's Introduction


HoloViz: High-level tools to simplify visualization in Python

Test suite status Status
Site/Content version Github tag
Docs gh-pages site dev-site
Status Dashboard
Binder Binder
Code of Conduct Based on Contributor Covenant
Fiscal Sponsor Powered by NumFOCUS

What is HoloViz?

HoloViz provides high-level Python tools that are designed to work together to solve the entire problem of visualization, from conducting exploratory data analysis to deploying complex dashboards.

The core HoloViz projects are:

  • Panel: Create interactive dashboards in Jupyter notebooks or standalone apps
  • hvPlot: Quickly and interactively explore data with a familiar API
  • HoloViews: Visualize while you analyze by declaring data properties
  • GeoViews: Extend HoloViews for geographic data
  • Datashader: Render big data images in a browser
  • Lumen: Construct no-code dashboards from simple YAML specifications
  • Colorcet: Plot with perceptually based colormaps
  • Param: Declaratively code in Python
Panel Logo hvPlot Logo HoloViews Logo GeoViews Logo
Datashader Logo Lumen Logo Colorcet Logo Param Logo

All HoloViz projects are freely available for commercial or non-commercial use according to a permissive open-source license as described in each project's website.

HoloViz uses a custom open governance model and is fiscally sponsored by NumFOCUS. Consider making a tax-deductible donation to help the project pay for developer time, professional services, travel, workshops, and a variety of other needs.

NumFOCUS donation details

NumFOCUS is a 501(c)(3) non-profit charity in the United States; as such, donations to NumFOCUS are tax-deductible as allowed by law. As with any donation, you should consult with your personal tax adviser or the IRS about your particular tax situation.


What is the purpose of this specific repository?

This repository provides an entry point for the HoloViz ecosystem. The best way to experience this repository is on HoloViz.org.

This website provides:

  1. Introduction to the HoloViz organization and its projects
  2. Guidance for which HoloViz tools to start with given different use cases
  3. Demonstrations of using multiple HoloViz tools in a single workflow
  4. Communication channels and FAQ for HoloViz community members
  5. Governance, roadmap, and contributing guide for HoloViz developers

Getting Started

We recommend starting with holoviz.org/tutorial. If you already have a problem to solve that involves a particular data type, check out holoviz.org/background for guidance on which HoloViz tools to focus on.

lumen's People

Contributors

ahuang11 avatar albertdefusco avatar droumis avatar eli-pinkus avatar hoxbro avatar jbednar avatar jlstevens avatar mattkram avatar maximlt avatar philippjfr avatar thuydotm avatar yougis avatar

Stargazers

 avatar  avatar  avatar  avatar  avatar  avatar  avatar  avatar  avatar  avatar  avatar  avatar  avatar  avatar  avatar  avatar  avatar  avatar  avatar  avatar  avatar  avatar  avatar  avatar  avatar  avatar  avatar  avatar  avatar  avatar  avatar  avatar  avatar  avatar  avatar  avatar  avatar  avatar  avatar  avatar  avatar  avatar  avatar  avatar  avatar  avatar  avatar  avatar  avatar  avatar  avatar  avatar  avatar  avatar  avatar  avatar  avatar  avatar  avatar  avatar  avatar  avatar  avatar  avatar  avatar  avatar  avatar  avatar  avatar  avatar  avatar  avatar  avatar  avatar  avatar  avatar  avatar  avatar  avatar  avatar  avatar  avatar  avatar  avatar  avatar  avatar  avatar  avatar  avatar  avatar  avatar  avatar  avatar  avatar  avatar  avatar  avatar  avatar  avatar  avatar

Watchers

 avatar  avatar  avatar  avatar  avatar  avatar  avatar  avatar  avatar  avatar  avatar

lumen's Issues

Simpler custom component support

Right now, the home page says that custom components can be provided by putting them into filters.py, sources.py, transforms.py, or views.py in the directory where you launch lumen. That's great, but having so many files seems like overkill for most users, particularly if they are using multiple projects in different directories, where they will end up copying all those files between multiple project directories. My gut tells me we should just suggest they put things into a single file, e.g. custom.py, and save those other files for more obscure cases where people want to install extensions in some central location.

It might be better to make this more explicit as well, at least allowing a user to state explicitly that a given .py file (of any name) is to be executed before continuing: lumen serve --run custom.py dashboard.yml. (If not --run, maybe --custom or --preload.) That way they can keep the file in a central location covering multiple projects, if desired, and indeed we may want to support running ~/.lumen/custom.py automatically for that reason (though that does have security implications and is less explicit).

Dynamically modify filters

Is your feature request related to a problem? Please describe.

The way our data is stored requires us to change filtering behavior based on other user configurable options.

Describe the solution you'd like

Would like to be able to programatically edit filters:

  • value
  • type
  • active/deactivate (would like to be able to dynamically enable and disable filters assigned to a view. This would be the highest priority item for our use case)

Describe alternatives you've considered

Alternative would require a lot of changes to the way we store our data

Better handling of clashing sources across yaml files

If you are serving multiple dashboards it is possible to define multiple shared sources with the same name but very different contents. This will lead to errors because the data or even the tables returned by the sources differs. When serving multiple dashboards we should hash the source definitions with the same name and warn (or error) if their definitions are not identical.

widget filter from integer field (which has no serialize method) give an error

i get an error when I use widget filter from an integer field I get an error during the querying.

It 's caused by this line of code

self.widget.param.value.serialize(self.widget.value)

I propose to change with :

        if not hasattr(self.widget.param.value, 'serialize'):
            return  self.widget.value
        else:
            return self.widget.param.value.serialize(self.widget.value)

to keep the initial serializing with widget that needs to be serialize and render directly the value in the other way.

I do a PR

Rename docs to doc

The documentation for the other HoloViz projects is in the doc/ subdirectory, but this one is called docs/. Seems like a good idea to make them all match so that we can use the same CI actions, etc.

Lumen UI Roadmap

Meta-issue to collect important improvements to the Lumen UI before a first release:

  • Add CLI command to launch lumen gui with options to configure UI
  • Auto-generate forms for custom components
  • Add UI to configure filters
  • Add UI to configure transforms
  • Improve UI for editing layouts
  • Establish plugin system for launchers
  • Establish way to build UI for custom lumen components
  • Figure out permissions model for persisting/editing/adding components

Consider making component type declarations optional

Each of the core extensible types (View, Source, Filter, Transform) works by explicitly declaring a view_type, source_type etc. In theory at least this could be optional and we could allow matching simply on the class name by default. Whether or not we decide to allow this, we need to have definition time constraints on having unique view names OR we could instead allow fully qualified imports for the type field, e.g. type: lumen_extension.views.CustomView.

Issues with numerical filtering

If I include a numerical column like flipper_length_mm as a filter widget using lumen=0.4.0a2.post2+g0c9fcc3, I get a very reasonable-looking widget but a very unreasonable looking plot

config:
  title: Palmer Penguins
sources:
  penguins:
    type: file
    tables:
      penguins: https://tinyurl.com/lumen21/penguins.csv
targets:
  - title: Palmer penguin
    source: penguins
    filters:
      - type: widget
        field: species
      - type: widget
        field: flipper_length_mm
    views:
      scatter:
        type: hvplot
        table: penguins
        kind: scatter
        x: bill_length_mm
        y: bill_depth_mm
        color: species
        responsive: true
        height: 500
        selection_group: penguin
    sizing_mode: stretch_both

image

If I take that widget out I get a very reasonable looking plot:

image

Am I making some silly error? Seems to work fine for categorical values and for year (an integer), but not for floats.

Simplify accordion sidebar for tabs layout

When using tabs as the layout for the targets we sync that with an accordion in the sidebar which expand as we click on the tabs. This works reasonably well but is also not great UI because:

  • The other accordion entries are superfluous
  • Clicking on an accordion item still expands it and collapses the UI for the current tab

We should either simplify this by only showing the UI elements corresponding to the current tabs OR at least sync the accordion with the tabs bi-directionally.

Standalone use of lumen components, e.g. in a notebook

Right now, the Lumen docs focus exclusively on building a complete dashboard, but Lumen also seems useful as a declarative, text-based specification for individual plots and layouts, whether to create a figure as output (HTML, PNG, SVG) or just for interactive use in a notebook. Notebooks seem useful for exploring datasets in a more flexible way than in a complete Lumen Dashboard, and seem like a good way to interactively develop new custom Lumen components. Plus we want to make it simple for people to start with some working examples (e.g. a Lumen Dashboard) and then drive them further (e.g. putting those components into a fully custom Panel app) without having to start over. (Short cuts, not dead ends!)

It looks like there is a way to construct a Source object and pass it to a View constructor to get a plot, but it would be helpful to have a documentation section explaining how to do this and possibly make it cleaner.

Bikes example issues

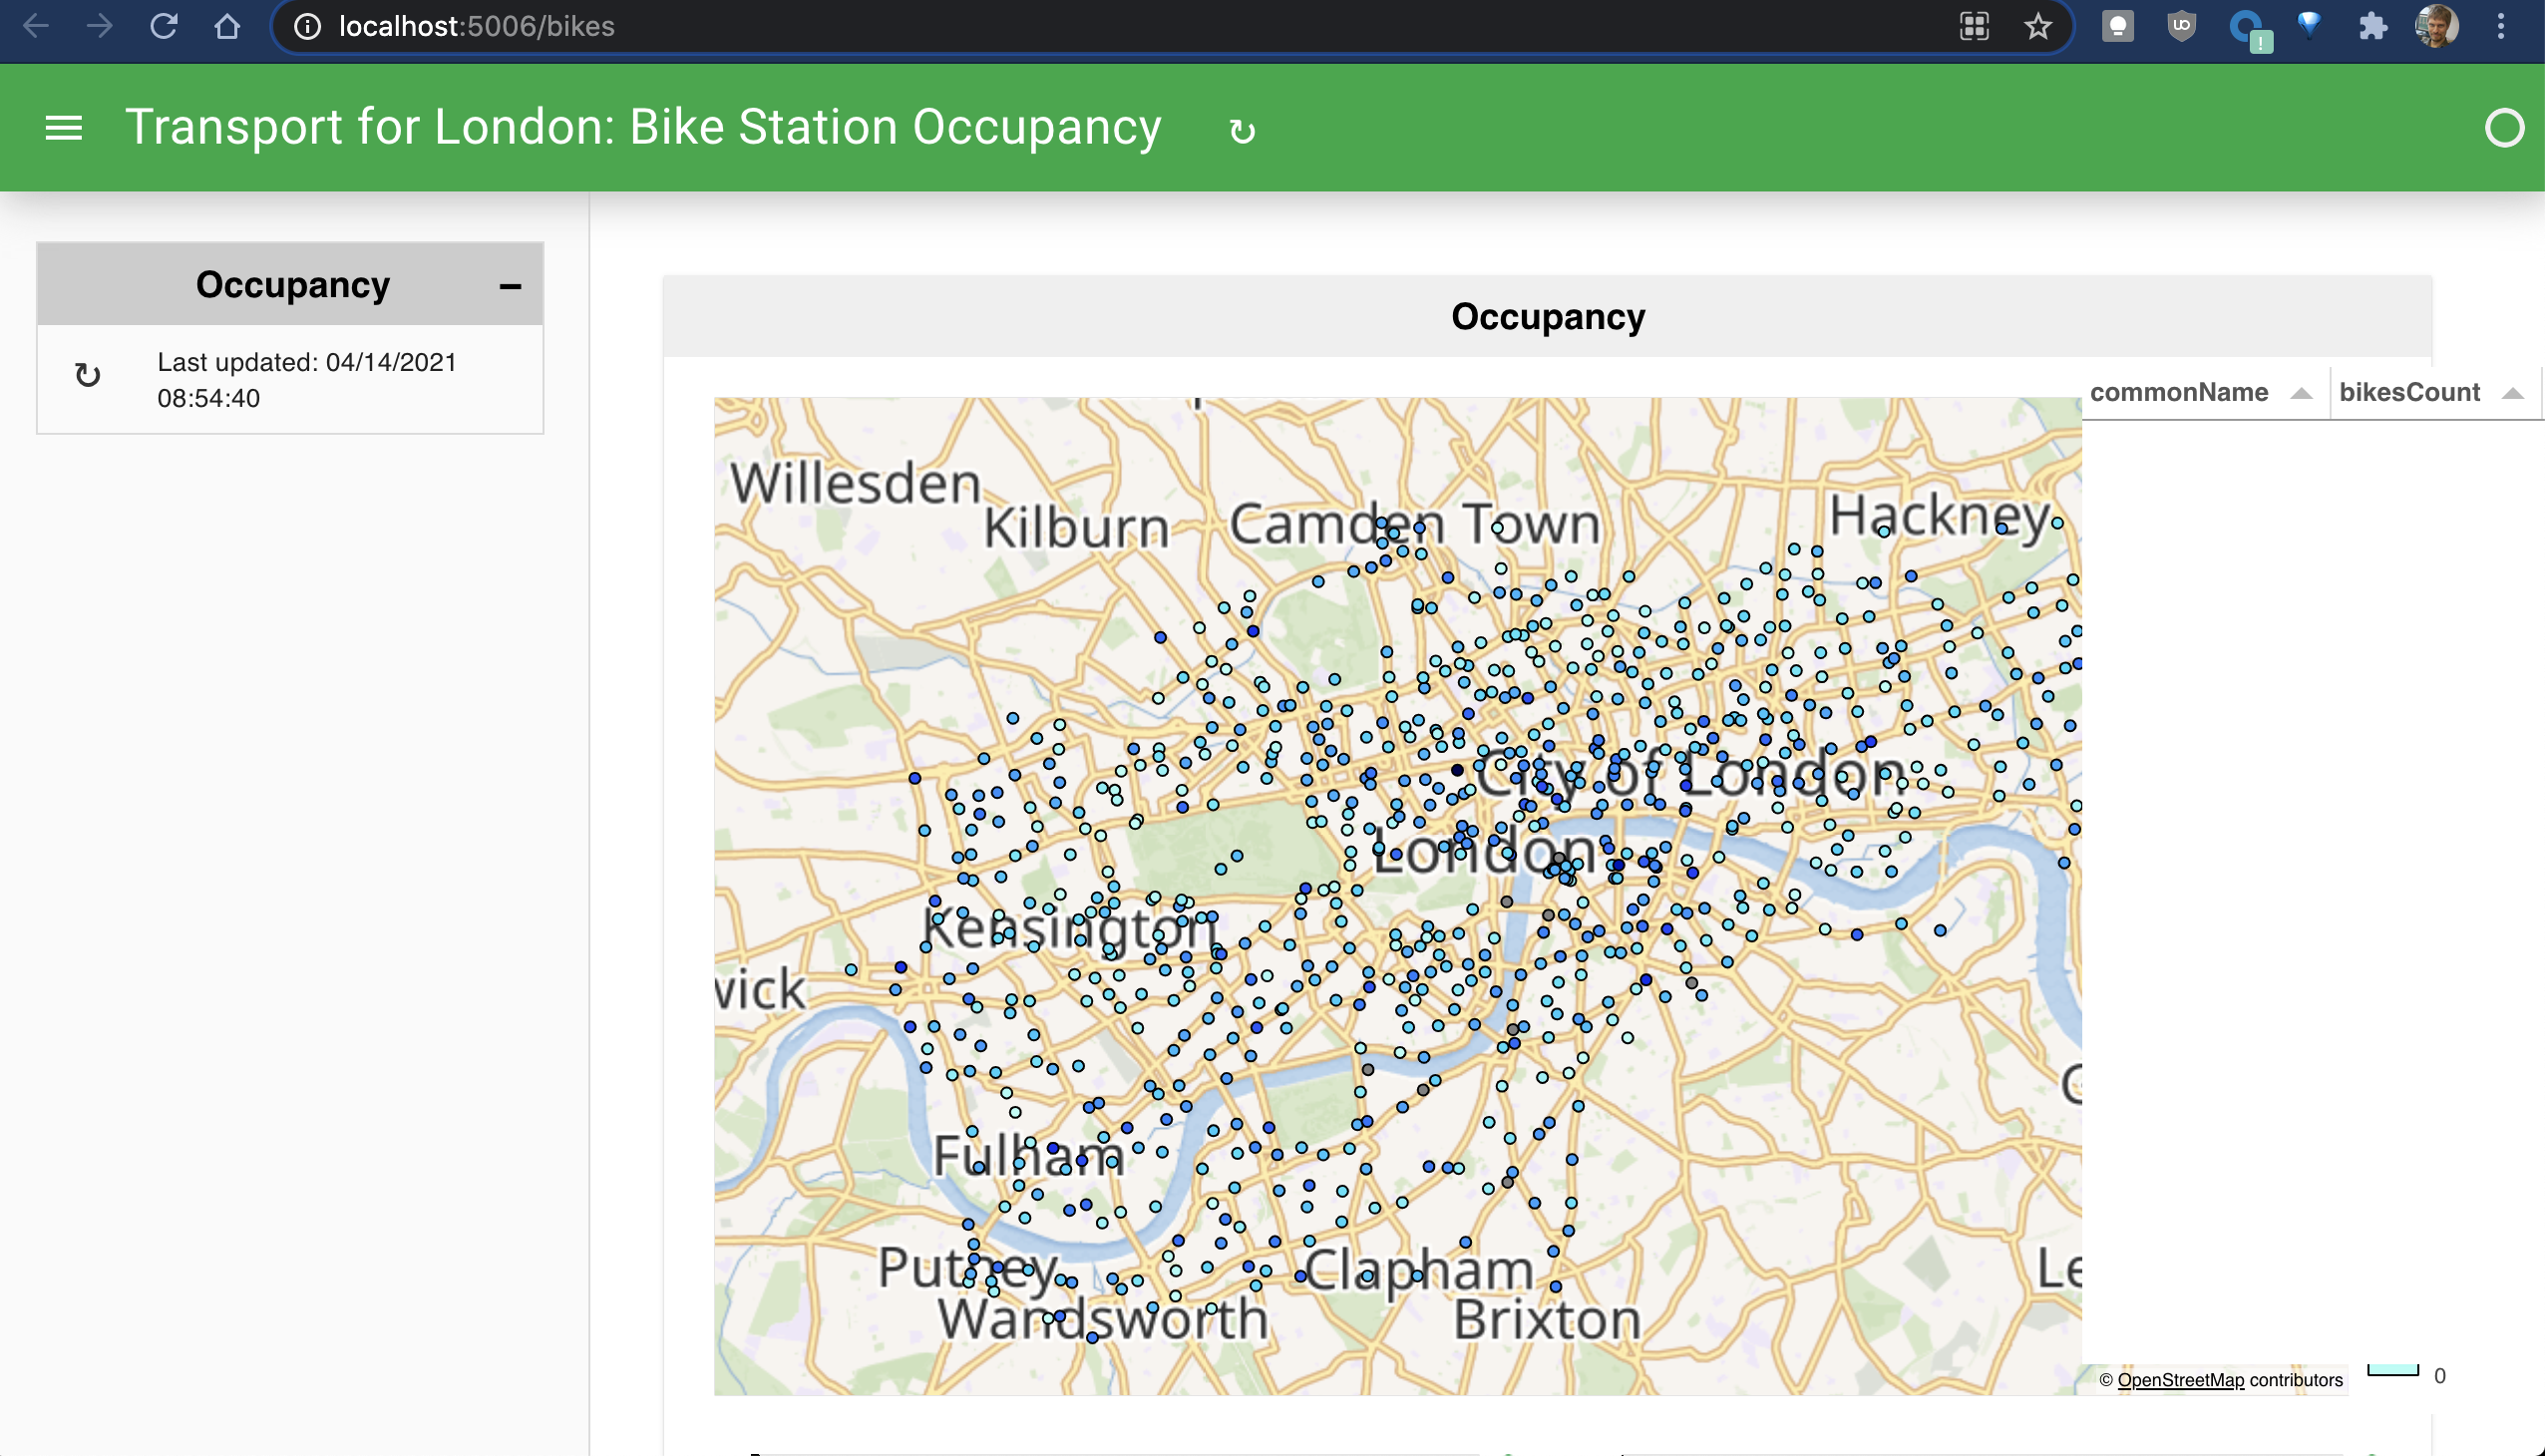
For lumen master, the bike example is not initially usable on my monitor:

image

If I reduce the magnification to 67% I can get it to display properly where I can access the Bokeh toolbar of the main plot, enable box select, and then select something to show the table. I can then also see the histograms not visible above. Fixes I'd suggest:

  • Better responsive layout so that the toolbar is never overwritten, and so that on a normal laptop the histograms are visible initially
  • Include instructive text (here and in other examples) telling users what to select and click on
  • Activate box select by default if that's what the user is meant to use on this plot

Conda install dependencies incomplete

Looks like a really cool project! Not a huge deal, but I think the conda recipe is missing a few required packages that are needed to run the Palmer Penguins example dashboard. I haven't tested it for the other examples.

ALL software version info

I'm doing this on a mac using conda and mamba (I tried with conda after it didn't work with mamba).

$ mamba --version
mamba 0.3.7
conda 4.8.3

Description of expected behavior and the observed behavior

I'd expect that I could create a new conda environment with only python 3 installed, run conda install -c pyviz lumen and then run one of the example dashboards with lumen serve dashboard.yaml --show. When I do that it starts to serve the dashboard but I get errors regarding missing packages and the dashboard doesn't load (though it opens a new browser tab).

Complete, minimal, self-contained example code that reproduces the issue

I'm using the penguins dashboard.yml file.

Here's the environment.yml file I expect to work.

name: lumen
channels:
  - pyviz
  - conda-forge
dependencies:
  - python=3.8
  - lumen

I then run the following:

mamba env create --file environment.yml
conda activate lumen
lumen serve dashboard.yaml --show

Stack traceback and/or browser JavaScript console output

Error running application handler <lumen.command.YamlHandler object at 0x7fc7575667f0>: No module named 'hvplot'
File "base.py", line 366, in __init__:
import hvplot.pandas # noqa Traceback (most recent call last):
  File "/Users/msterling/miniconda3/envs/lumen/lib/python3.8/site-packages/bokeh/application/handlers/code_runner.py", line 197, in run
    exec(self._code, module.__dict__)
  File "dashboard.yaml", line 1, in <module>
    config:
  File "/Users/msterling/miniconda3/envs/lumen/lib/python3.8/site-packages/lumen/dashboard.py", line 166, in __init__
    self._materialize_specification()
  File "/Users/msterling/miniconda3/envs/lumen/lib/python3.8/site-packages/lumen/dashboard.py", line 245, in _materialize_specification
    self.targets[:] = [
  File "/Users/msterling/miniconda3/envs/lumen/lib/python3.8/site-packages/lumen/dashboard.py", line 246, in <listcomp>
    Target.from_spec(
  File "/Users/msterling/miniconda3/envs/lumen/lib/python3.8/site-packages/lumen/target.py", line 391, in from_spec
    return cls(filters=filters, source=source, **params)
  File "/Users/msterling/miniconda3/envs/lumen/lib/python3.8/site-packages/lumen/target.py", line 129, in __init__
    self._update_views()
  File "/Users/msterling/miniconda3/envs/lumen/lib/python3.8/site-packages/lumen/target.py", line 261, in _update_views
    key, card = self._get_card(
  File "/Users/msterling/miniconda3/envs/lumen/lib/python3.8/site-packages/lumen/target.py", line 195, in _get_card
    card, views = None, self._materialize_views(view_filters)
  File "/Users/msterling/miniconda3/envs/lumen/lib/python3.8/site-packages/lumen/target.py", line 176, in _materialize_views
    view = View.from_spec(view_spec, self.source, filters)
  File "/Users/msterling/miniconda3/envs/lumen/lib/python3.8/site-packages/lumen/views/base.py", line 143, in from_spec
    view = view_type(
  File "/Users/msterling/miniconda3/envs/lumen/lib/python3.8/site-packages/lumen/views/base.py", line 366, in __init__
    import hvplot.pandas # noqa
ModuleNotFoundError: No module named 'hvplot'

Solution

After some trial and error, it works fine if I include dask, aiohttp, pyarrow, and hvplot explicitly.

Here's a working environment file.

name: lumen
channels:
  - pyviz
  - conda-forge
dependencies:
  - python=3.8
  - lumen
  - dask
  - aiohttp
  - pyarrow
  - hvplot

Remove GeoViews requirement for the bikes example

The London Bike Points example currently fails to render if GeoViews is not installed. Compared to the other dependencies, GeoViews is very difficult to install, and indeed when I tried adding GeoViews on Wednesday after installing a minimal py38 environment for running the other examples, conda failed to solve at all. I would think we could easily add a transform step calling hv.util.lon_lat_to_easting_northing on the data, at which point it would no longer need GeoViews at all.

date as widget filter : datetime fomat from schema is not recognized properly

When we use filter widget with date as field, the format property in schema dict is 'datetime'.

This is not recognized under the _string_type method. The 2 format option is 'date" or 'date-time' but there is not 'datetime' as possible format option.

Then, the method does also not find 'inclusiveMinimum' and 'inclusiveMaximum' property to set the range.

Gracefully Handle Multiple Extensions or Assert an Error Message

If different views are used (for example Perspective with Holoviews), the dashboard doesnโ€™t build, as two separate extensions are needed.

It would be nice if the various extensions could be gracefully handled, if not an assertion error on crossing multiple extensions would be nice for users to understand the error instead of the dashboard not displaying anything.

Filters first appeared as shared while they should not

Create some data with:

import pandas as pd
import numpy as np
SIZE = 1000
df = pd.DataFrame(
    {
        'd': np.arange(SIZE),
        'x': np.random.choice(list('abc'), size=SIZE),
        'y': np.random.choice(list('def'), size=SIZE),
        'z': np.random.choice(list('ghi'), size=SIZE),
        'v': np.random.random(size=SIZE)
    }
)
df.to_csv('data.csv', index=False)

And run this app:

config:
  title: Palmer Penguins
  theme: dark
  layout: tabs
defaults:
  filters:
    - type: widget
      multi: false
      empty_select: false
sources:
  revenue:
    type: file
    tables:
      revenue: data.csv
    filters:
      xf:
        type: widget
        field: x
        shared: false
        default: a
      yf:
        type: widget
        field: y
        shared: false
        default: d
      zf:
        type: widget
        field: z
        shared: false
        default: g
targets:
  - title: X
    source: revenue
    filters:
      - yf
      - zf
    views:
      scatter:
        type: hvplot
        table: revenue
        kind: scatter
        x: d
        y: v
        color: x
        width: 350
        height: 350
  - title: Y
    source: revenue
    filters:
      - xf
      - zf
    views:
      scatter:
        type: hvplot
        table: revenue
        kind: scatter
        x: d
        y: v
        color: y
        width: 350
        height: 350
  - title: Z
    source: revenue
    filters:
      - xf
      - yf
    views:
      scatter:
        type: hvplot
        table: revenue
        kind: scatter
        x: d
        y: v
        color: z
        width: 350
        height: 350
    sizing_mode: stretch_width

The three filters xh, yf and zf are declared are not shared, but when the app is launched yf and zf show up as shared.
image

It's only after clicking on the Y and Z tabs that the app filters get updated and stop showing up as shared.
image

API consistency

Right now, I think the following classes form the main API for this project (version A):

  1. QueryAdaptor : source of data from things you are monitoring
  2. MetricView : visual representation of data obtained from 1.
  3. Filter : filter used by 1. either before requesting data or to filter after data is returned
  4. Transform: transform for data obtained from 1 before display by 2.

I think we should consider all of these classes together to make sure that they form a coherent and consistent set of concepts for users to work with.

As a start, I think QueryAdaptor seems overly specific, plus the rest of the API is not about queries, it's about metrics. A QueryAdaptor really seems like a source of metric values, i.e. a MetricSource, leading to version B:

  1. MetricSource
  2. MetricView
  3. Filter
  4. Transform

But all of these are related to metrics in some way, so we could focus on metrics throughout (and rename the project MetricSystem :-), version C):

  1. MetricSource
  2. MetricView
  3. MetricFilter
  4. MetricTransform

But that seems pretty verbose, and I'm not sure "Metric" really adds much to any of them, leading to version D:

  1. Source
  2. View
  3. Filter
  4. Transform

My own vote is probably for D, typically qualified as lumen.Source, lumen.View, etc. Any other votes or suggestions?

Add ability to template variables

Lumen yaml specifications should provide the ability to supply arguments which are templated into the yaml file on the commandline. This is particularly important for passwords or other information which should not be stored in the yaml, e.g.

config:
  title: "AE5 Monitor"
  ncols: 3
targets:
  - title: PyViz
    source:
        type: join
        sources:
          ae5:
            type: ae5
            url: pyviz.demo.anaconda.com
            kubernetes_api: https://kube-control.pyviz.demo.anaconda.com
            username: anaconda-enterprise
            password: {ae5_password}

Should allow something like:

lumen serve dashboard.yaml --ae5_password ...

or:

lumen serve dashboard.yaml --template-vars="{'ae5_password': ...}"

Spinner should stop when an error is encountered

I love the new automatic loading indicator on startup, but when there is an error in the .yml, it just spins away like:

image

Here I edited the penguins URL to make it point to a non-existent file, and got no feedback that there was an error until I checked my command-line terminal. A spinner is useful to the extent that it accurately conveys the state of the app, which in this case is an error; can it switch to an error indicator (a red exclamation point?) if the app raises an exception? Or at least stop spinning?

Native control UI element for enum/selector

Thanks for contacting us! Please read and follow these instructions carefully, then delete this introductory text to keep your issue easy to read. Note that the issue tracker is NOT the place for usage questions and technical assistance; post those at Discourse instead. Issues without the required information below may be closed immediately.

Describe the solution you'd like

a dropdown interface for a control related to a enumerated type field.

Describe alternatives you've considered

Using a string control and typing the desired var exactly (bad UI)

Display selected custom view parameters as widgets

This issue summarizes some discussion I've had with @philippjfr and @jbednar about how best to generate widgets for custom view parameters. Here are the three options we talked about:

  1. Use param precedence according to the usual panel semantics when converting parameters to widgets.
  2. Declaring constant=True for the parameters that shouldn't be shown as widgets.
  3. Explicitly list which parameters should become widgets (by name) in the yaml declaration.

Personally, I like option 3 the most as it is the most explicit and lets you easily set the widget order in the yaml. Then I like option 1 as it is consistent with how panel displays widgets for parameters and I like option 3 the least.

Improve programmatic API on Lumen components

Lumen is currently designed as a fairly monolithic system where you define your Yaml and get out a fully formed dashboard. To follow the unofficial mantra of HoloViz "shortcuts not deadends" Lumen therefore still has some ways to go. In particular there are a few usecases where it could be improved, specifically we want to allow users to easily access and reuse components they have defined as part of a Lumen dashboard either to lay them out manually using Panel or even just to access the generated views or data. To achieve this there's a few different avenues we could go down.

Improving the API for accessing components

Right now a Lumen Dashboard basically consists of a nested set of classes, e.g. in most cases you have a Dashboard of Target instances each containing a set of View instances. To get down to accessing a View is somewhat cumbersome and in some cases even requires accessing private APIs.

Instead we should think about offering public APIs for accessing and querying different components and their data.

Improving the API for constructing components

To define a Lumen Dashboard requires a nested specification of targets, views, filters and sources sometimes with circular references which is difficult to set up. In a yaml spec we can handle much of the complexity and circularity behind the scenes but if we want to allow users to programmatically construct components we will have to offer some simpler APIs.

Simplify look of Cards inside tabs

Currently Lumen uses Card layouts representing each target (or rather each facet of a target). This is generally quite nice but when placing the cards in tabs it's visually busy because the target title duplicates the tab title. We should figure out if there's a cleaner approach here.

Hanging loading spinner on a custom view that doesn't implement `_get_params`

To implement a custom view one should implement the get_panel method that returns a Panel object. In order to avoid rebuilding the whole Panel object/view on every update/render one can implement the private method _get_params that should return a dictionary of Parameter values that are used to update the Panel object when need be (with something like panel_obj.param.set_param(**params)). When _get_params isn't implemented, the custom view inherits from the base _get_params method that simply returns None to signal that this way of updating an existing Panel object isn't available.

When _get_params isn't implemented a filter change effectively triggers a full update of the view, but also adds a loading spinner (via Dashboard._set_loading) on the view that is never deactivated and so prevents any further action on the view.

Autogenerate anaconda-project.yaml

Lumen is very easy to run, requiring only a dashboard.yaml to serve the monitoring application. The core of lumen can be quickly conda installed but there are many possibly optional dependencies required for specialized data sources.

One idea to make lumen even easier to run would be to generate an anaconda-project.yaml allowing you to simply run anaconda-project run dashboard with anaconda-project. This could check the dashboard.yaml for the sources used and use that list to specify the required packages for anaconda-project to fetch.

Unable to launch penguin example: `__init__() got an unexpected keyword argument 'arg'`

ALL software version info

https://gist.github.com/tomascsantos/593d449dd5d4c8a3094b730eef46fa26

Description of expected behavior and the observed behavior

Tried to follow getting started instructions, was unable to launch penguins example.

Complete, minimal, self-contained example code that reproduces the issue

Screen Shot 2022-06-14 at 11 35 56 AM

I copied dashboard.yaml from penguins directory in github. I'm probably doing something silly but not sure what it could be :/

lumen categorie in discourse

hi, first, thanks for all your work guys!
I am verry exiting about Lumen and itยดs potential.
I would try to work with but I need some help.

When do you open the new categorie in discourse?

My first attempt with Lumen was to create a yalm specification for Dashbord but with no luck. I may missed something about the yalm file cause "targets" wasnot parsed as expected in the init method of Dashboard class.

It will be helpfull if you give an exemple working file in the doc .

Name for this project

This project needs a name! It's currently called monitor, which is inoffensive and accurate; it is a tool for monitoring stuff. But monitor is obviously not unique or searchable, so it's not ideal as a name. Brainstorming some other possibilities:

  • variants of monitor

    • x Panel Monitor (accurate, in that it's a monitor that is based on Panel and also monitors Panel, but still unsearchable)
    • x HoloViz Monitor (searchable, but not particularly accurate; it does use some HoloViz tools, but it sounds like it's for monitoring HoloViz, while really it can monitor anything)
    • x Monitr (accurate and searchable, but sounds like R rather than Python)
    • x Monit (already in PyPI)
    • Onit (from monitor, and also a play on "keep an eye on it")
  • watching

    • x watcher (already used in a technical sense in Param; already in PyPI)
    • x watchman (sexist?; already in PyPI)
    • x spotter (already in PyPI
    • x lookout (already in PyPI)
    • watchkeeper
  • supervising

    • x supervisor (used a lot in programming already; already in PyPI)
    • x overseer (has slavery connotations; already in PyPI)
    • x warden (has prison connotations; already in PyPI)
    • x overlord (a bit much!; already in PyPI)
  • surveying

    • x surveyor (already in PyPI)
    • x overviewer
    • x overview
    • x overviews (resonates with holoviews?)
  • caretaking

    • x steward (already in PyPI)
    • x caretaker
    • x attendant
    • x tabwatcher
    • _ tabkeeper
  • childcare

    • x nanny (already in PyPI)
    • x daycare (already in PyPI)
    • x poppins (as in Mary)
    • x nanna (as in Peter Pan)
  • animals (synergizing with Python?)

    • x canary (as in a coal mine; already in PyPI)
    • x eagle (as in eagle eyed; already in PyPI)
    • x hawk (as in watching like a hawk; already in PyPI)
    • x watchdog (already in PyPI)
  • servers/apps

    • x restmonitor
    • x servemonitor
    • _ appmonitor

Anyone have other suggestions?

Spatial filter from map tools

For now filterWidget works well with fields values.
I suggest to go throught filtering sources by spatial query.
For example, when a source is a geodataframe we might draw polygon on a small map that can perform a spatial intersect on the source.
For exemple we should declare on the spec โ€™s filter section something like this:

Filters:
- type : spatial
  method : intersect / contain
  opposit : False 
  tools : [box, tap, lasso,  line?]
  buffer : 
     distance : 10 
     unit : meters / miles /  nautic_mile / decimal_degres
  tile : EsriImagery
  Epsg : 3857
  InitialExtent: from_source / [bbox] / global

Methods could be inspired by that reference
Obviously, lumen should depends on spatial libs like cartopy, geoviews and geopandas or spatialpandas...

Add GridSpec support to arrange targets in dashboard layout

Dashboard would be nicer if we can arrange position of Targets in a GridSpec

For the moment, we can't make a target twice bigger than 2 other.

Solution

I would have the possibility to specify position and size of targets

Alternative

GridBox, Column and Row can't set size

How it could be done

Target should have a new property 'position'
which it could be set like this for 2 targets. the first is twice bigger:

targets:
  - title: Rรฉpartition spatiale
    position: [':','0:2']
   ...
  - title: Nombre de requettes    
    layout: column
    nbcols: 1    
    position: [0,2]
   ...

Quotation marks are necessary around colon because it's a yaml specifier. There are not necessary if there is no comma.

here the result should give the picture above. Note that the second target has 3 views in column layout.
image

or another exemple with 3 targets :

image

So to do that we should interpret position with in the main rendering method of dashboard with something like this :

            if isinstance(self._main, pn.GridSpec):
                panel_generator = (target for target in self.targets)
                for idx, target in enumerate(panel_generator):
                    l = []
                    for idx, i in enumerate(target.position):
                        if isinstance(i, int):
                            l.insert(idx, i)
                        if isinstance(i, str):
                            c = i.split(':')
                            if c[0] != '':
                                start = int(c[0])
                            else:
                                start = 0
                            if c[1] != '':
                                end = int(c[1])
                            else:
                                end = None
                            l.insert(idx, slice(start,end))
                    self._main[(l[0], l[1])] = target.panels
            else:
                self._main[:] = [target.panels for target in self.targets]

I can make a PR with this code that seem to work for my need.

It's maybe a first step to make ReactTemplate works ;)

DOCS: ANSI color codes in html pages (not rendered)

Some pages in the documentation have ANSI color codes instead of <span> tags.

Example page:
https://lumen.holoviz.org/architecture/source.html

HTML code excerpt from https://github.com/holoviz/lumen/blob/gh-pages/architecture/source.html
(starting at line 191):

๏ฟฝ[1;31mParameters changed from their default values are marked in red.๏ฟฝ[0m
๏ฟฝ[1;36mSoft bound values are marked in cyan.๏ฟฝ[0m
C/V= Constant/Variable, RO/RW = ReadOnly/ReadWrite, AN=Allow None</p>
<p>๏ฟฝ[1;34mName        Value    Type   Bounds    Mode  ๏ฟฝ[0m</p>
<p>cache_dir    None   String          V RW AN
shared      False  Boolean  (0, 1)    V RW</p>
<p>๏ฟฝ[1;32mParameter docstrings:
=====================๏ฟฝ[0m</p>
<p>๏ฟฝ[1;34mcache_dir: Whether to enable local cache and write file to disk.๏ฟฝ[0m
๏ฟฝ[1;31mshared:    Whether the Source can be shared across all instances of the๏ฟฝ[0m
๏ฟฝ[1;31m           dashboard. If set to <cite>True</cite> the Source will be loaded on๏ฟฝ[0m
๏ฟฝ[1;31m           initial server load.๏ฟฝ[0m</p>

Select widget filter accepts a default value that is not part of the options

The following filter's spec, defined in the source spec, doesn't raise any error even if the default isn't part of the options (obtained from the schema).

    filters:
      species:
        type: widget
        field: species
        multi: false
        default: bad

Before any value is selected in the UI, the filter has a value='bad' and the widget has a correct value (i.e. one part of its options).

This is ultimately down to panel, where the Select widget doesn't raise any error if one tries to set a value not part of the options.

import panel as pn
from panel.widgets import Select
s = Select(value='b', options=['a', 'b'])
print(s.value)  # 'b'
s.value = 'c'
print(s.value)  # 'a'

Instead panel just sets the first the new value to the first option available (https://github.com/holoviz/panel/blob/master/panel/widgets/select.py#L73).

@philippjfr why does panel have this behavior? I'd expect an error to be raised (as with param.Selector) but maybe there's a good reason for not following param here.

Enable Functionality to Auto Update Cached Data

When you serve a dashboard using lumen serve dashboard.yml --warm and the following source configuration:

sources:
  dremio:
    type: intake
    shared: true
    cache_dir: cache
    uri: catalog.yml

The data is cached in a cache directory on the first instantiation of the dashboard. When you resolve the DNS in subsequent visits, the data then is pulled directly from the cache directory, and not updated. The only way to update the data in the cache, is to click the icon to refresh the data.

The to-be feature request would be to enable a process to run autonomously to pull in new data at a defined interval.

For example in the dashboard.yaml:

sources:
  dremio:
    type: intake
    shared: true
    cache_dir: cache
    cache_refresh: 1h
    uri: catalog.yml

streamz??

I'm sure we talked about this already, but it came up while chatting with @seibert .

In this library, you have data sources which poll a REST endpoint on some regular period, accumulate data, turn into dataframes, do some processing, and finally update a plot in the frontend (some part of a dashboard). Streamz does all of these things, including the ability to create multiple different views of the same dataset on one or more plots. Why not use streamz?

Would it make any difference if Intake already supported streamz? This is something I have long been meaning to do, but just needed the spur ( https://github.com/intake/intake-streamz very incomplete).

Error raised with the penguins example

Some combinations of filters, e.g. ({'species': ['Gentoo'], 'Island': ['Torgersen'], sex: []}), leads to the following error being raised:

2021-10-01 01:00:30,708 Exception in callback functools.partial(<bound method IOLoop._discard_future_result of <tornado.platform.asyncio.AsyncIOMainLoop object at 0x7fd118426bd0>>, <Task finished coro=<_needs_document_lock.<locals>._needs_document_lock_wrapper() done, defined at /Users/mliquet/miniconda3/envs/lumen-dev37/lib/python3.7/site-packages/bokeh/server/session.py:51> exception=AttributeError("'int' object has no attribute 'dtype'")>)
Traceback (most recent call last):
  File "/Users/mliquet/miniconda3/envs/lumen-dev37/lib/python3.7/site-packages/tornado/ioloop.py", line 741, in _run_callback
    ret = callback()
  File "/Users/mliquet/miniconda3/envs/lumen-dev37/lib/python3.7/site-packages/tornado/ioloop.py", line 765, in _discard_future_result
    future.result()
  File "/Users/mliquet/miniconda3/envs/lumen-dev37/lib/python3.7/site-packages/bokeh/server/session.py", line 71, in _needs_document_lock_wrapper
    result = await result
  File "/Users/mliquet/miniconda3/envs/lumen-dev37/lib/python3.7/site-packages/tornado/gen.py", line 216, in wrapper
    result = ctx_run(func, *args, **kwargs)
  File "/Users/mliquet/miniconda3/envs/lumen-dev37/lib/python3.7/site-packages/panel/reactive.py", line 278, in _change_coroutine
    self._change_event(doc)
  File "/Users/mliquet/miniconda3/envs/lumen-dev37/lib/python3.7/site-packages/panel/reactive.py", line 288, in _change_event
    self._process_events(events)
  File "/Users/mliquet/miniconda3/envs/lumen-dev37/lib/python3.7/site-packages/panel/reactive.py", line 262, in _process_events
    self.param.set_param(**self_events)
  File "/Users/mliquet/miniconda3/envs/lumen-dev37/lib/python3.7/site-packages/param/parameterized.py", line 1526, in set_param
    self_._batch_call_watchers()
  File "/Users/mliquet/miniconda3/envs/lumen-dev37/lib/python3.7/site-packages/param/parameterized.py", line 1665, in _batch_call_watchers
    self_._execute_watcher(watcher, events)
  File "/Users/mliquet/miniconda3/envs/lumen-dev37/lib/python3.7/site-packages/param/parameterized.py", line 1627, in _execute_watcher
    watcher.fn(*args, **kwargs)
  File "/Users/mliquet/miniconda3/envs/lumen-dev37/lib/python3.7/site-packages/panel/reactive.py", line 394, in reverse_link
    setattr(self, reverse_links[event.name], event.new)
  File "/Users/mliquet/miniconda3/envs/lumen-dev37/lib/python3.7/site-packages/param/parameterized.py", line 316, in _f
    instance_param.__set__(obj, val)
  File "/Users/mliquet/miniconda3/envs/lumen-dev37/lib/python3.7/site-packages/param/parameterized.py", line 318, in _f
    return f(self, obj, val)
  File "/Users/mliquet/miniconda3/envs/lumen-dev37/lib/python3.7/site-packages/param/parameterized.py", line 984, in __set__
    obj.param._call_watcher(watcher, event)
  File "/Users/mliquet/miniconda3/envs/lumen-dev37/lib/python3.7/site-packages/param/parameterized.py", line 1645, in _call_watcher
    self_._execute_watcher(watcher, (event,))
  File "/Users/mliquet/miniconda3/envs/lumen-dev37/lib/python3.7/site-packages/param/parameterized.py", line 1627, in _execute_watcher
    watcher.fn(*args, **kwargs)
  File "/Users/mliquet/miniconda3/envs/lumen-dev37/lib/python3.7/site-packages/panel/reactive.py", line 379, in link
    setattr(target, links[event.name], event.new)
  File "/Users/mliquet/miniconda3/envs/lumen-dev37/lib/python3.7/site-packages/param/parameterized.py", line 318, in _f
    return f(self, obj, val)
  File "/Users/mliquet/miniconda3/envs/lumen-dev37/lib/python3.7/site-packages/param/parameterized.py", line 984, in __set__
    obj.param._call_watcher(watcher, event)
  File "/Users/mliquet/miniconda3/envs/lumen-dev37/lib/python3.7/site-packages/param/parameterized.py", line 1645, in _call_watcher
    self_._execute_watcher(watcher, (event,))
  File "/Users/mliquet/miniconda3/envs/lumen-dev37/lib/python3.7/site-packages/param/parameterized.py", line 1627, in _execute_watcher
    watcher.fn(*args, **kwargs)
  File "/Users/mliquet/WORK/DEV/lumen/lumen/target.py", line 434, in _rerender
    self._update_views(invalidate_cache, update_views, events=events)
  File "/Users/mliquet/WORK/DEV/lumen/lumen/target.py", line 402, in _update_views
    events=events
  File "/Users/mliquet/WORK/DEV/lumen/lumen/target.py", line 325, in _get_card
    view_stale = view.update(*events, invalidate_cache=invalidate_cache)
  File "/Users/mliquet/WORK/DEV/lumen/lumen/views/base.py", line 506, in update
    return self._update_panel()
  File "/Users/mliquet/WORK/DEV/lumen/lumen/views/base.py", line 196, in _update_panel
    self._updates = self._get_params()
  File "/Users/mliquet/WORK/DEV/lumen/lumen/views/base.py", line 474, in _get_params
    return dict(object=self.get_plot(df))
  File "/Users/mliquet/WORK/DEV/lumen/lumen/views/base.py", line 437, in get_plot
    kind=self.kind, x=self.x, y=self.y, **processed
  File "/Users/mliquet/miniconda3/envs/lumen-dev37/lib/python3.7/site-packages/hvplot/plotting/core.py", line 79, in __call__
    return self._get_converter(x, y, kind, **kwds)(kind, x, y)
  File "/Users/mliquet/miniconda3/envs/lumen-dev37/lib/python3.7/site-packages/hvplot/plotting/core.py", line 87, in _get_converter
    self._data, x, y, kind=kind, **params
  File "/Users/mliquet/miniconda3/envs/lumen-dev37/lib/python3.7/site-packages/hvplot/converter.py", line 506, in __init__
    symmetric = self._process_symmetric(symmetric, clim, check_symmetric_max)
  File "/Users/mliquet/miniconda3/envs/lumen-dev37/lib/python3.7/site-packages/hvplot/converter.py", line 561, in _process_symmetric
    cmin = np.nanquantile(data, 0.05)
  File "<__array_function__ internals>", line 6, in nanquantile
  File "/Users/mliquet/miniconda3/envs/lumen-dev37/lib/python3.7/site-packages/numpy/lib/nanfunctions.py", line 1357, in nanquantile
    a, q, axis, out, overwrite_input, interpolation, keepdims)
  File "/Users/mliquet/miniconda3/envs/lumen-dev37/lib/python3.7/site-packages/numpy/lib/nanfunctions.py", line 1366, in _nanquantile_unchecked
    return np.nanmean(a, axis, out=out, keepdims=keepdims)
  File "<__array_function__ internals>", line 6, in nanmean
  File "/Users/mliquet/miniconda3/envs/lumen-dev37/lib/python3.7/site-packages/numpy/lib/nanfunctions.py", line 950, in nanmean
    avg = _divide_by_count(tot, cnt, out=out)
  File "/Users/mliquet/miniconda3/envs/lumen-dev37/lib/python3.7/site-packages/numpy/lib/nanfunctions.py", line 217, in _divide_by_count
    return a.dtype.type(a / b)
AttributeError: 'int' object has no attribute 'dtype'

The app is still running but fails at updating the plots for that combination of filters. What happened is that in that case the filtered dataframe is empty (there are no Gentoo penguins from the Torgersen island apparently in the dataset). df.hvplot() of that data seems to fail because color is specified, indeed, the dashboard is set to group the data by species in the scatter plot.

I'm opening this issue specifically here since running directly the following snippet in a notebook just raises a warning and displays an empty plot (with a colormap).

import pandas as pd
import hvplot.pandas

df = pd.DataFrame({'x': [], 'y': [], 'color': []})
df.hvplot(kind='scatter', x='x', y='y', color='color')

Emits this warning:

/Users/mliquet/miniconda3/envs/lumen-dev37/lib/python3.7/site-packages/numpy/lib/nanfunctions.py:1366: RuntimeWarning: Mean of empty slice
  return np.nanmean(a, axis, out=out, keepdims=keepdims)

An issue could probably be opened in hvplot too.

Conditional system with notifications

Based on discussion summarized in holoviz-topics/examples#124 @jbednar @philippjfr and I came up with some thoughts about a conditional system for lumen.

The idea is to trigger certain events when column values satisfy specific conditions. A typical example would be to check whether values fall within a certain range. If this condition is satisfied, you may what to style those values differently (e.g change text weight, fontsize, color or any other visual cue) or take some other action such as issuing a notification. When conditions are met, you may want to send out e-mail alerts for instance.

One thought is that each condition defines a named label which can then be referenced to specify the action to take when the label is active (i.e the predicate is true). This would decouple the definition of the predicate from what needs to be done when a predicate applies (style things differently, send out e-mail notifications etc).

Open questions:

  • Language to specify the predicates in a way that can be specified clearly, unambiguously and declaratively in yaml.
  • How to link these predicates to actions (e.g. arbitrary styling, notifications).
  • Supplying extra arguments e.g. if e-mail notifications are enabled, should they happen immediately, be sent out hourly, daily, weekly etc?

Load source from intake catalog give an error on python >= 3.7 : ValueError("Could not determine catalog to load.")

this error is due to the intake.Catalog method which is deprecated for this use case.
here (intake.init) is the warning :

warnings.warn('deprecation: intake.Catalog now references the base class intake.catalog.base.Catalog\n '
                          'If you want to open a generic URL, you should use intake.open_catalog')

I don't know why but we can't cast Catalog as list :
cats = list(self.cat)
return None

so we should use intake.open_catalog instead that create a YAMLFileCatalog that could be cast as list.

Data Refresh Breaks Layout Styling

When you first load into a Lumen dashboard using a layout configuration for the views, the dashboard maintains the styling of those components.
image

When you click the data refresh button, the layout is ignored and you see the following view:
image
image

Example dashboard.yml configuration.

config:
  title: "Example Dashboard"
sources:
  dremio:
    type: intake
    shared: true
    cache_dir: cache
    uri: catalog.yml
targets:
       
  - title: Stuff
    source: dremio
    views:
      View1:
        table: dremio_vds
        type: trend
        y: y1
      View2:
        table: dremio_vds
        type: trend
        y: y2
      View3:
        table: dremio_vds
        type: trend
        y: y3
      View4:
        table: dremio_vds
        type: trend
        y: y4
      View5:
        table: dremio_vds
        type: heatmap_weekly
      View6:
        table: dremio_vds
        type: thing
        y: y6
        variable: 60

    layout: [["View1", "View2", "View3", "View4"], ["View5", "View6"]]
    sizing_mode: stretch_width

Ensure schema cache gets cleaned up and generally re-envision caching

Currently aSource can be given a cache_dir in the yaml spec:

    cache_dir: ./cache

this enables caching of the data and the computed JSON schema describing the data. Both are stored in the directory and then are used to reload the data (if either --dev or --autoreload are set). It seems in certain cases the data may be refreshed but the schema file is not, which can result in mismatches between the two which can make it appear like certain filter fields are not available (because filters are created from the schema).

It's not entirely clear to me under which condition this can happen, since generally the entire cache_dir is deleted in one go so we'd have to some experimenting here.

Comparison to other monitoring tools

This project is entering a field already crowded with alternative solutions for monitoring. For tools that are competitors or alternative approaches, it's important to clarify how this one differs, so that people can make an informed choice. For other complementary tools, it's important to clarify how they could be used with this one, e.g. by providing data that it can use or interfacing with it in some other way. In part because some projects include both competitive and complementary components, it's not always obvious which of those categories (or some other category) a related tool falls into. It would be great if the docs could clarify these relationships at least as a rough categorization, which I've started as a first pass below. Of course, there are easily hundreds if not thousands of potentially competitive or complementary tools, but hopefully this selection will give the basic idea and make it easier to categorize any new tool you encounter.

As a background for comparison, the tool in this repo is:

  • Python - easily extensible by Python programmers to cover any data source
  • Configurable - Controlled with YAML whose capabilities can be extended in Python
  • Focused on data science artifacts - making it simple to monitor common classes of locally authored servers, such as Python-based dashboards and REST servers
  • General purpose, but focused on higher level needs (not network packets or hardware, but locally maintained apps)
  • Fully open source
  • Locally installed (not a web service)

Competitors/alternatives: (tools providing monitoring and graphing of external data sources)

  • Kibana - specific to Elasticsearch
  • Grafana - not Python-configurable
  • Sentry - web service focused on app monitoring and error reporting
  • glances - lower level
  • graphite/web - hard coded web interface to graphite tool
  • SolarWinds, MRTG, Zabbix, cacti, zenoss and many, many others - mainly IT audience (networks, attached devices, etc.) compared to this tool's data-science audience (less focused on networks, more focused on domain-relevant info that can be extracted from running servers)

Complements: (possible data sources, add-ons, etc.)

Recommend Projects

  • React photo React

    A declarative, efficient, and flexible JavaScript library for building user interfaces.

  • Vue.js photo Vue.js

    ๐Ÿ–– Vue.js is a progressive, incrementally-adoptable JavaScript framework for building UI on the web.

  • Typescript photo Typescript

    TypeScript is a superset of JavaScript that compiles to clean JavaScript output.

  • TensorFlow photo TensorFlow

    An Open Source Machine Learning Framework for Everyone

  • Django photo Django

    The Web framework for perfectionists with deadlines.

  • D3 photo D3

    Bring data to life with SVG, Canvas and HTML. ๐Ÿ“Š๐Ÿ“ˆ๐ŸŽ‰

Recommend Topics

  • javascript

    JavaScript (JS) is a lightweight interpreted programming language with first-class functions.

  • web

    Some thing interesting about web. New door for the world.

  • server

    A server is a program made to process requests and deliver data to clients.

  • Machine learning

    Machine learning is a way of modeling and interpreting data that allows a piece of software to respond intelligently.

  • Game

    Some thing interesting about game, make everyone happy.

Recommend Org

  • Facebook photo Facebook

    We are working to build community through open source technology. NB: members must have two-factor auth.

  • Microsoft photo Microsoft

    Open source projects and samples from Microsoft.

  • Google photo Google

    Google โค๏ธ Open Source for everyone.

  • D3 photo D3

    Data-Driven Documents codes.