There are many ways of measuring batch effect in RNA-seq data, their approaches can generally be divided into 3 steps:
-
Principal Component Analysis (PCA).
Since the number of genes is usually large, we would like to reduce the dimension to ease clustering as well as identifying biological/technical components.
-
Check Batch Clusters.
We want to check whether data points are separated according to batches. Observing clusters specific to one batch indicates high batch effect.
-
(Optional) Check Cell Clusters.
Though we want points in different batches to merge together, we also want cells that are of different cell type to be separated. This makes sure that we are erasing only the technical differences and not the biological differences.
There are several ways of checking/quantifying batch effects:
-
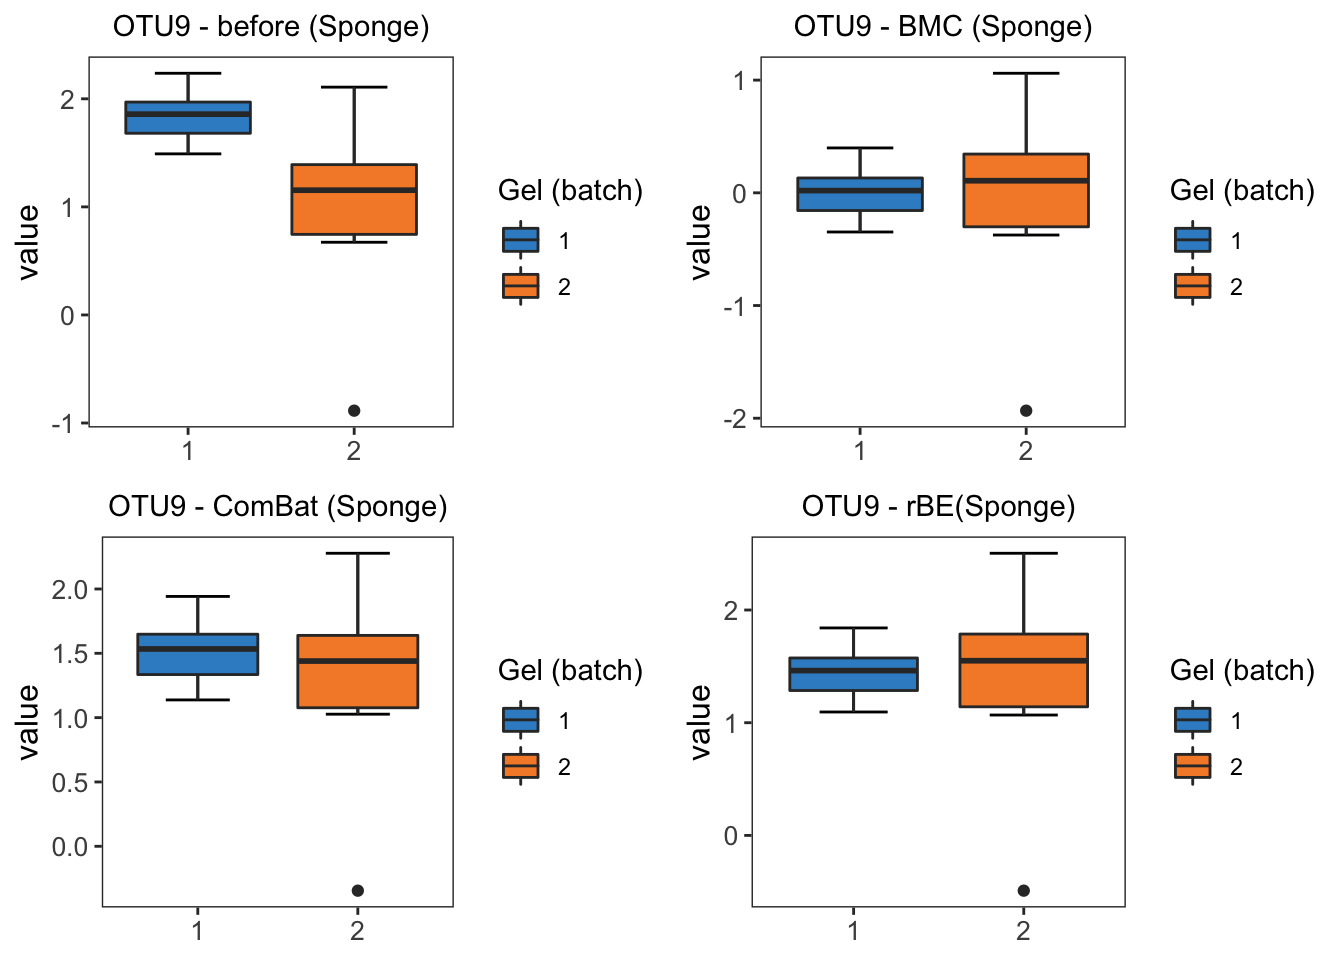
Pair-wise boxplot.
For each principal component, we can plot boxplots of the projections of the data points categorized by batch number (and another categorized by cell type).
Those PCs where the boxplot varies a lot for different batches are considered to be reflecting technical variations.
Pros:
- A good visualization of which principal components are representing biological/techinical variations.
Cons:
- This is only a qualitative identification of batch effects, and there is no way to quantify it (measure the difference in mean/variance, for example).
- Principal components are linear combinations of features which can mix biological and technical variance together.
-
kBET: local-level batch mixing measurement.
After dimension reduction, we sample 10% of the data points. For each point, find the
$k$ -nearest neighbors around it, compute the local distribution of batch label, then compare it with the global distribution. If they are sufficiently different, we conclude a high batch effect.Pros:
- Very sensitive to biases caused by batch effects.
Cons:
-
The result is sensitive to the choice of neighborhood size
$k$ , whose optimal value is not obvious and could be different for different datasets. -
Only considers how well we mix batches together, but didn't consider the cell types. (Is this the case?? Maybe try with some simulated data) This can fail in 2 ways:
-
Imbalanced Batches: If the batches are not balanced, say batch 1 has mostly cell type A, and batch 2 has mostly cell type B. Then even if batch effects are corrected, the 2 batches should not be mixed together. But in this case kBET still gives a bad score (false-negative).
-
Over-correction: I may well map every data point to one same point, ignoring all variations. The local distribution for each data point will of course be the same as global distribution, but this is not a good way of resolving batch effects.
-
-
LISI: Local Inverse Simpson's Index.
For each data point, we choose some nearest neighbors based on local distribution, then compute the inverse Sinpson's index, which is the inverse of number of batch labels (iLISI)/cell types (cLISI) in the neighborhood.
Smaller iLISI and higher cLISI indicates good batch effect removal/cell clustering.
Pros:
- A better way to select the nearest neighbors.
Cons:
- iLISI itself still doesn't take cell type into consideration, so the imbalanced batches problem for kBET still applies for iLISI.
-
ASW: Average Silhouette Width.
For each data point, compute the Silhouette score, which is a
$-1$ to$1$ value indicating how well the data points fits in the current cluster and separates from other clusters. Larger number means better fit.The Silhouette scores are calculated for cell type clusters and batch clusters repectively. Higher ASW for cell type clusters and lower ASW for batch clusters indicate better batch effect removal/cell clustering.
Pros:
- ASW essentially solves the over-correction problem as it also considers distance of a point to neighboring batches, and will correctly identifying this clustering as bad.
Cons:
- The imbalanced batches problem is still not resolved, as ASW score for batch clusters is still low.
-
gPCA: Guided PCA.
To be done.

-
Is PCA good ways for batch effect measurement? What if we try to calculate those metrics using the original (normalized) features?
-
A lot of metrics are examining the local properties of data points, is this appropriate? What if we try to examine the global properties of the data, for example try to fit a distribution of data points, then compare the difference (e.g. KL-divergence) between the distributions?
-
When measuring the batch effect, can we take the proportion of cell type into consideration? Can we calculate the metric for each of the cell types, then merge them together?
[1] Tran, H.T.N., Ang, K.S., Chevrier, M. et al. A benchmark of batch-effect correction methods for single-cell RNA sequencing data. Genome Biol 21, 12 (2020). https://doi.org/10.1186/s13059-019-1850-9
