Coder Social home page Coder Social logo

guptarohit / asciigraph Goto Github PK

View Code? Open in Web Editor NEW
2.5K 30.0 96.0 138 KB

Go package to make lightweight ASCII line graph ╭┈╯ in command line apps with no other dependencies.

Home Page: https://pkg.go.dev/github.com/guptarohit/asciigraph

License: BSD 3-Clause "New" or "Revised" License

Go 99.21% Dockerfile 0.79%
asciigraph graph plot chart ascii-chart line-chart golang go utility command-line

asciigraph's Introduction

asciigraph

Build status Go Report Card Coverage Status GoDoc License Mentioned in Awesome Go

Go package to make lightweight ASCII line graphs ╭┈╯.

image

Installation

go get -u github.com/guptarohit/asciigraph@latest

Usage

Basic graph

package main

import (
    "fmt"
    "github.com/guptarohit/asciigraph"
)

func main() {
    data := []float64{3, 4, 9, 6, 2, 4, 5, 8, 5, 10, 2, 7, 2, 5, 6}
    graph := asciigraph.Plot(data)

    fmt.Println(graph)
}

Running this example would render the following graph:

  10.00 ┤        ╭╮
   9.00 ┤ ╭╮     ││
   8.00 ┤ ││   ╭╮││
   7.00 ┤ ││   ││││╭╮
   6.00 ┤ │╰╮  ││││││ ╭
   5.00 ┤ │ │ ╭╯╰╯│││╭╯
   4.00 ┤╭╯ │╭╯   ││││
   3.00 ┼╯  ││    ││││
   2.00 ┤   ╰╯    ╰╯╰╯

Multiple Series

package main

import (
    "fmt"
    "github.com/guptarohit/asciigraph"
)

func main() {
	data := [][]float64{{0, 1, 2, 3, 3, 3, 2, 0}, {5, 4, 2, 1, 4, 6, 6}}
	graph := asciigraph.PlotMany(data)

	fmt.Println(graph)
}

Running this example would render the following graph:

 6.00 ┤    ╭─
 5.00 ┼╮   │
 4.00 ┤╰╮ ╭╯
 3.00 ┤ │╭│─╮
 2.00 ┤ ╰╮│ ╰╮
 1.00 ┤╭╯╰╯  │
 0.00 ┼╯     ╰

Colored graphs

package main

import (
    "fmt"
    "github.com/guptarohit/asciigraph"
)

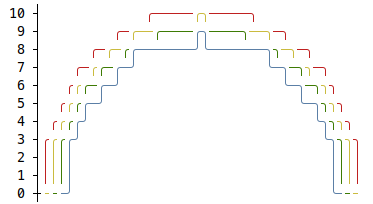
func main() {
	data := make([][]float64, 4)

	for i := 0; i < 4; i++ {
		for x := -20; x <= 20; x++ {
			v := math.NaN()
			if r := 20 - i; x >= -r && x <= r {
				v = math.Sqrt(math.Pow(float64(r), 2)-math.Pow(float64(x), 2)) / 2
			}
			data[i] = append(data[i], v)
		}
	}
	graph := asciigraph.PlotMany(data, asciigraph.Precision(0), asciigraph.SeriesColors(
		asciigraph.Red,
		asciigraph.Yellow,
		asciigraph.Green,
		asciigraph.Blue,
	))

	fmt.Println(graph)
}

Running this example would render the following graph:

colored_graph_image

Legends for colored graphs

The graph can include legends for each series, making it easier to interpret.

package main

import (
	"fmt"
	"github.com/guptarohit/asciigraph"
	"math"
)

func main() {
	data := make([][]float64, 3)
	for i := 0; i < 3; i++ {
		for x := -12; x <= 12; x++ {
			v := math.NaN()
			if r := 12 - i; x >= -r && x <= r {
				v = math.Sqrt(math.Pow(float64(r), 2)-math.Pow(float64(x), 2)) / 2
			}
			data[i] = append(data[i], v)
		}
	}
	graph := asciigraph.PlotMany(data,
		asciigraph.Precision(0),
		asciigraph.SeriesColors(asciigraph.Red, asciigraph.Green, asciigraph.Blue),
		asciigraph.SeriesLegends("Red", "Green", "Blue"),
		asciigraph.Caption("Series with legends"))
	fmt.Println(graph)
}

Running this example would render the following graph:

graph_with_legends_image

CLI Installation

This package also brings a small utility for command line usage.

Assuming $GOPATH/bin is in your $PATH, install CLI with following command:

go install github.com/guptarohit/asciigraph/cmd/asciigraph@latest

or pull Docker image:

docker pull ghcr.io/guptarohit/asciigraph:latest

or download binaries from the releases page.

CLI Usage

> asciigraph --help
Usage of asciigraph:
  asciigraph [options]
Options:
  -ac axis color
    	y-axis color of the plot
  -b buffer
    	data points buffer when realtime graph enabled, default equal to `width`
  -c caption
    	caption for the graph
  -cc caption color
    	caption color of the plot
  -d delimiter
    	data delimiter for splitting data points in the input stream (default ",")
  -f fps
    	set fps to control how frequently graph to be rendered when realtime graph enabled (default 24)
  -h height
    	height in text rows, 0 for auto-scaling
  -lb lower bound
    	lower bound set the minimum value for the vertical axis (ignored if series contains lower values) (default +Inf)
  -lc label color
    	y-axis label color of the plot
  -o offset
    	offset in columns, for the label (default 3)
  -p precision
    	precision of data point labels along the y-axis (default 2)
  -r realtime
    	enables realtime graph for data stream
  -sc series colors
    	comma-separated series colors corresponding to each series
  -sl series legends
    	comma-separated series legends corresponding to each series
  -sn number of series
    	number of series (columns) in the input data (default 1)
  -ub upper bound
    	upper bound set the maximum value for the vertical axis (ignored if series contains larger values) (default -Inf)
  -w width
    	width in columns, 0 for auto-scaling
asciigraph expects data points from stdin. Invalid values are logged to stderr.

Feed it data points via stdin:

seq 1 72 | asciigraph -h 10 -c "plot data from stdin"

or use Docker image:

seq 1 72 | docker run -i --rm ghcr.io/guptarohit/asciigraph -h 10 -c "plot data from stdin"

Output:

 72.00 ┤                                                                  ╭────
 64.90 ┤                                                           ╭──────╯
 57.80 ┤                                                    ╭──────╯
 50.70 ┤                                             ╭──────╯
 43.60 ┤                                      ╭──────╯
 36.50 ┤                              ╭───────╯
 29.40 ┤                       ╭──────╯
 22.30 ┤                ╭──────╯
 15.20 ┤         ╭──────╯
  8.10 ┤  ╭──────╯
  1.00 ┼──╯
                                  plot data from stdin

Example of real-time graph for data points stream via stdin:

Realtime graph for data points via stdin (google ping) using asciigraph

command for above graph
ping -i.2 google.com | grep -oP '(?<=time=).*(?=ms)' --line-buffered | asciigraph -r -h 10 -w 40 -c "realtime plot data (google ping in ms) from stdin"

Example of multi-series real-time graph for data points stream via stdin:

Ping latency comparison: Google (Blue) vs. DuckDuckGo (Red) with asciigraph

command for above graph
{unbuffer paste -d, <(ping -i 0.4 google.com | sed -u -n -E 's/.*time=(.*)ms.*/\1/p') <(ping -i 0.4 duckduckgo.com | sed -u -n -E 's/.*time=(.*)ms.*/\1/p') } | asciigraph -r -h 15 -w 60 -sn 2 -sc "blue,red" -c "Ping Latency Comparison" -sl "Google, DuckDuckGo"

Acknowledgement

This package started as golang port of asciichart.

Contributing

Feel free to make a pull request! :octocat:

asciigraph's People

Contributors

carlosms avatar dmke avatar ewanme avatar guptarohit avatar jeffrey-jiao-epic avatar karlheitmann avatar kroitor avatar loic5 avatar nathanbaulch avatar quackduck avatar sinkevichmm avatar xordspar0 avatar

Stargazers

 avatar  avatar  avatar  avatar  avatar  avatar  avatar  avatar  avatar  avatar  avatar  avatar  avatar  avatar  avatar  avatar  avatar  avatar  avatar  avatar  avatar  avatar  avatar  avatar  avatar  avatar  avatar  avatar  avatar  avatar  avatar  avatar  avatar  avatar  avatar  avatar  avatar  avatar  avatar  avatar  avatar  avatar  avatar  avatar  avatar  avatar  avatar  avatar  avatar  avatar  avatar  avatar  avatar  avatar  avatar  avatar  avatar  avatar  avatar  avatar  avatar  avatar  avatar  avatar  avatar  avatar  avatar  avatar  avatar  avatar  avatar  avatar  avatar  avatar  avatar  avatar  avatar  avatar  avatar  avatar  avatar  avatar  avatar  avatar  avatar  avatar  avatar  avatar  avatar  avatar  avatar  avatar  avatar  avatar  avatar  avatar  avatar  avatar  avatar  avatar

Watchers

 avatar  avatar  avatar  avatar  avatar  avatar  avatar  avatar  avatar  avatar  avatar  avatar  avatar  avatar  avatar  avatar  avatar  avatar  avatar  avatar  avatar  avatar  avatar  avatar  avatar  avatar  avatar  avatar  avatar  avatar

asciigraph's Issues

How to install now that `go get` is deprecated

This looks really neat. But I'm having trouble installing it. Anyone know of a workaround now that go get is deprecated?

  • macOS 13.4.1
  • Go 1.20.5

go get

$ go get github.com/guptarohit/asciigraph
go: go.mod file not found in current directory or any parent directory.
	'go get' is no longer supported outside a module.
	To build and install a command, use 'go install' with a version,
	like 'go install example.com/cmd@latest'
	For more information, see https://golang.org/doc/go-get-install-deprecation
	or run 'go help get' or 'go help install'.

go install

$ go install github.com/guptarohit/asciigraph@latest
package github.com/guptarohit/asciigraph is not a main package

PlotMany from command line

I'd like di plot different series in the same chart, providing inputs from stdin (pipe).

Is there any way to do so?

Panic when no positive values provided

When no positive floats are provided to Plot(), a panic is observed:

Examples:

package main

import "github.com/guptarohit/asciigraph"

func main() {
	println(asciigraph.Plot([]float64{0}))
}
package main

import "github.com/guptarohit/asciigraph"

func main() {
	println(asciigraph.Plot([]float64{-1}))
}

Result:

PS C:\Users\Lee\test> go run .\main.go
panic: runtime error: index out of range

goroutine 1 [running]:
github.com/guptarohit/asciigraph.Plot(0xc00007df78, 0x1, 0x1, 0x0, 0x0, 0x0, 0x0, 0x0)
        C:/Users/Lee/go/pkg/mod/github.com/guptarohit/[email protected]/asciigraph.go:92 +0x13aa
main.main()
        C:/Users/Lee/test/main.go:6 +0x67
exit status 2

Line 92 is as follows:

plot[rows-y0][config.Offset-1] = "┼" // first value

Print X-Axis values

Hi there, pretty awesome lib!

How complex would it be to add an option to print the x-axis in addition to the y-axis?
I want to use your library in my fan2go project to print fan curve data to console, and it would be very helpful for users to see the x-axis values (0-255).

Thx!

Reformat Code

It would be nice if instead of having only one function that just generates a string, we had a struct named 'struct graph' for example, that had this method, configurations and other utilities inside. Subsequently, it would be easier to change implementations of other methods without changing the interface.

Besides that, we can add other methods, e.g. one could be to plot several graphs together or show statistics. However, (from my standpoint) it is essential to rewrite code so that it supports structure which will implement methods. In addition, it would encourage other users to write code for this project and making contributions much easier.

DISCLAIMER: I don't mean to delete old code, because other projects might be using it, so I will just extend it to support classes.

Confused about the Offset option

I'm a bit confused about the meaning of the Offset option.

for i := 0; i < 10; i++ {
	println("offset", i, ":", Plot([]float64{0}, Offset(i)))
}
offset 0 :  0.00 ┼
offset 1 : ┼
offset 2 :  0.00┼
offset 3 :  0.00 ┼
offset 4 :  0.00  ┼
offset 5 :  0.00   ┼
offset 6 :   0.00   ┼
offset 7 :    0.00   ┼
offset 8 :     0.00   ┼
offset 9 :      0.00   ┼

This is pretty odd behavior that raises a few questions. Is the purpose of this option to add space before or after the y-axis label? It seems to do a bit of both in an inconsistent way.

CLI: for realtime data stream, clear old graph before plotting new data

Currently, when we pass data stream to cli of asciigraph it outputs the graph to stdout by default.

While this works fine in general, it becomes problematic when plotting in realtime mode as terminal retains the previous graph outputs.

To address this, it would be nice to keep only the latest plot copy in the terminal. To achieve it, clear the already plotted graph first before plotting new when we plotting realtime graph from stdin.

Possible solution: we can utilise ANSI escape sequences to move the cursor and clear the old graph. The following snippets might be helpful:

Move cursor n lines up: fmt.Sprintf("\033[%dA", n)
Clear the line: fmt.Sprintf("\033[2K")

Panics if data is flat

If each data point in the input is the same, asciigraph panics. This can be demonstrated simply using the command line interface:

> echo 1 1 | asciigraph
panic: runtime error: index out of range

goroutine 1 [running]:
github.com/guptarohit/asciigraph.Plot(0xc420057c18, 0x2, 0x40, 0xc420057eb8, 0x4, 0x4, 0x17, 0x115f6c0)
        /home/me/go/src/github.com/guptarohit/asciigraph/asciigraph.go:92 +0x1525
main.main()
        /home/me/go/src/github.com/guptarohit/asciigraph/cmd/asciigraph/main.go:56 +0x5e0

I've also written a test that demonstrates it: xordspar0@f02e7a5

Two options: ColorAbove and ColorBelow

Hi.

I've added some code to enable options to color the parts of the graph that is above/below a certain value. So this graph:
bilde

Is produced by the following code:

func main() {
	series := []float64{1, 2, 3, 4, 5, 4, 3, 2, 1}
	graph := asciigraph.Plot(series, asciigraph.Height(10),
		asciigraph.Width(50),
		asciigraph.Caption("A simple line graph"),
		asciigraph.ColorAbove(asciigraph.Red, 4.0),
		asciigraph.ColorBelow(asciigraph.DarkGreen, 2.0),
	)
	fmt.Println(graph)
}

Lemme know if you want me to contribute this in a proper manner. If so I'll but a bow on it and hand it over.

Cheers,

Per.

NaN numbers

It would be great it the library can accept NaN float64 values. It can simply create a discontinuity in the the graph.
Currently I have to do a validation to prevent the package from panicking.

Can I plot bar graphs?

I would like to know if I could use this library for plotting bar graphs. I could not find any examples that show bar plot using this library.

Thanks.

Axis cross (┼) is in the wrong place at some scales

For some inputs and at certain scales, the axis cross doesn't line up with the plotted data:
screen shot 2019-02-02 at 2 37 29 pm

I can reproduce this with the following inputs:

echo '3084
3056
3047
3043
3041
3043
3043
3036
3033
3042
3042
3040
3032
3039
3018
2925
2926
2925
2923
2922
2924
2920
2910
2906
2907
2908
2908
2908
2908
2917
2914
2911
2914
2909
2913
2910
2914
2915
2894
2915
2913
2915
2907
2908
2916
2911
2910
2912
2903
2914
2911
2905
2903
2901
2910
2899
2901
2901
2902
2909
2904
2908
2893
2901
2903
2903
2908
2910
2900
2898
2903
2895' | asciigraph -h 24

Add legend to graph

I would like to be able to add a graph legend which would help with deciphering colored graphs. My idea is to add an extra line underneath the caption with colored boxes for each line on the graph with an explanation of what each color represents.

I'm already working on an implementation. If this is a feature you'd like, I thougth I could perhaps open a PR when I'm finished?

Recommend Projects

  • React photo React

    A declarative, efficient, and flexible JavaScript library for building user interfaces.

  • Vue.js photo Vue.js

    🖖 Vue.js is a progressive, incrementally-adoptable JavaScript framework for building UI on the web.

  • Typescript photo Typescript

    TypeScript is a superset of JavaScript that compiles to clean JavaScript output.

  • TensorFlow photo TensorFlow

    An Open Source Machine Learning Framework for Everyone

  • Django photo Django

    The Web framework for perfectionists with deadlines.

  • D3 photo D3

    Bring data to life with SVG, Canvas and HTML. 📊📈🎉

Recommend Topics

  • javascript

    JavaScript (JS) is a lightweight interpreted programming language with first-class functions.

  • web

    Some thing interesting about web. New door for the world.

  • server

    A server is a program made to process requests and deliver data to clients.

  • Machine learning

    Machine learning is a way of modeling and interpreting data that allows a piece of software to respond intelligently.

  • Game

    Some thing interesting about game, make everyone happy.

Recommend Org

  • Facebook photo Facebook

    We are working to build community through open source technology. NB: members must have two-factor auth.

  • Microsoft photo Microsoft

    Open source projects and samples from Microsoft.

  • Google photo Google

    Google ❤️ Open Source for everyone.

  • D3 photo D3

    Data-Driven Documents codes.