For our project we determined three overarching business goals that we would focus on, which we will then expand upon in the analytics goals and general model. Firstly, our central business goal and the overarching goal of the project is to maximize yearly profit (via optimization) for a specific listing on Airbnb. All other goals are aimed either at modifying this central goal or constraining it to make our final solution more viable. Our second business goal is to create a dynamic pricing tool that determines a daily price competitive with other localized Airbnb listings. By determining price at the scale of the smallest possible rental period (daily) we wanted to create a model that was as flexible as possible. This means that our optimization model could be specified down to the specific days that a user would/would not expect to be renting their listing, hopefully further increasing the validity of our end result. Our third main business goal is to create an easily repeatable design process for expansion to other locations. Because our current model has a narrow scope in terms of location, we wanted to be certain that as we constructed our model, our design and the choices we made could be easily replicated in the future so that this model could be adapted to have a more universal utility.
Once we had established our business goals, and what we wanted to accomplish in this project, we then created 3 main analytics goals in order to determine how we wanted to meet our goals. Our first analytics goal is to find the function of demand in terms of price via k-means clustering. In building our model, we needed a way to effectively project demand given a set of predetermined parameters; therefore, we chose to use k-means clustering on listings from identical neighborhoods with similar attributes. This ensured that the clusters were from properties as similar as possible, so that the differences in attributes were the only things affecting rentals and we could determine their individual influences on our demand variable. Our second analytics goal is to predict the intrinsic value of a property by running a kNN regression using attributes of that property. Similar to the previous goal, we wanted to ensure our valuation of properties was as accurate as possible, so by using kNN on the many variables presented in the Airbnb dataset (number of beds, amenities, etc.), we knew that the classes we were creating within our regression ensured that any factors not included in our model would have a minimal effect, as they would be adequately described by the NN algorithm. Our third analytics goal is to calculate the optimal daily price through an optimization model of yearly profit. This goal describes our main business goal in more concrete analytical terms. Once we knew we would be using an optimization model, we could structure our analysis around the component pieces necessary; a modeled demand variable, intrinsic amenities’ additive values for properties, and valuation of costs vs. revenues. By framing our problem as a typical revenue - cost optimization, we could outline our general structure and begin to create the pieces necessary for our final model.
Overall Model
- Competition for the Airbnb listings are other Airbnbs, rather than hotels. We are assuming that prospective customers have already decided to use Airbnb services and thus are only looking at Airbnbs in the area and not comparing prices to nearby hotels.
- Listing prices are separated by month, weekday, weekend, and special events due to the fluctuating demand during those time periods. However, the prices within those groups are held constant; therefore, our data is not time sensitive.
- Partial rentals are not allowed, meaning that different parties cannot simultaneously rent the same listing, even if their combined parties do not exceed that listing’s capacity.
- One Airbnb reservation is allowed per rental period (based on Airbnb’s own policy).
- Sellers will only be considered as those people who already own a property and have owned the same property for a reasonable length. This allows for the assumption that the individual seller using our model will be able to procure the necessary data about their listing easily.
Variables
- The parking capacity is reflective of the capacity of the property i.e. the need for excess parking by a renting party was not considered.
- If greater than two guests belong to a renting party, costs increase by an additional $X per person + $X(G-2). This generalizes the increase in cost based on additional members of the rental party.
- Monthly upkeep includes mortgage payment (or rent), utilities, cleaning fee, HOA fees, etc. and will be used as a single value to approximate the monthly cost to operate the rental.
Airbnb Listing information http://insideairbnb.com/get-the-data.html
An additional dataset that is from the San Francisco public safety database for all reported police department incidents to model safety scores https://data.sfgov.org/Public-Safety/Police-Department-Incidents/tmnf-yvry

Since the focus of our project is to determine the most optimal listing price, on a daily basis level, to maximize the long-term profit, we initially struggled to identify the better approach between two common solution methods, which are time series regression and optimization modeling. Time series regression is ideal for dealing with the daily fluctuation of price, and it can take into account the effect of other variables such as property types, amenities, the safety of Airbnb on the listing prices. However, time series regression doesn’t guarantee that the “best fitted” price is the “optimal” price that will maximize our profit. On the other hand, optimization is ideal for finding the “optimal” prices, but if the optimization model will be very complex if we try to find optimal price for 365 days, as well as include the effect of Airbnb characteristics on the daily prices. After a thorough consideration, we found a way to combine the regression model into the optimization by using it in our variable creation process; in addition we applied several assumptions to simplify the model while still taking the time series factors into consideration.
The system architecture (figure 1) shows how the model will be implemented both with data sources and methodologies. Mentioned in Solution Strategy I, we separated the datasets from two sources, being the neighborhood GeoJSON file, which extracts the accurate locations of all the listings in San Francisco, and the historical listing information that includes the facility details and booking statistics of each listing. With the GeoJSON file, we divided the listings into nearby neighborhoods, and then we used clustering analysis within each neighborhood to group the listings with similar features without having to account for locational variations in property valuation. The results gave us a list of clusters which we used to identify the primary listings that will potentially compete with each other. Combining Airbnb historical listing information and the clustering results, we then went through multiple iterations of regression analysis for each cluster before incorporating them into a singular demand function that varied in terms of listing price. Knowing that each listing must have an inherent, baseline price that would prevent any negative valuation, we imported the historical data to kNN regression and determined a baseline value for each listing. Finally, we incorporated both the demand function and the baseline price into our optimization model to generate the best price, given the booking probability on any day by our demand variable.
As found in the Overview of the Airbnb Community in San Francisco published by Airbnb, the average length of stay per guest is 4.2 nights. We assumed each listing has 4.2 days as an average lengths of stay per booking. Since we were not able to find a clear number for the ratio of guests making a booking who leave a review for Airbnb, we assumed the review rate to be equal to 0.5, which will be used as a constant throughout the estimation. To prevent artificially high results, we also assumed the maximum occupancy rate cannot exceed 0.95, meaning even the busiest of listings will have several nights a month in which they go unrented. With these assumptions and constants, we generated the formulation of estimated occupancy rate shown below:

Initially, we planned to have two separate models for predicting the listing price and the demand. One such model used k-Means to cluster all Airbnb listings within 3 miles radius to find groups of nearby similar properties, and took the average occupancy rate to estimate the expected monthly demand within each cluster. We then had another independent k Nearest Neighbor regression model to forecast daily listing price based on listing attributes that best represent the property values (amenities, safety, etc). Finally, we estimated the expected monthly profit by taking the daily average listing price of each month and multiplied by the predicted monthly demand ( the predicted number of days that a property is booked in a month).
However, after many attempts to improve this model’s accuracy, we found that it was unreasonable to predict demand and listing price separately, primarily because these two quantities are heavily correlated with each other. For example, the demand will likely decrease if the listing price increases, since customers can be expected to make smart decisions and switch their booking to a cheaper Airbnb with similar characteristics. Therefore, we decided to model demand first, and then incorporate it into our price function. This meant that we needed to construct a demand function that captures competitor factors, listing characteristics, and time fluctuations.

We model the competitor factor by using the same approach that we initially planned to apply for our monthly demand estimation. Customers tends to choose their Airbnb with a specific location in mind, so all listings that are located close together (within 3-mile radius) will be more likely to compete with each other. Going beyond this, the characteristics and quality of the listing should have an almost equal, and occasionally greater impact on determining occupancy rates relative to those properties competing with one another. From these guides we elected to use k-Means to cluster similar properties within a 3-mile radius distance (figure 2&3).

For each cluster, we have a set of data with the X-variable being the listing price and the Y-variable being the demand represented by the occupancy rate. From this we will fit either a linear or polynomial regression model onto this dataset to find the best-fitted function of demand
We then put this demand function into the optimization model. The objective is to maximize profit in one year, so the formula to calculate profit for each day is the listing price on that day multiplied by the demand function on that day, represented as 
We first set out to incorporate the property-specific characteristics into the model to customize the pricing model for each listing; as mentioned previously if we include too many variables into an optimization, we are less likely to have a valid solution. Instead we used our regression model to determine a “baseline” price, which we define as a price mark that indicates the intrinsic value of an Airbnb property without considering time series fluctuation (seasonalities, weekend vs weekday). Then in the optimization model we display the daily price
The optimization model will find the optimal coefficient ij, and consequently the optimal daily listing price xij.
Additionally we used the k Nearest Neighbor (kNN) regression to determine the most accurate fitted baseline price for each listing, based on attributes that we decided will determine the value of a listing such as location, amenities, review scores, safety, etc. The reason we selected the kNN algorithm is because it determines the response variable Y based on the values of X-variables from k neighbors, which in our case is the values of nearby Airbnb competitors. This is a good model fit for our data because in real life, it is usually the case that real estate, hotel, and Airbnb values are heavily influenced by their surrounding competitors as a function of their location.
In attempting to find the daily optimal price, we determined that our optimization model will have up to 365 price variables x1,..., x365. We originally simplified the model by assuming that price is relatively consistent throughout one month. However when further analyzing past data, we observed that Airbnb’s demand is generally higher during weekend than weekday, so we further delineated our model into two separate optimization models for both weekends and weekdays. From this we arrived at our model’s assumptions that listing price should be constant for all weekends within a month and for all weekdays within a month.
- ij: binary variable which is 1 if customers decide to book Airbnb property on day j of month i, equal to 0 otherwise
-
$$x_{ij}$$ : price of Airbnb property on day j of month i Parameters: -
$$C_V$$ is variable cost that includes cleaning fee, utilities, guest-included fee, deterioration fee on amenities. For simplicity of our model, we will let users independently input$$C_V$$ to the application, allowing us to treat$$C_V$$ as a constant. Moreover, we assume$$C_V$$ will be incurred only on the days where bookings happened. -
$$I_O$$ is initial investment the property owner supplies, which potentially includes the real estate or reimbursement costs, amenity purchases, maintenance cost or any other upfront cost. For simplicity of our model, we will let users input the estimate initial investment on their property, allowing us to treat this as a fixed cost throughout our model. -
$$D_{ij}$$ : demand of day j on month i, represented by the probability that the listing is actually booked on a specific day, given the listing price xij.$$D_{ij}$$ is the function of$$x_{ij}$$ and is determined by performing regression analysis on the cluster that the specific Airbnb property belongs to.
At this point we had constructed the components necessary for us to begin formulating our final optimization model. As defined above, our demand function will indicate the probability that the property is booked on day i, month j; if this “booked” probability is bigger than 50%, then we assume the property is marked as booked in our model on day i month j. This then allows the host to collect the optimal listing price,

If occupancy of that month is 45%, then the expected number of days booked in that month is 45% * 30 days = 14 days. We can then retrieve the exact date of that month where j = 1 or D(xj) > 50%, and sum up their corresponding predicted prices to get the expected profit of that month.
The objective function is to maximize yearly profit, which equals to the revenue subtracted from the cost. The revenue is the sum of optimal listings prices on the days that bookings happen, or in the words, where ij = 1. We take the summation of both weekend and weekday (determined by index j) and of 12 months (determined by index i).
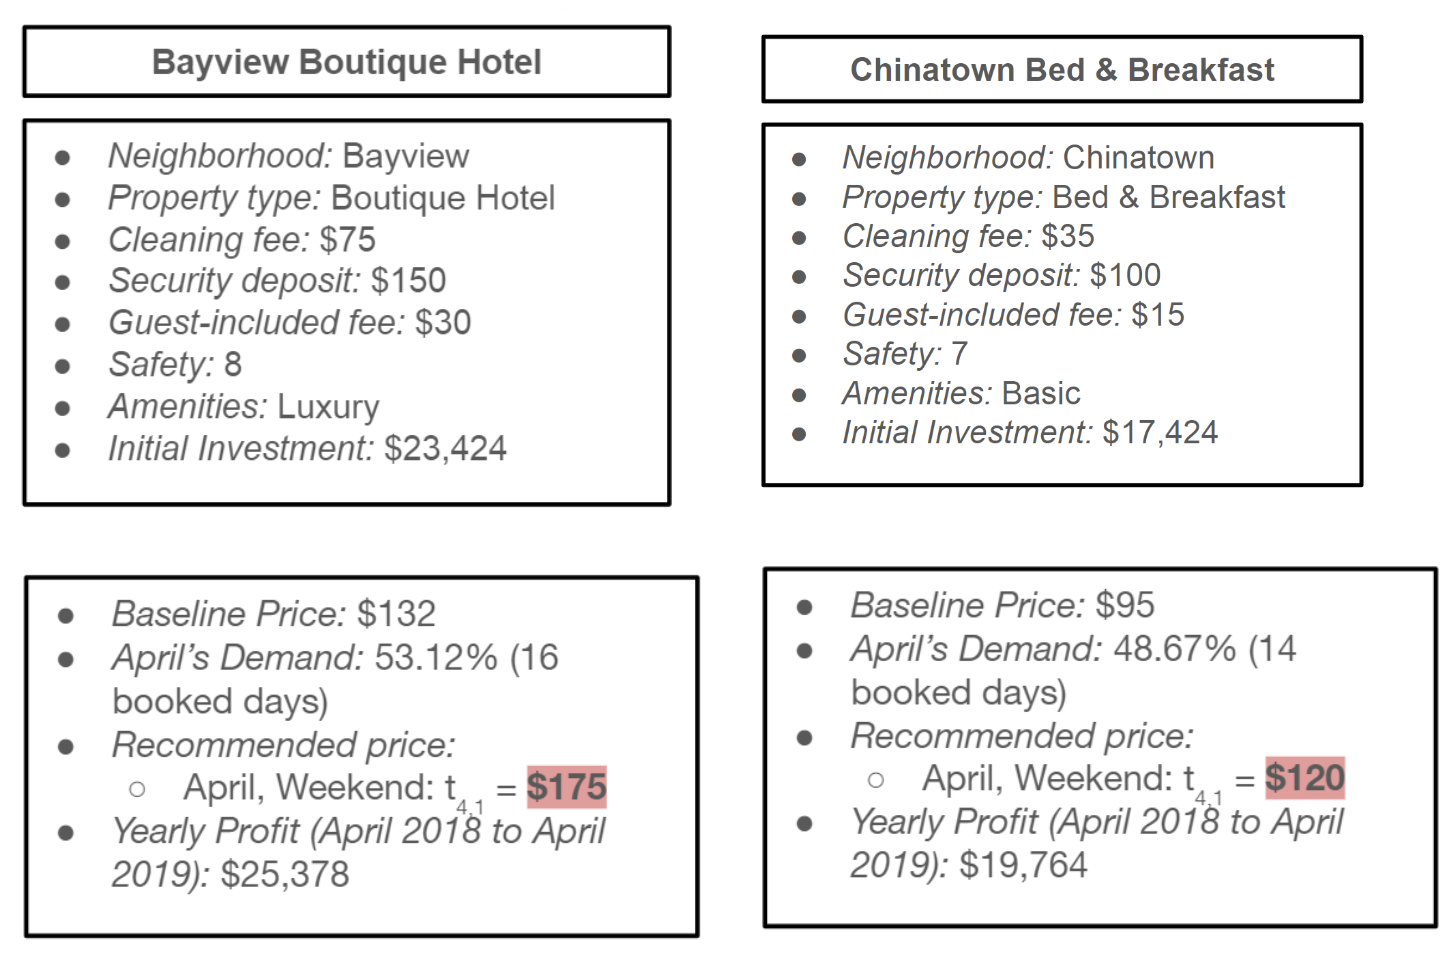
We tested two example inputs in our optimization model. The first example is the “Boutique Hotel” property in the Bayview neighborhood. The k-Means clustering algorithms classify this listing into a cluster whose average prices are relatively high compared to other clusters of San Francisco Airbnbs. After inspecting the detailed attribute values of these listings within this cluster, we can observe that most of them have safety score above 7, and amenity scores that are majority ‘luxury’. We can therefore label this cluster as “high-end” listing group. From this cluster, we perform a kNN regression to find the demand function as outlined in our model above. The regression model predicts the intrinsic value of this property to be $132, which means independent from all the time factors, this is the ideal price we should list for. The optimization model gives us 24 values of decision variables, which are the recommended prices of both weekends and weekdays in 12 months. For example, t4,1 is the recommended price of all weekends in April. We take the sum of recommended price on the day that optimization model predicts bookings will happens and subtract the expected cost to generate our expected yearly profit of $25,378.
Similarly, we choose one listing in the Chinatown with “Bed and Breakfast” motif. This listing belongs to a seemingly “medium-category” Airbnb as evidenced by it’s lower safety score and lower intrinsic value score, meaning that it’s amenities offered are less appealing than those of the Bayview listing. Our demand rate is also lower than the Bayview’s; it seems that despite a potentially lower price, the Chinatown listing is in a location that was less popular among prior Airbnb users. The remaining calculation process is similar to the previous example, and just as one would expect from the above inputs, the yearly net profit is lower than the Bayview example, at $19,764.
Figure 7 displays the first page of the application where hosts provide information related to their Airbnb properties such as property type (apartment/room), number of bedrooms and bathrooms, neighborhood, and amenities. Hosts have the option of pasting the URL link of their posted Airbnb, after which the system can parse the values of each corresponding attribute. Alternatively, hosts can manually type out the values of all attributes. On this page, hosts will also provide an estimated initial investment, setting the cost with which they want to break even after a 12 month period. Finally, hosts will also provide the variable costs that they think each booking will explicitly and implicitly charge on their properties. Figure 8 displays the result of our k Nearest Neighbor regression model, which predicts the intrinsic values of the given Airbnb property. A map view is also incorporated below to give a visual overview of property location and details.

Figure 9 shows the results of our optimization model. Of primary importance is that it displays the optimal listing price matched to the corresponding day on the calendar. For instance, if the values of the decision variable t7,1 = $349, then the listing price of all weekdays on July is $349, excluding weekends and special events. From our demand function, we can calculate demand fluctuations pertaining to both individual listings and the neighborhoods that they belong to. On the bottom left of the figure 9, we observe the time series plot of Airbnb demand in the neighborhood, while the bottom right shows the expected Airbnb demand of the selected listing. This comparison plot will give the host insights how “competitive” they are when compared to other Airbnb listings around them. Figure 10 displays the reporting tools incorporated into the UI, most importantly the expected demand for each month during the year (the full graphs would be shown when the user scrolls left and right). This demand is calculated by taking the occupancy rate of each month and multiplying by 30 to give the expected number of booked days. The second graph shows the expected profit for each month of the year, which is calculated by taking the sum of listing prices on the days in that month that our optimization model predicts a booking will happen (ij = 1 or D(xij) >= 50%). The highest profit and demand months are highlighted in gold. Finally, a total summary is given of the profit for that year, starting from the month selected.

- Issue 1: When users post a new listing, they have a field to fill in information for all the attributes related to the listings. While in a real life setting only a small subset of these attributes are “required”, because we include the optional attributes in our regression model, the model won’t work properly for that listing if the users don’t fill in all possible attributes.
- Issue 2: We assume that within a given month, the prices of the weekend and weekday, except special-event days, are the same, which can definitely cause problems in this model moving forward. The demand is a key factor to determine the dynamic changes of the listing price, and the demand of Airbnb in any given area could easily fluctuate throughout weekdays or within the same month.
- Issue 1: Whenever a new listing is submitted to our system, we would implement a script to check whether all the attributes are filled. If any of these attributes are left empty, it would send a notification to the user with the ids of the listings with empty attributes.
- Issue 2: A possible method for monitoring this that we discussed was to monitor the number of flights arrived to San Francisco airport, as it is generally agreed that air traffic is a decent indicator for the travel flow of San Francisco. If during the week, the number of flights arrived fluctuates greatly (we can have a condition to check whether the moving average of flights exceed a certain benchmark to represent whether the fluctuation is significant or not), then the system will send us a notification.
- Issue 1: All the missing attributes are, by definition, optional information, so it’s not crucially important to have those fields. We can auto-fill these attributes with the most common values (for categorical variables) or with the median values (for numerical variables) scraped from the Airbnb dataset. This means that if the reviews are blank, then we can autofill the reviews of those listings with the median values of all other reviews that have been filled.
- Issue 2: If we get the notification to indicate that the demand, represented by travel, is undergoing significant fluctuation, the engineering team then has to more thoroughly inspect the demand trend to see the extent of the fluctuations, or any possible reasons for the fluctuations. If the frequency of the notification is high within a day or a week, we could change our model from estimation based on clustering to the previously discussed time-series regression model to predict the daily demand of each Airbnb based on their characteristics.
When comparing our two examples, we noticed that regardless of the price differences and the two different clusters that these listings belong to, their expected demand is relatively close (approximately 50%). This means that there is normally a stable customer ground of each potential location classification: some people only look for fancy, big and high-end Airbnb with high target price, and some customers particularly hunt for low-end and affordable rentings. Therefore, it is important to understand where your property stands within the context of the market and customer segments you should aim to target in setting an optimal price. For example if your listing belongs to a high-end cluster with a high target price, you shouldn’t lower the price too much to attract more customers but instead improve the quality of the listing, investing in amenities to attract more high-end customers. By doing this, you avoid sacrificing profit margins by targeting the wrong customer segment.
There are many future applications for this project. New variables can be added to help increase the accuracy of the model. Specifically, we identified seasonality as the next big influencer to be added. Obviously, there are months with more travelers than others, but our models do not account for that yet. A seasonal forecasting model will help us more accurately predict demand the the potential price that we can charge even on a week to week basis.
Another direction we might take the project in is starting franchises in new cities. The methodology will be pretty much the same, but the variables will need to be changed. Additional data will need to be collected about those cities too. Furthermore, our findings will become more and more accurate with time. We will be able to discover how to fix our own successes and failures and have more access to historical data. The rental market will undoubtedly grow as the number of travelers increases every year. We need to keep our analytical models up to date in order to have an edge on the competition and create feasible prices.
Increasing the customer’s role will also be vital to the success of our ventures. First, we need to make sure we have feedback from the customer’s. Reviews will tell us what we need to fix, and properties with more trusted reviews have a higher chance of being rented. Second, we can work with advertising companies to see just who we need to market to. With more targeted ads, we can beat out our competitors.

