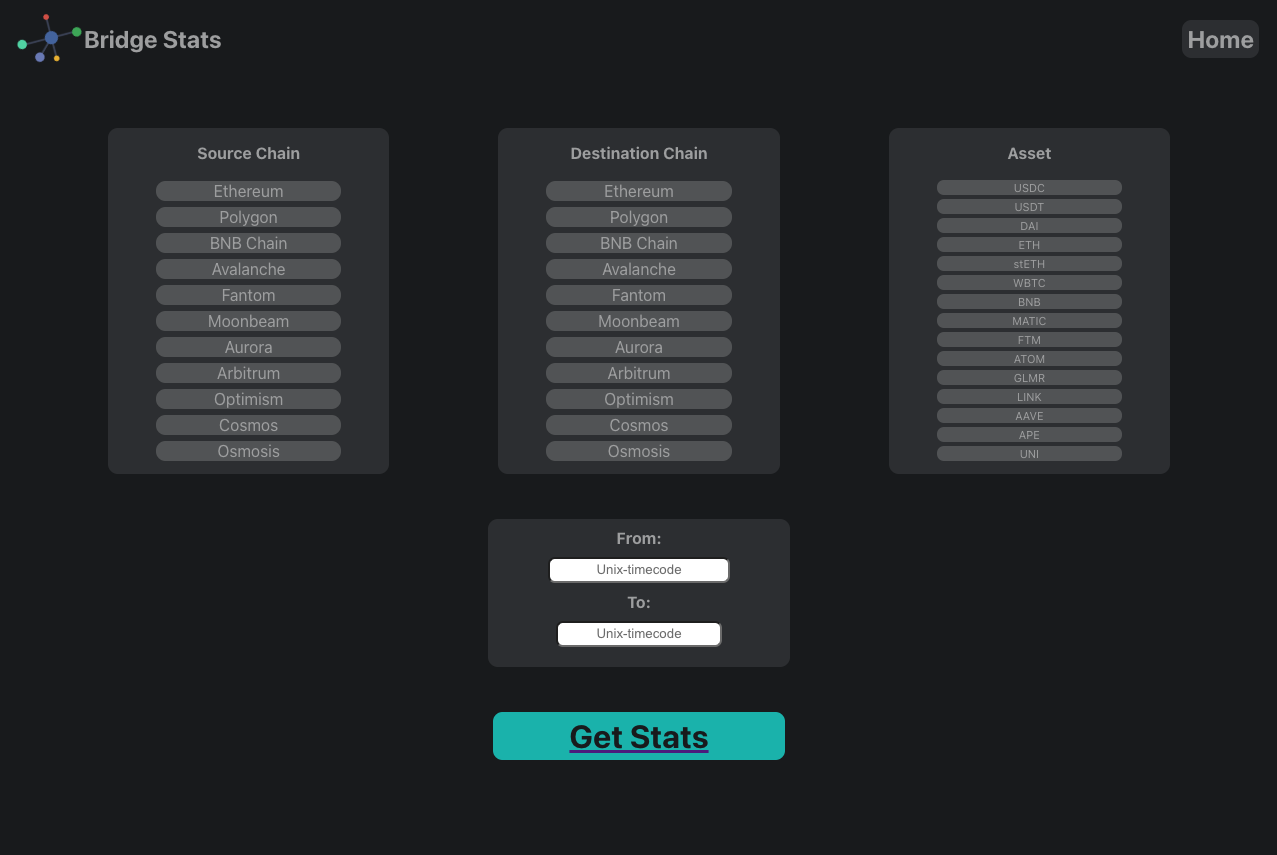
Crosschain Bridge Stats lets users obtain information on crypto asset flows between different blockchains. Users can retreive the information by selecting the Source and Destintion chains, the Asset and the time segment. Once the parameters have been set, the app returns three blocks of stats consisting of cumulative number of transfers, volume, a time series graph of transfers and a time series graph of volume for the specified time segment.
- Using external API to get bridge route data for a given token.
- Rendering data obtained fromm API on page in text and chart form.
- Users are able to interact with the page by selecting the source and destination chains, asset and time range they wish to obtain information on.
- Use multiple external APIs to aggregate date from a wider set of bridges and assets.
- Provide additional resources, links and charts to give users a deeper insight into their research goals.
- Extend list of parameters in order to provide more tailored data; such as getting bridge interaction history by wallet address, getting general data on a single bridge end, etc.
- Change time input to accept regular date format.
| Component | Description |
|---|---|
| App | This stores the initial parameters set by the user, passes it to other components and includes React Router |
| Header | This renders the header, includes the nav |
| Home | Contains the buttons and input logic and sets the state for the user inputted parameters. |
| Stats | Contains the MainStats, TimeSeries and CumulativeVolume components. |
| MainStats | Fetches API data for cumulative number of transactions and volume based on the parameters set by the user and renders the reults. |
| TimeSeries | Fetches time series API data for cumulative number of transactions based on the parameters set by the user and renders the reults. |
| MainStats | Fetches time series API data for cumulative volume based on the parameters set by the user and renders the reults. |
| Component | Priority | Estimated Time | Actual Time |
|---|---|---|---|
| Component Structure Design | H | 4hrs | 3.5hrs |
| Working with API | H | 3hrs | 2.5hrs |
| Styling | H | 10hrs | 10hrs |
| Core Logic | H | 10hrs | 12hrs |
| Total | H | 27hrs | 28hrs |
- Axios -> For getting data from the API.
- Vercel -> For deploying the app.
- Rechart -> For plotting visual charts from API time series data.
- React Router -> For enabling client-side routing.
An interesting piece of code that I used in my app was the LineChart element. Made by Recharts; this library features composable charting for React components, allowing users to easily plot beautiful, interactive and easy to read charts.
<div className='chart'>
                <LineChart
                    width={500}
                    height={300}
                    data={stats.data}
                    margin={{
                        top: 5,
                        right: 30,
                        left: 20,
                        bottom: 5
                    }}
                >
                <CartesianGrid strokeDasharray="3 3" />
                <XAxis dataKey="timestamp" />
                <YAxis />
                <Tooltip />
                <Legend />
                <Line
                    type="monotone"
                    dataKey="time"
                    stroke="#8884d8"
                    activeDot={{ r: 8 }}
                />
                <Line type="monotone" dataKey="num_txs" stroke="#82ca9d" />
                </LineChart>
}
| Issue | Resolution |
|---|---|
| Managing edge cases | It was difficult to come up with a way to mitigate edge cases encountered when a user inputs parameters for which there is no data. Even though the API accepts the parameters as correct, it would return an empty array. This led to the app breaking in those scenarios. I was able to solve it by writing an if statement just after the axios response in order to measure if the array had length. Depending on the result, it would either set state if the array had data or send an alert if the array was empty. |
| Buttons stay highlighted when clicked | Using onClick was not an option given that if a user clicked on another button on the same column, both would remain highlighted. I used conditional rendering to compare the user-set parameter state to the value of each button element. Which ever matched would render the styling for the clicked button. |
