![]()
(This is the energy cost of running our CI-Pipelines on Github. Find out more about Eco-CI)
The Green Metrics Tool is a developer tool indented for measuring the energy and CO2 consumption of software through a software life cycle analysis (SLCA).
Key features are:
- Reproducible measurements through configuration/setup-as-code
- POSIX style metric providers for many sensors (RAPL, IPMI, PSU, Docker, Temperature, CPU ...)
- Low overhead
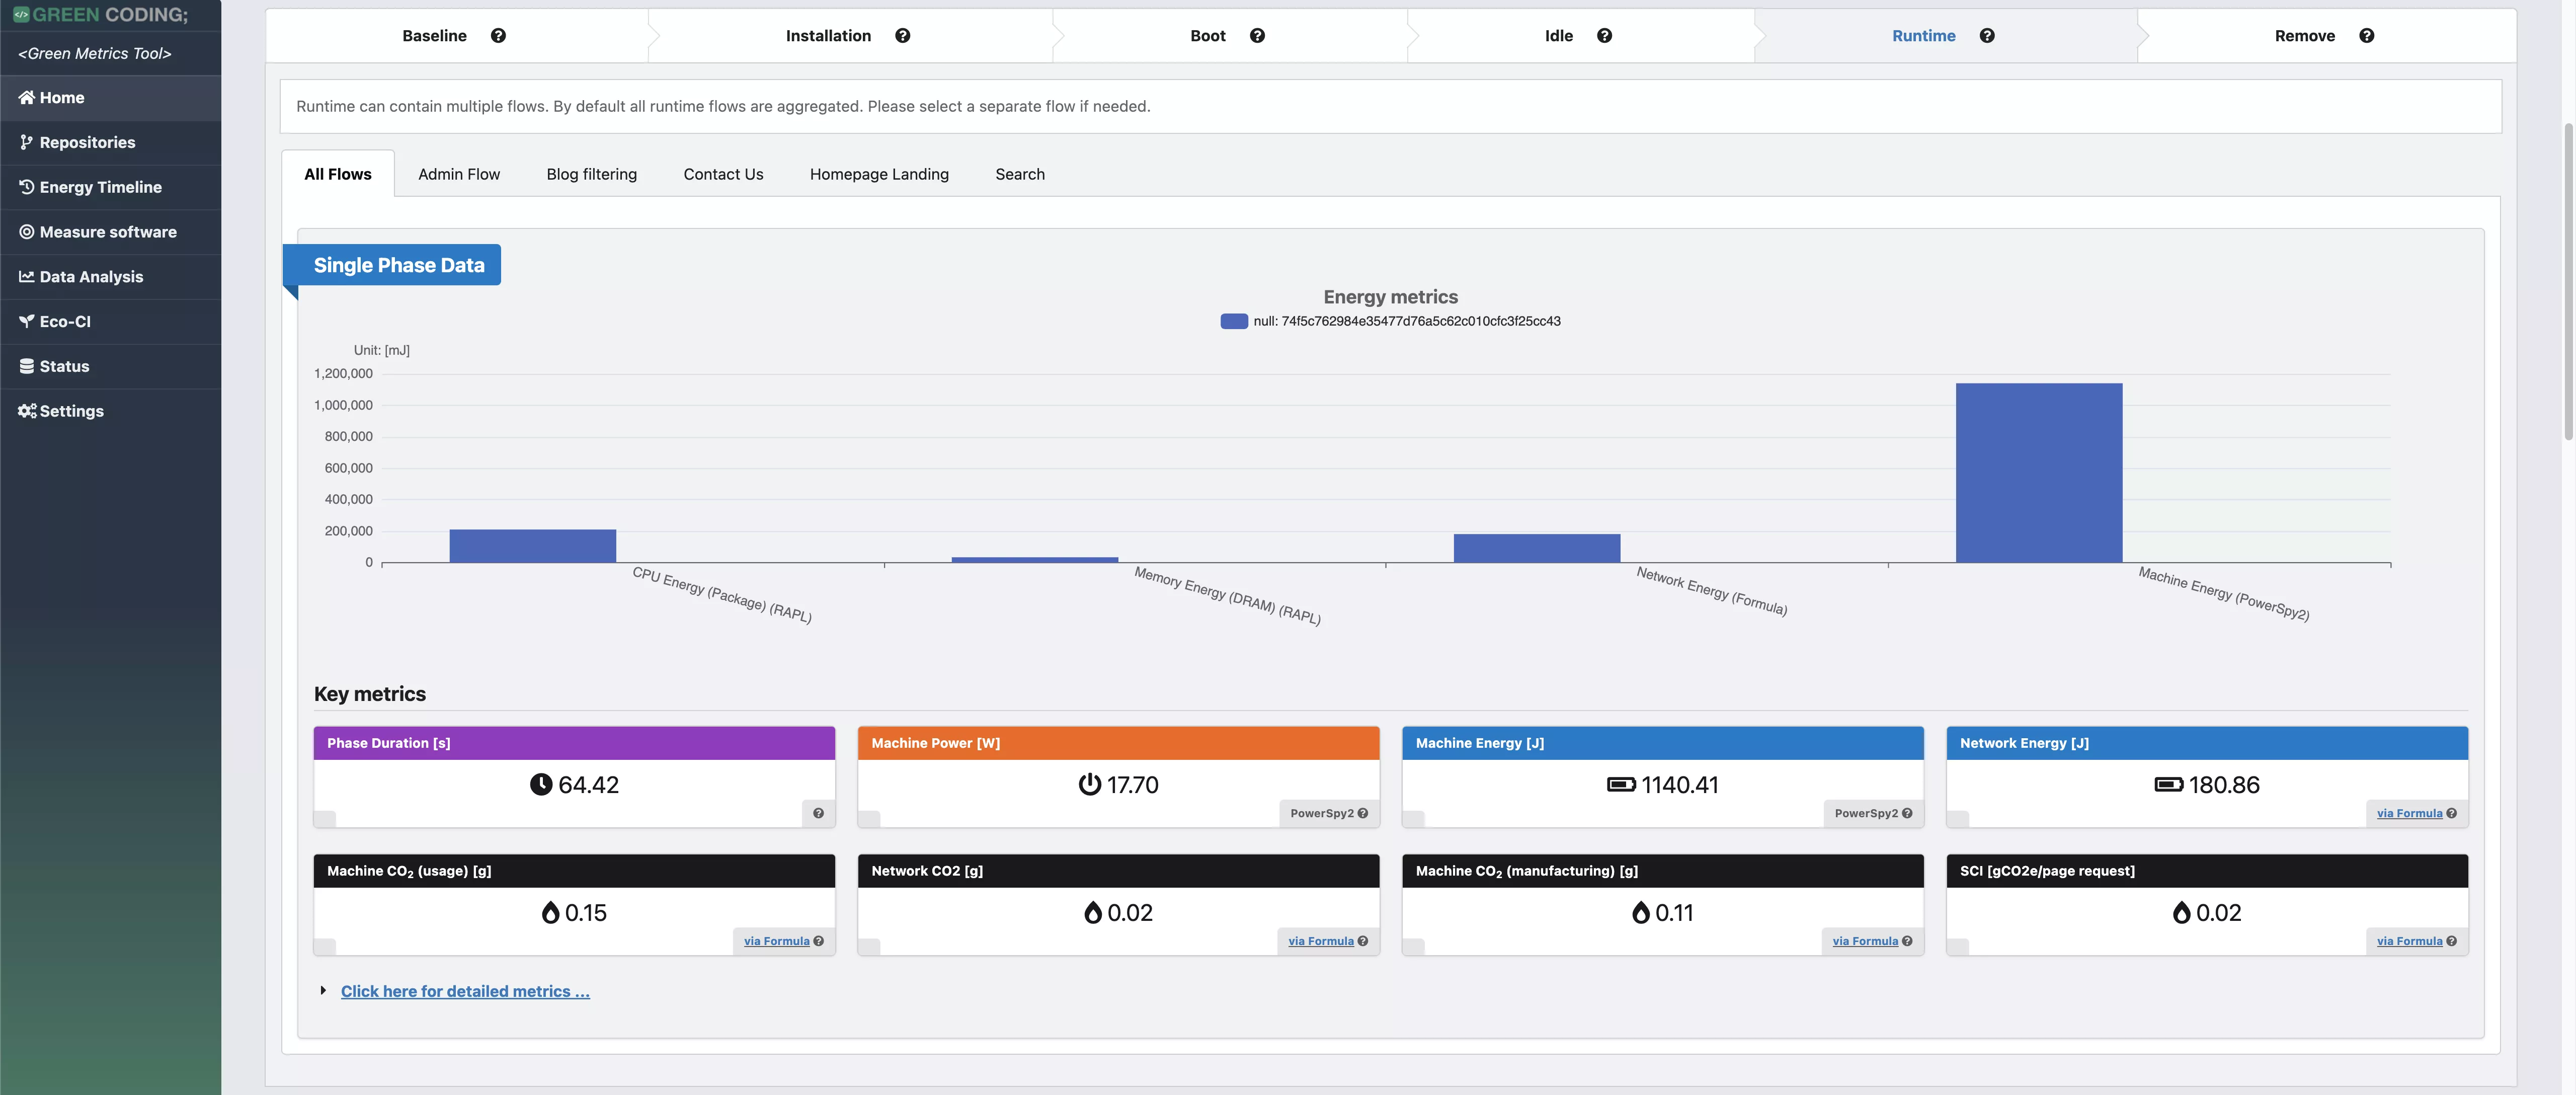
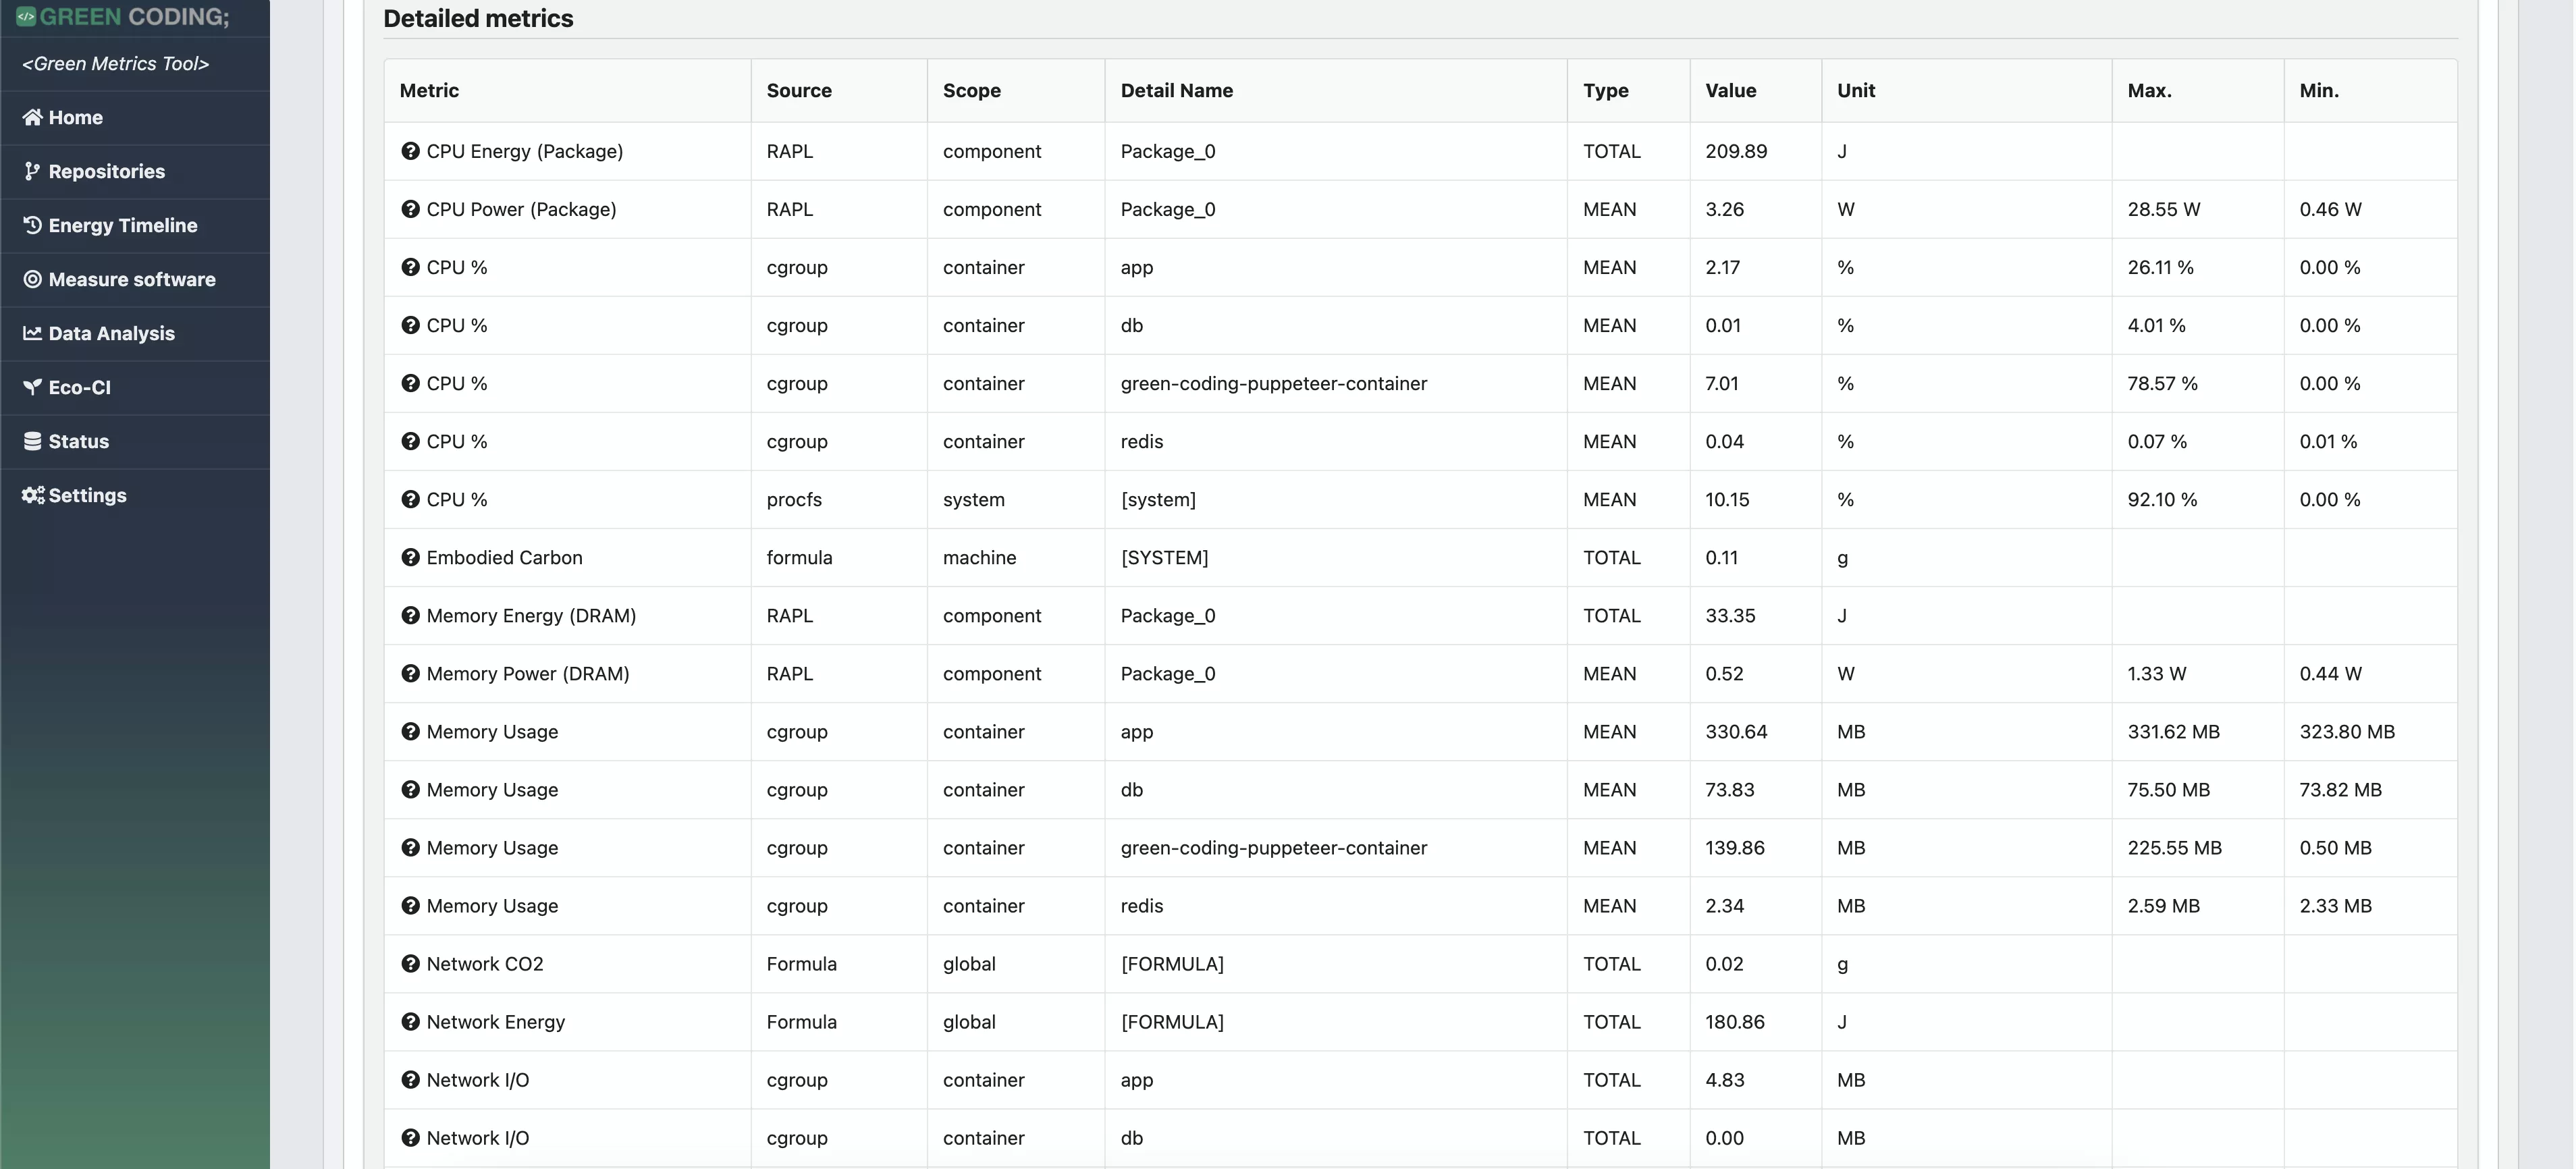
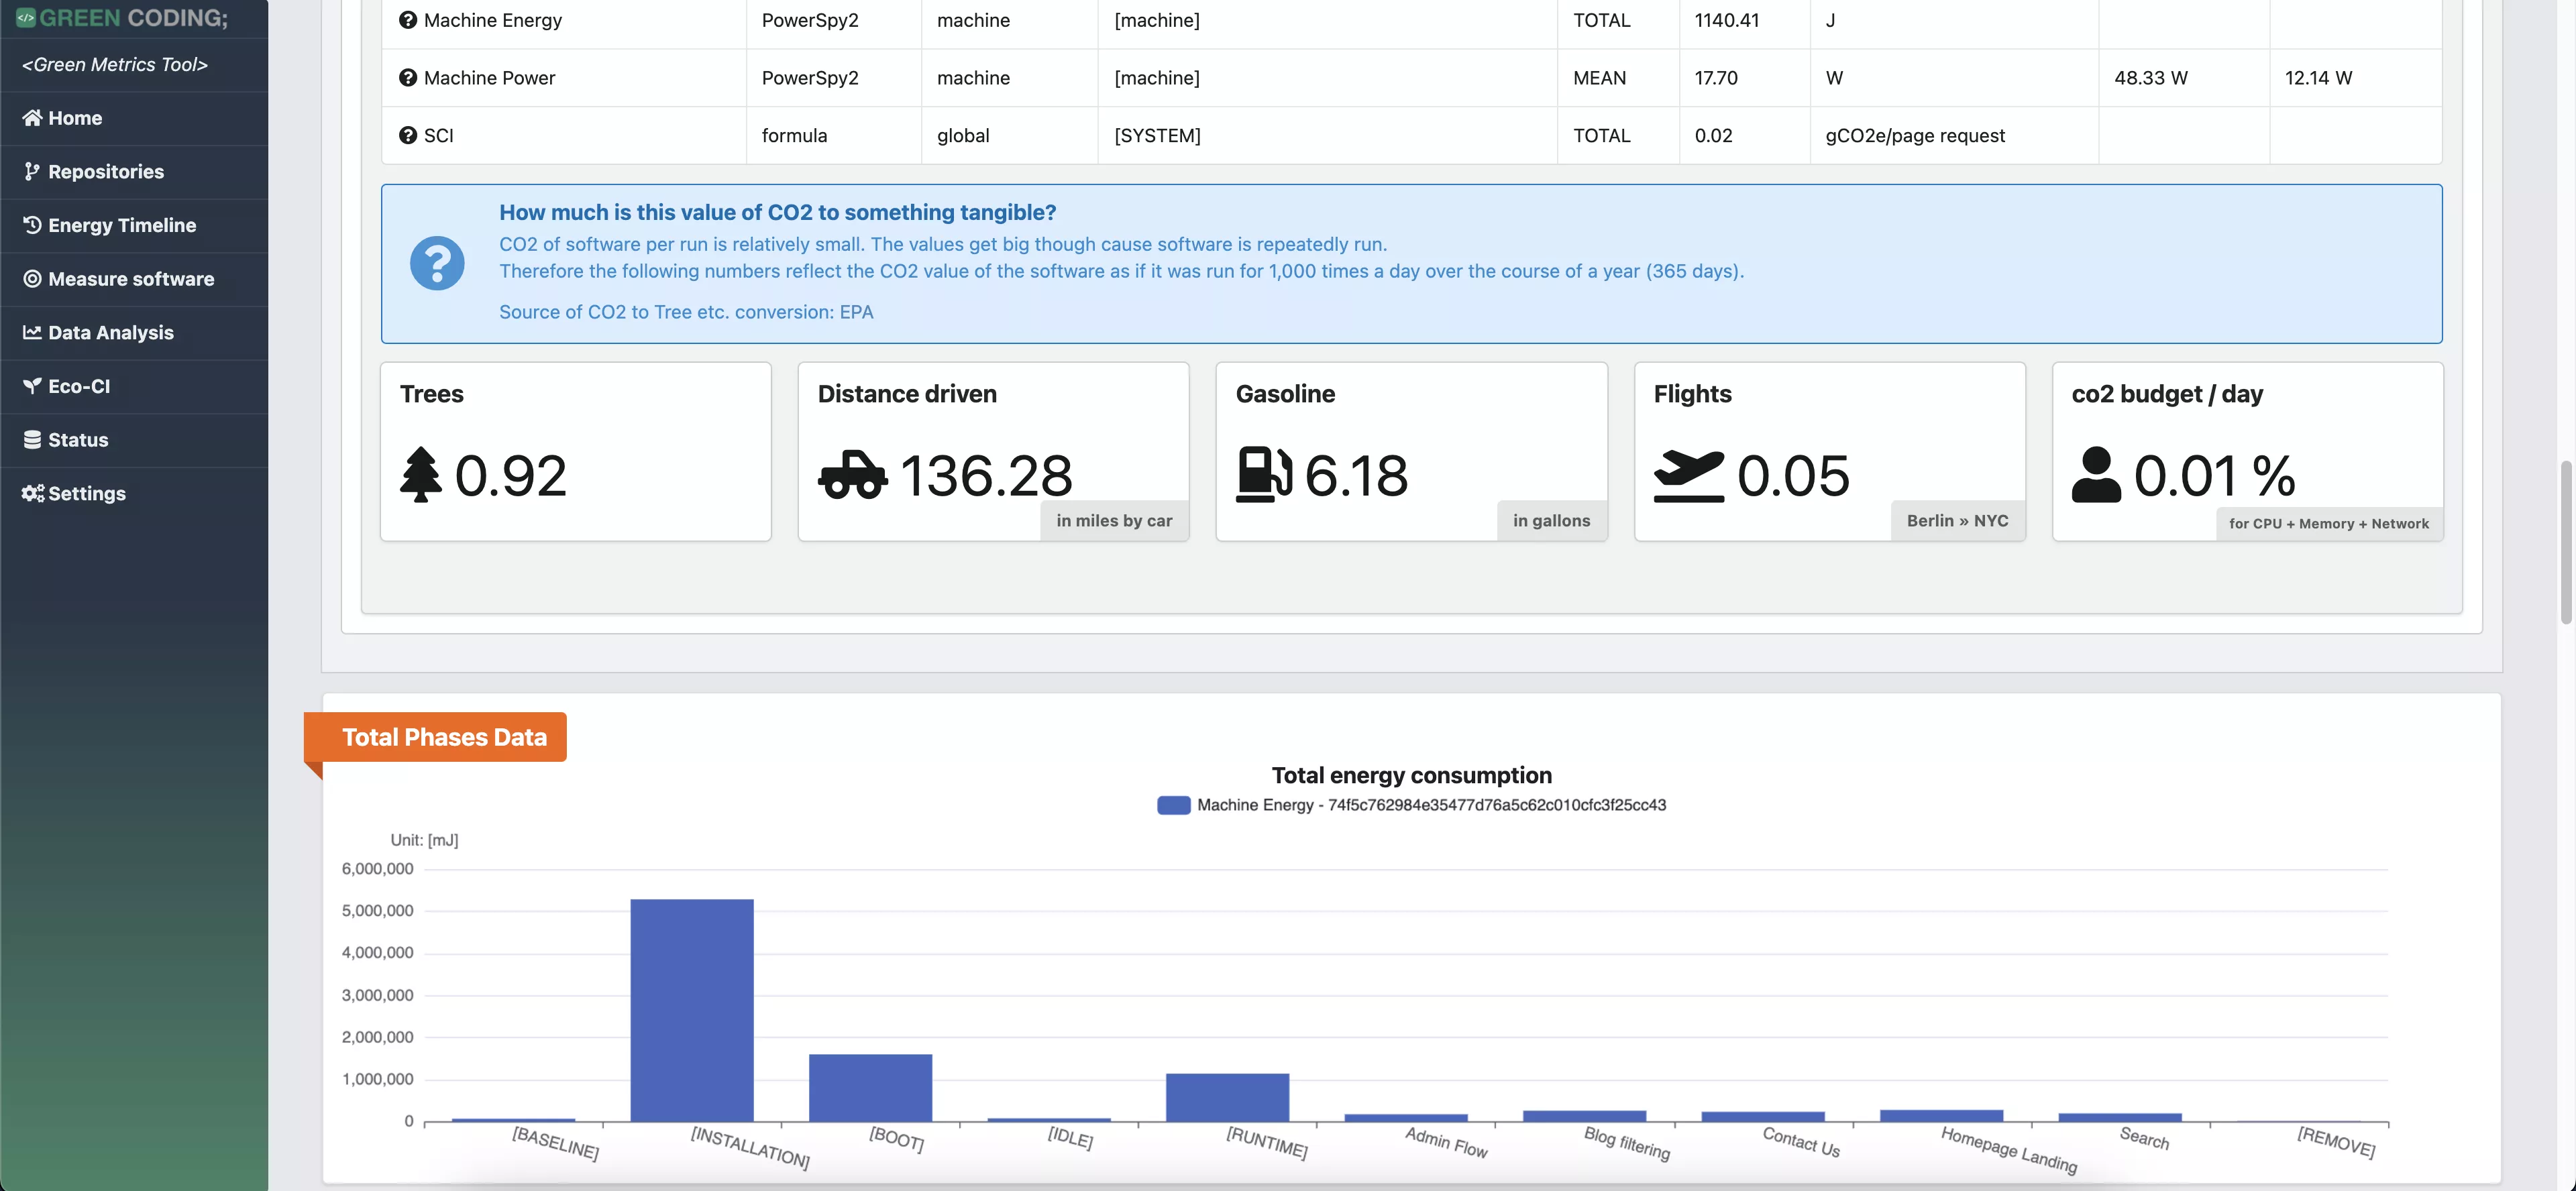
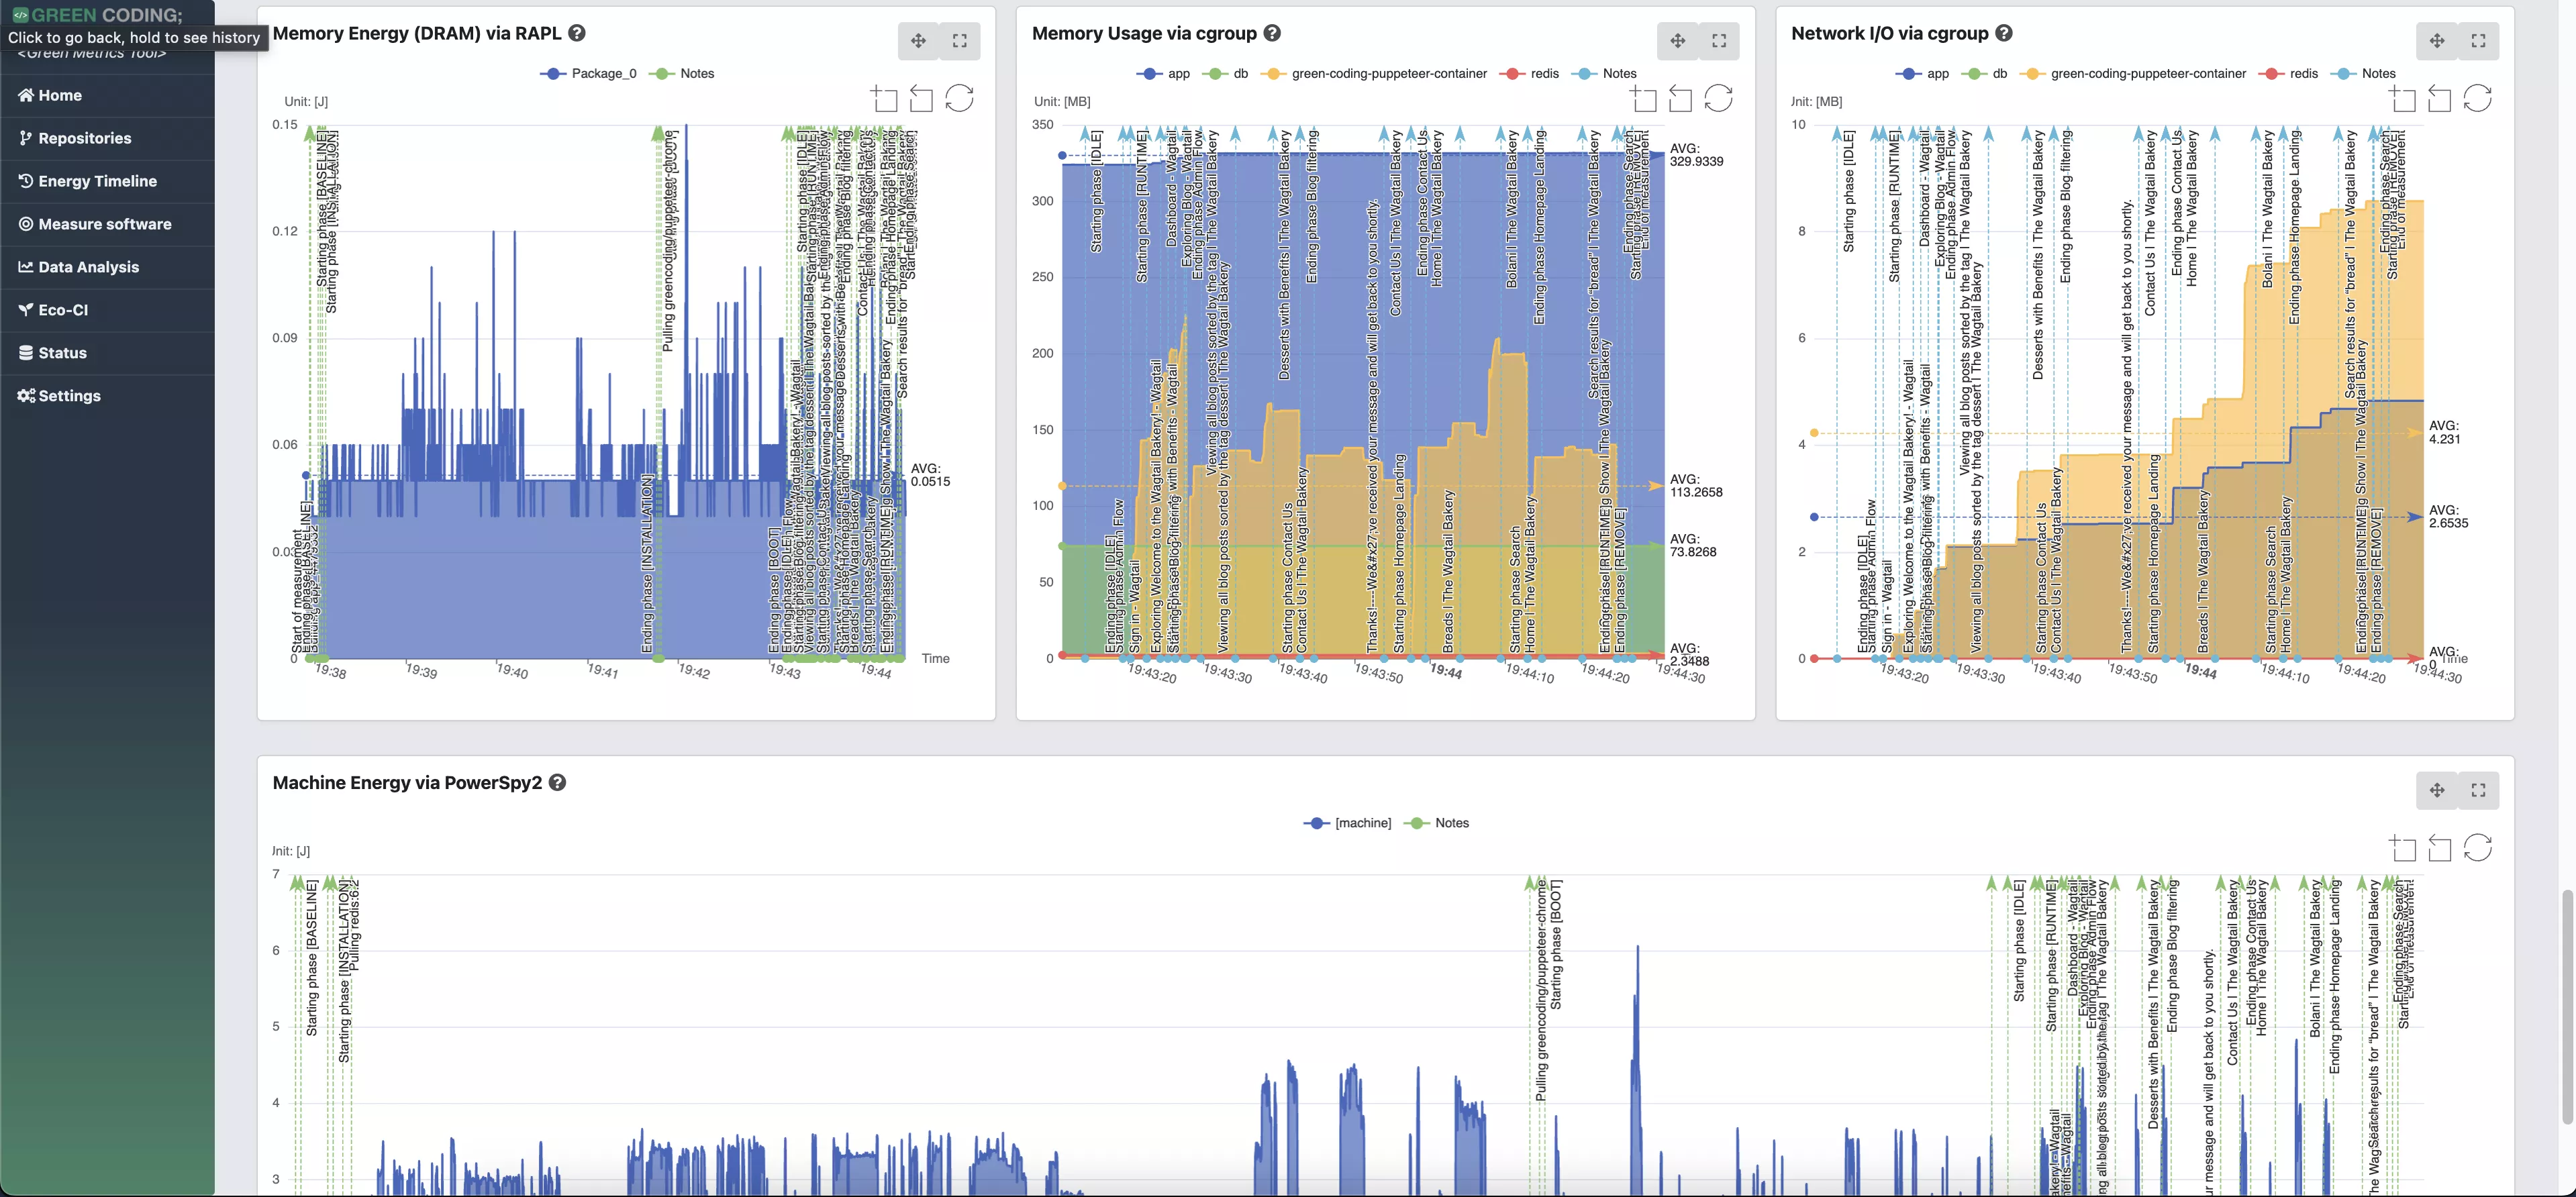
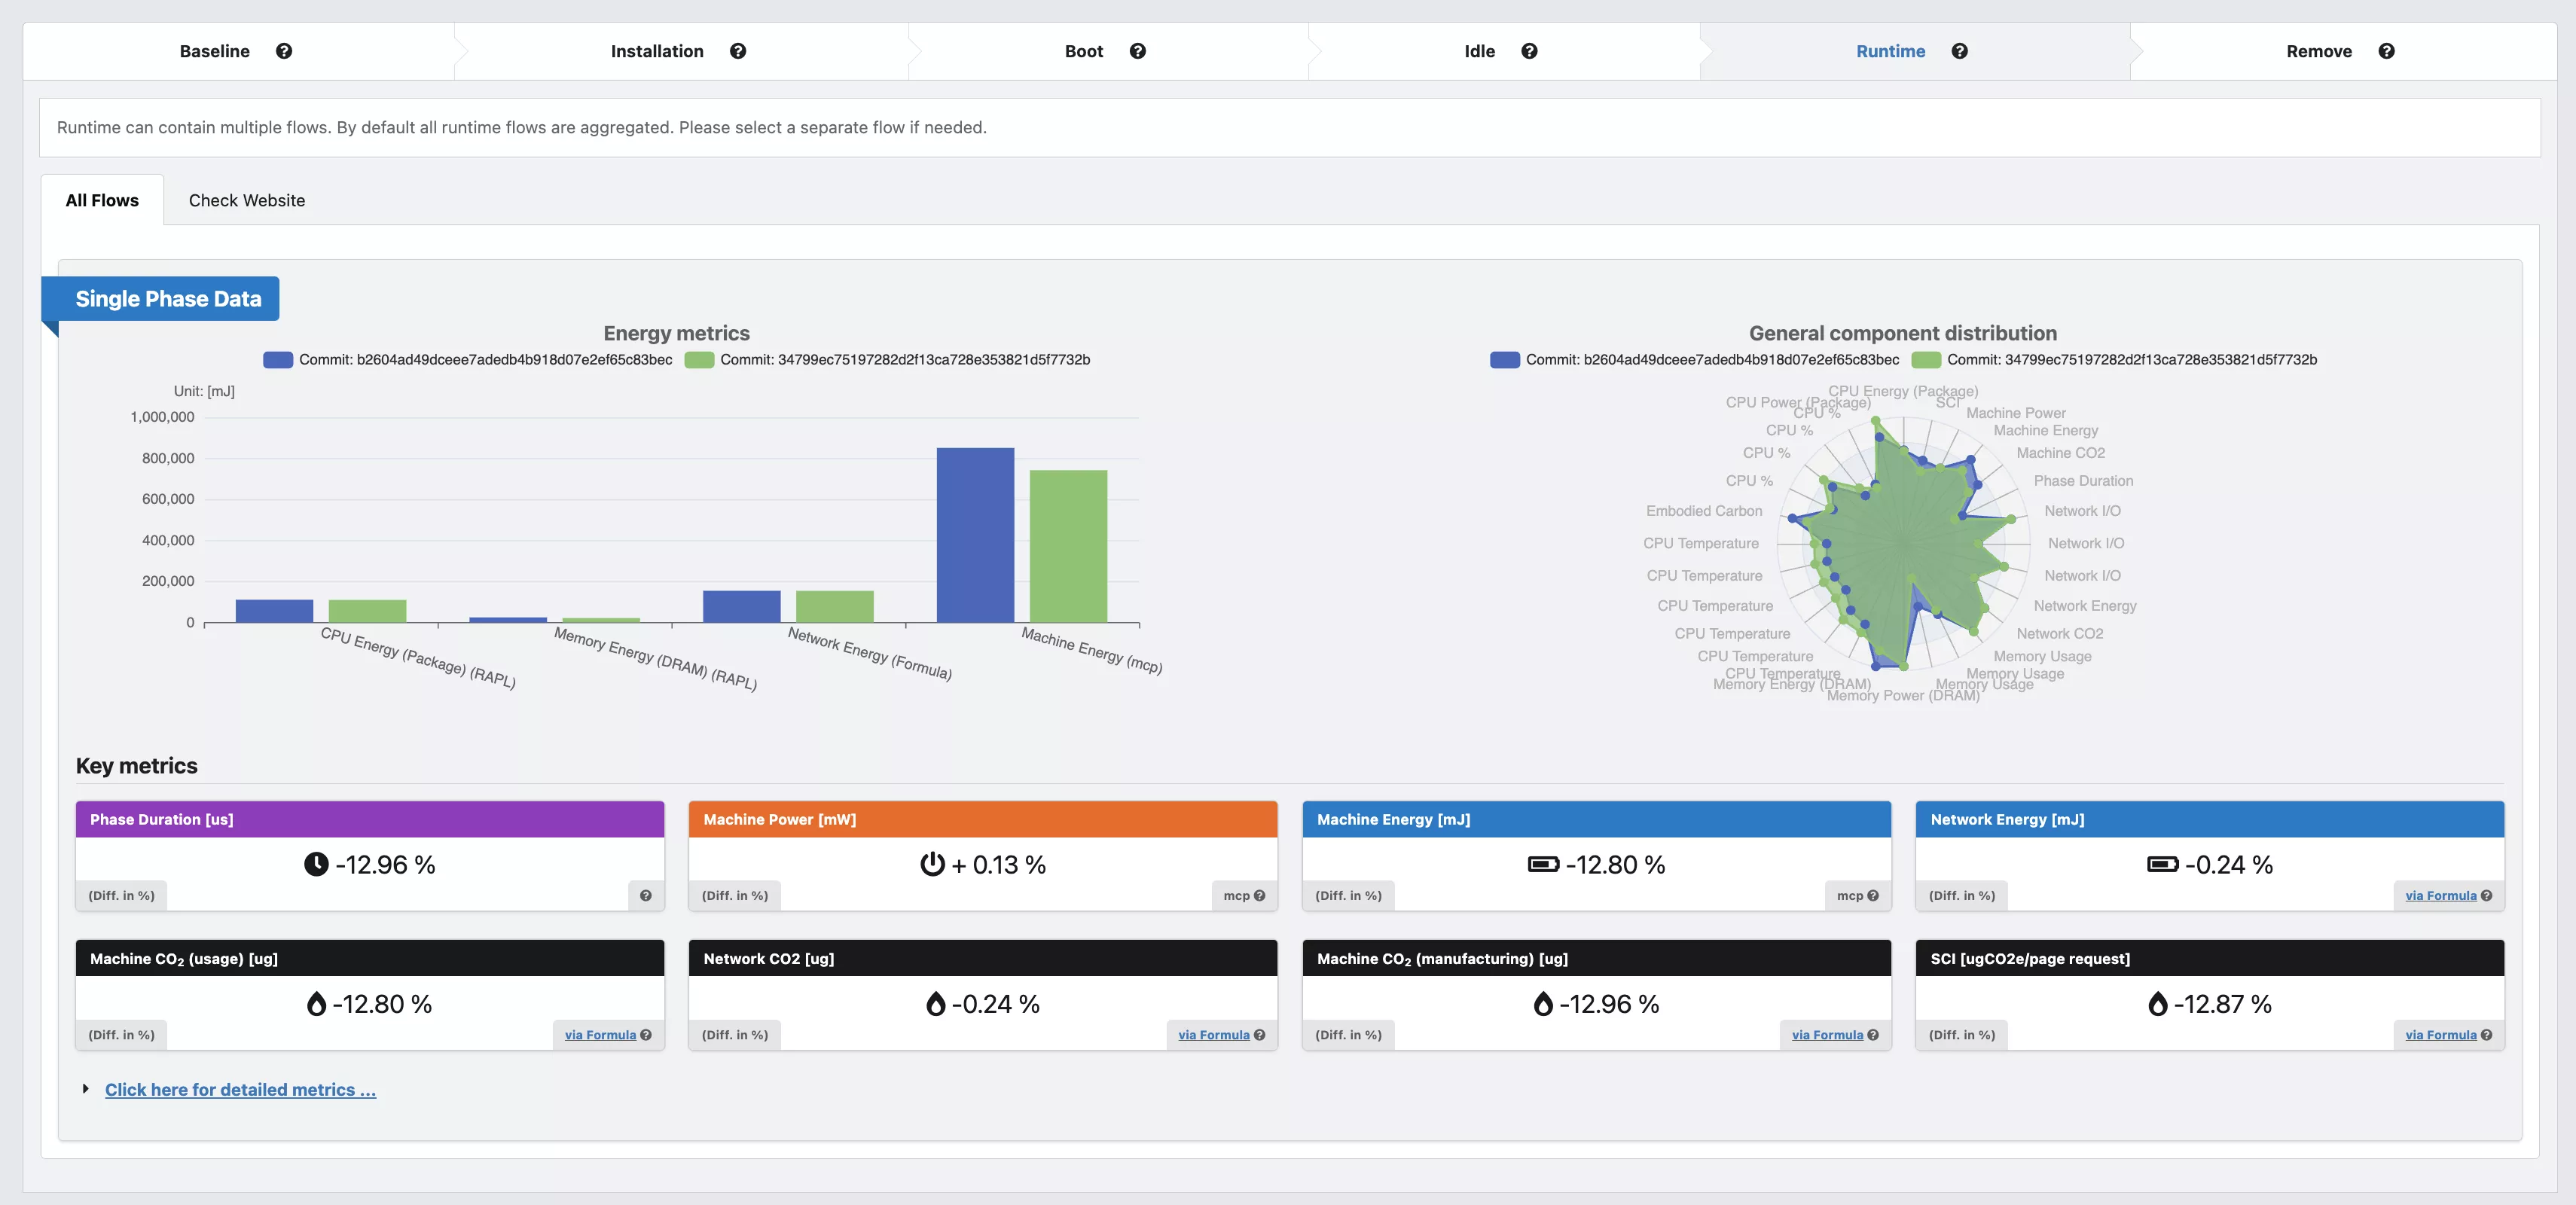
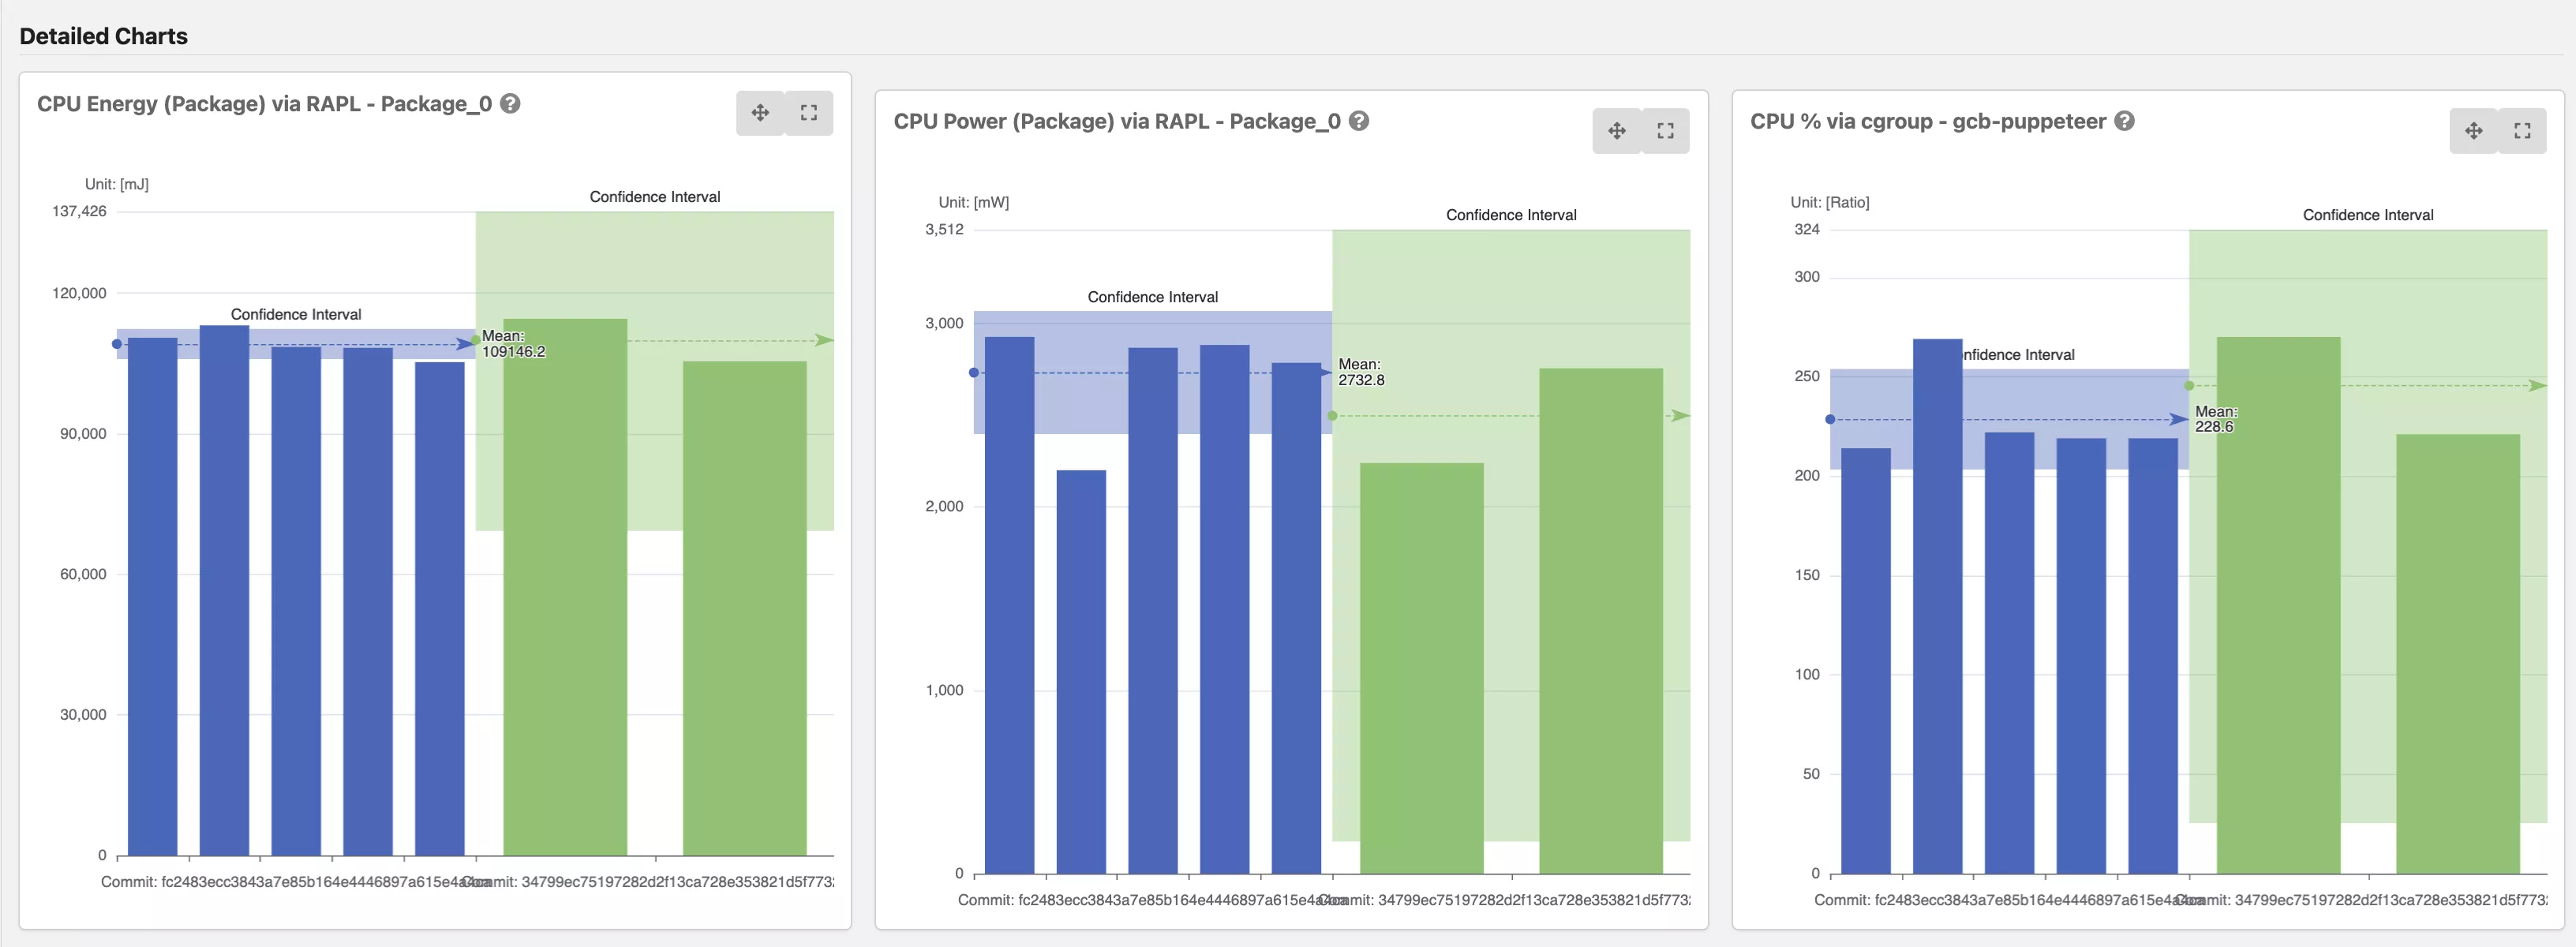
- Statististical frontend with charts - DEMO
- API - DEMO
- Cluster setup
- Free Hosted service for more precise measurements
- Timeline-View: Monitor software projects over time - DEMO for Wagtail / DEMO Overview
- Energy-ID Score-Cards for software (Also see below)
It is designed to re-use existing infrastructure and testing files as much as possible to be easily integrateable into every software repository and create transparency around software energy consumption.
It can orchestrate Docker containers according to a given specificaion in a usage_scenario.yml file.
These containers will be setup on the host system and the testing specification in the usage_scenario.yml will be
run by sending the commands to the containers accordingly.
This repository contains the command line tools to schedule and run the measurement report as well as a web interface to view the measured metrics in some nice charts.
To see the frontend in action and get an idea of what kind of metrics the tool can collect and display go to out Green Metrics Frontend
To see the the documentation and how to install and use the tool please go to Green Metrics Tool Documentation

Details: Energy-ID project page


![dependabot[bot] avatar](https://avatars.githubusercontent.com/in/29110?v=4 "dependabot[bot]")