Coder Social home page Coder Social logo

elm-vegalite's Introduction

elm-vegaLite

elm-vegaLite banner

elm version vega-lite version Contributor Covenant

Declarative visualization for Elm.

This package allows you to create data visualizations in Elm, following the Vega-Lite visualization schema. It generates JSON specifications that may be sent to the Vega-Lite runtime to create the output.

If you wish to create Vega (as opposed to Vega-Lite) output, see the sister package elm-vega.

Example

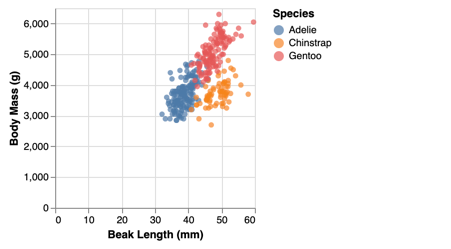
A simple scatterplot encoding penguin morphology with position and species with colour:

let
    path =
        "https://cdn.jsdelivr.net/npm/vega-datasets@2/data/"

    data =
        dataFromUrl (path ++ "penguins.json") []

    enc =
        encoding
            << position X [ pName "Beak Length (mm)", pQuant ]
            << position Y [ pName "Body Mass (g)", pQuant ]
            << color [ mName "Species" ]
in
toVegaLite [ data, enc [], circle [] ]

This generates a JSON specification that when sent to the Vega-Lite runtime produces the following output:

elm-vegaLite scatterplot

Why elm-vegaLite?

A rationale for Elm programmers

There is a demand for good visualization packages with Elm. There are certainly data visualization packages available, ranging from low level SVG rendering through focussed charting packages (e.g. line-charts) to a more comprehensive visualization library. The designs of each reflects a trade-off between concise expression, generalisability and comprehensive functionality.

Despite the availability of these packages, there is a space for a higher level data visualization package (avoiding, for example the need for explicit construction of chart axes) but one that offers the expressivity to create a wide range data visualization types and styles. In particular, no existing libraries offer easy interaction and view composition (building 'dashboards' comprising many chart types). elm-vegaLite is designed to fill that gap.

Characteristics of elm-vegaLite.

  • Built upon the widely used Vega-Lite specification that has an academic robustness and momentum behind its development. Vega-Lite is itself built upon the hugely influential Grammar of Graphics.

  • High-level declarative specification with best-practice defaults (a chart can be fully specified in as few as five lines of code).

  • Strict typing and friendly error messages means "the compiler is your friend" when building and debugging complex visualizations.

  • Flexible interaction for selecting, filtering and zooming built-in to the specification.

  • Hierarchical view composition allows complex visualization dashboards to be built from trees of simpler views.

A rationale for data visualizers

Vega-Lite hits the sweet spot of abstraction between lower-level specifications such as D3 and higher level visualization software such as Tableau. By using JSON to fully encode a visualization specification, Vega-Lite is portable across a range of platforms and sits well within the JavaScript / Web ecosystem. Yet JSON is really an interchange format rather than one suited directly for visualization design and construction.

By wrapping Vega-Lite within the Elm language, we can avoid working with JSON directly and instead take advantage of a typed functional programming environment for improved error support and customisation. This greatly improves reusability of code (for example, it is easy to create custom chart types such as box-and-whisker plots that can be used with a range of datasets) and integration with larger programming projects.

Elm and elm-vegaLite have been used successfully with hundreds of students to teach Data Visualization combining the beginner-friendly design of Elm with the robust and theoretically underpinned design of a grammar of graphics. It integrates well with literate visualization to encourage good and reproducible practice in visualization design.

Further Reading

elm-vegalite's People

Contributors

domoritz avatar dougburke avatar jwolondon avatar ralfnorthman avatar

Stargazers

 avatar  avatar  avatar  avatar  avatar  avatar  avatar  avatar  avatar  avatar  avatar  avatar  avatar  avatar  avatar  avatar  avatar  avatar  avatar  avatar  avatar  avatar  avatar  avatar  avatar  avatar  avatar  avatar  avatar  avatar  avatar  avatar  avatar  avatar  avatar  avatar  avatar  avatar  avatar  avatar  avatar  avatar  avatar  avatar  avatar  avatar  avatar  avatar  avatar  avatar  avatar  avatar  avatar  avatar  avatar  avatar  avatar  avatar  avatar  avatar  avatar  avatar  avatar  avatar  avatar  avatar  avatar  avatar  avatar  avatar  avatar

Watchers

 avatar  avatar  avatar  avatar  avatar  avatar  avatar  avatar  avatar  avatar

elm-vegalite's Issues

how to: set Init to multiple values, not a scalar

I can't see how to encode

  "selection": {
    "brush": {
      "type": "interval",
      "init": {"x": [55, 160], "y": [13, 37]}
    }
  },

which is from https://vega.github.io/vega-lite/examples/interactive_brush.html

I don't know if init can only sensibly be sent scalar or 2 values, or whether it can support multiple array lengths. This may decide whether a "special case" is needed just for init, or something more complex with DataValue (if so then the case at #7 (comment) may also be relevant).

Or I'm sleep deprived and missing something ;-)

how to handle 'text: [...]' setting?

I was going through the Vega-Lite examples for hvega, and came to https://vega.github.io/vega-lite/examples/concat_layer_voyager_result.html which has this construct (the ability for text to take an array of strings looks to have been added somewhere in v4):

          "mark": {
            "type": "text",
            "align": "right",
            "style": "arrow-label",
            "text": ["Polestar", "More Valuable"]
          },

My current approach in hvega is to add an equivalent to maText but for lists - e.g.

maTexts : List String -> MarkProperty

An alternative was to make maText accept a list rather than a scalar (I'm not sure which is better).

I know you have a version of this visualization in your gallery code, but it looks like it requires a lot more work to get a similar display than supporting lists for text.

I haven't checked to see if any of the other mark properties can now take lists. I guess I should.

label alignment, text direction, multi-line support options, and a different seBindLegend

I noticed a few things looking at the 4.0, 4.1, and 4.2 specs:

  • add an AlignBaseline (or AlignAlphabetic since the JSON output is "alphabetic") - e.g.
    see this example

(I think this has been in Vega-Lite since at least 3.4.0)

  • add a TextDirection type that supports "ltr" and "rtl" (see "dir" field) along with support for the "ellipsis" and "limit" fields for text: https://vega.github.io/vega-lite/docs/text.html

  • '"lineBreak"' and '"lineHeight"' properties for (some) marks, although how linebreak works with your "auto-split on \n" support is an open question. I'd link to a page describing them but they only seem to be in the v4.x schema.

  • for the seBindLegend selection property, I ended up going a slightly different way than you: rather than taking a list of BindLegendProperty I made it take a single BindLegendProperty with the following structure, which simplifies the processing a bit (at least, it makes it clear that you must specify either a FieldName (which is just a synomym for String/Text) or a Channel

data BindLegendProperty
  = BLField FieldName
    -- ^ The data field which should be made interactive in the legend
    --   on a single click.
  | BLChannel Channel
    -- ^ Which channel should be made interactive in a legend
    --   on a single click.
  | BLFieldEvent FieldName T.Text
    -- ^ The data field which should be made interactive in the legend and the
    --   <https://vega.github.io/vega/docs/event-streams Vega event stream>
    --   that should trigger the selection.
  | BLChannelEvent Channel T.Text
    -- ^ Which channel should be made interactive in a legend and the
    --   <https://vega.github.io/vega/docs/event-streams Vega event stream>
    --   that should trigger the selection.

The alternative I came up with was two constructors BLField and BLChannel (for sake of discussion) whose second argument is Maybe Text, but I think I prefer the slightly-more explicit version here.

Changes in next release

I've created a working document listing changes for the next release which will support the new Vega-Lite 4 schema. I will be using this as an opportunity to implement any necessary breaking changes to the API, but would like to keep these to a minimum.

Vega-Lite 4 is still under development, so this is a work in progress and may change to reflect further changes to the Vega-Lite schema.

This should be useful for @DougBurke in keeping the Haskell port hvega up to date.

Feel free to use this issue to comment on or propose any changes prior to the next release.

LegendProperty "symbolLimit" appears to be missing

Having checked the respective source code versions, I believe that the legend property "symbolLimit" was present in Vega-lite v4.8, but is not in elm-vegalite 2.30. This property limits the number of symbols shown in a legend.

Not a big deal, as I can fix manually in the resulting json before publishing, but thought I might as well log this.

Alternative to Data Voyager with elm-vegalite?

Hi, I have a rather open question regarding potential usage of elm-vegalite.

First a note on the vega data voyager project. I find the vega data voyager project (https://github.com/vega/voyager) to be very convenient when exploring data and trying to find potentially good graphs. However, even for quick data exploring, I find some aspects of the vega voyager utility very frustrating. A recurrent frustration for me is the fact the graphs cannot take more visual space, we cannot control the visualization size. Another one is the fact axis ranges cannot be controlled, they are automatically adjusted with the data handled. But when visualizing means of binned content for example, the mean values can be pretty close to 0, while the actually values have a much wider range, resulting in very flattened plots such as this one.

image

So I kinda of have two questions. (1) Is there already another similar open source tool for data exploration like vega data voyager? And (2) How hard do you think it would be to make such a thing with Elm (probably with a mix of elm-ui and elm-vegalite)? That would have many features of data voyager, plus some more control on the plots if needed.

Sorry if this is not the appropriate medium for asking this question, I didn't see a place mentioned in the readme for this kind of questions.

remove SReverse in ScaleProperty?

As far as I can tell, SReverse in ScaleProperty is not generating valid Vega-Lite JSON - it may be Vega instead, but I can't find the string reverse in https://github.com/vega/schema/blob/master/vega-lite/v3.3.0.json

In hvega I have added a MSort constructor to MarkChannel to support reversing things (or use PSort, I should also check the other relevant types to see if they need their own xSort). You can see an example at

DougBurke/hvega@6a1e0ed

which adds MSort and adjusts two of the ColorTests to use MSort rather than SReverse (I haven't - yet? - followed your lead and moved to a function-based rather than constructor-based API).

PPrecision should create a string, not a float, in the JSON output

I am hoping this is an error in the Vega-Lite 3.3.0 specification - see vega/vega-lite#5190 for a discussion - but PPrecision should be generating a string rather than a float.

(I've finally integrated your test suite into hvega, where I generate the JSON for each test and then compare it against the checked-in version to ensure the output hasn't changed; it means I have a bunch of JSON files I can easily validate against the Vega Lite schema, which finds the odd strange case like this)

Conversion from elm/time

I'm missing some functionality for using elm/time with elm-vegalite. This would be nice to have:

posixToDt : Time.Posix -> List DateTime

Some context:

Some calculations I'm more comfortable doing in the type safety of Elm, rather than using vega expression strings, but when doing so there can be some friction when trying to put the results of those calculations back into vegalite.

In my own code I now have this:

posixToDtList : Time.Posix -> List DateTime
posixToDtList p =
    [ dtYear (Time.toYear Time.utc p)
    , dtMonth (Time.toMonth Time.utc p |> monthConversion)
    , dtDate (Time.toDay Time.utc p)
    , dtHour (Time.toHour Time.utc p)
    , dtMinute (Time.toMinute Time.utc p)
    , dtSecond (Time.toSecond Time.utc p)
    , dtMillisecond (Time.toMillis Time.utc p)
    ]

monthConversion : Time.Month -> MonthName
monthConversion month =
    case month of
        Time.Jan ->
            Jan

        Time.Feb ->
            Feb

        Time.Mar ->
            Mar

        Time.Apr ->
            Apr

        Time.May ->
            May

        Time.Jun ->
            Jun

        Time.Jul ->
            Jul

        Time.Aug ->
            Aug

        Time.Sep ->
            Sep

        Time.Oct ->
            Oct

        Time.Nov ->
            Nov

        Time.Dec ->
            Dec

question about how transform is implemented

In adding in support for density and loess I was reminded that I wanted to ask you about how transform is implemented. At present you have

  • routines like density that generate a JSON list of properties, where the ordering depends on the transform type
  • transform takes this and generates the actual Vega Lite JSON object

In looking at this, I don't see why density doesn't just create the Vega Lite JSON object directly. There is one advantage to the current approach, in that transform can skip any input it doesn't know about, but I think that could be added to my approach.

An example, instead of

density field dnProps =
    (::)
        ( "density"
        , toList
            [ JE.string field
            , densityPropertySpec "groupby" dnProps
            , densityPropertySpec "cumulative" dnProps
            , densityPropertySpec "counts" dnProps
            , densityPropertySpec "bandwidth" dnProps
            , densityPropertySpec "extent" dnProps
            , densityPropertySpec "minsteps" dnProps
            , densityPropertySpec "maxsteps" dnProps
            , densityPropertySpec "steps" dnProps
            , densityPropertySpec "as" dnProps
            ]
        )

have density create the object from the following code (but without the need to decode the JSON since we know what options were defined by the user):

                "density" ->
                    case JD.decodeString (JD.list JD.value) (JE.encode 0 val) of
                        Ok [ dn, gbObj, cmObj, cnObj, bwObj, exObj, mnsObj, mxsObj, sObj, asObj ] ->
                            ([ ( "density", dn ) ]
                                ++ (if gbObj == JE.null then
                                        []

                                    else
                                        [ ( "groupby", gbObj ) ]
                                   )
                                ++ (if cnObj == JE.null then
                                        []

                                    else
                                        [ ( "cumulative", cnObj ) ]
                                   )
                                ++ (if cnObj == JE.null then
                                        []

                                    else
                                        [ ( "counts", cnObj ) ]
                                   )
                                ++ (if bwObj == JE.null then
                                        []

                                    else
                                        [ ( "bandwidth", bwObj ) ]
                                   )
                                ++ (if exObj == JE.null then
                                        []

                                    else
                                        [ ( "extent", exObj ) ]
                                   )
                                ++ (if mnsObj == JE.null then
                                        []

                                    else
                                        [ ( "minsteps", mnsObj ) ]
                                   )
                                ++ (if mxsObj == JE.null then
                                        []

                                    else
                                        [ ( "maxSteps", mxsObj ) ]
                                   )
                                ++ (if sObj == JE.null then
                                        []

                                    else
                                        [ ( "steps", sObj ) ]
                                   )
                                ++ (if asObj == JE.null then
                                        []

                                    else
                                        [ ( "as", asObj ) ]
                                   )
                            )
                                |> JE.object

                        _ ->
                            JE.null

Does FacetChannel need more options (e.g. for spacing)?

I was looking at updating my version of https://vega.github.io/vega-lite/examples/bar_grouped.html and found I couldn't handle (in @hvega@)

"encoding": {
    "column": {
      "field": "age", "type": "ordinal", "spacing": 10
    },

because of the spacing field. It looks like the facet types have been changed from 3.4.x

        "column": {
          "$ref": "#/definitions/FacetFieldDef",
          "description": "A field definition for the horizontal facet of trellis plots."
        },

to 4.x (here from 4.2)

        "column": {
          "$ref": "#/definitions/RowColumnEncodingFieldDef",
          "description": "A field definition for the horizontal facet of trellis plots."
        },

where things like "column" are described. So it looks like FacetChannel needs some additions (or I'm mis-reading things again).

`dtMonthNum` should have the signature `Int -> DateTime`

From the source code:

{-| Month of a year.
-}
dtMonth : MonthName -> DateTime
dtMonth =
    DTMonth


{-| Month of a year as a number (1 - 12).
-}
dtMonthNum : MonthName -> DateTime
dtMonthNum mon =
    case mon of
        Jan ->
            DTMonthNum (Num 1)

        Feb ->
            DTMonthNum (Num 2)

Shouldn't dtMonthNum be the following instead?

dtMonthNum : Int -> DateTime
dtMonthNum n =
     DTMonthNum (Num n)

Otherwise I don't see the point of it when we have dtMonth.

should columns just take an Int rather than Maybe Int as Null is not valid in the 3.3.0 schema

At the moment you have columns : Maybe Int -> ( VLProperty, Spec ) where a Nothing maps to a JSON Null value:

https://github.com/gicentre/elm-vegalite/blob/master/src/VegaLite.elm#L5964

The 3.3.0 schema doesn't allow Null here - there are multiple "columns" entries, all accepting a number only, e.g.

https://github.com/vega/schema/blob/master/vega-lite/v3.3.0.json#L6483
https://github.com/vega/schema/blob/master/vega-lite/v3.3.0.json#L11105

Should Nothing map to 0 (e.g. the description of the first case suggests 0 is a sensible value in that case, whether it is true for all uses of columns is a different question)? If so, then is the Maybe type still needed?

Or maybe we could ask the VegaLite folks to update the spec to allow a null here?

should rgExtent / dnExtent accept Float rather than DataValue?

From my 'things I thought about while adding to hvega' list. You have

dnExtent : DataValue -> DataValue -> DensityProperty
rgExtent : DataValue -> DataValue -> DensityProperty

but I think it would be better to have them take Float values, since the Vega Lite schema only supports setting these to numbers (unless I'm mis-reading things).

how to: set ArgMax/ArgMin to a field?

From https://vega.github.io/vega-lite/examples/bar_argmax.html - I tried (very quickly) to replicate this with a separate transform, but couldn't get it to work.

  "encoding": {
    "x": {"aggregate": {"argmax": "US_Gross"}, "field": "Production_Budget", "type": "quantitative"},
    "y": {"field": "Major_Genre", "type": "nominal"}
  }

I looked in the 3.3.0 spec and it looks like both ArgMax and ArgMin should take an optional field name/string:

    "Aggregate": {
      "anyOf": [
        {
          "$ref": "#/definitions/AggregateOp"
        },
        {
          "$ref": "#/definitions/ArgmaxDef"
        },
        {
          "$ref": "#/definitions/ArgminDef"
        }
      ]
    },

where

    "ArgmaxDef": {
      "additionalProperties": false,
      "properties": {
        "argmax": {
          "type": "string"
        }
      },
      "required": [
        "argmax"
      ],
      "type": "object"
    },

and similar for ArgminDef. Presumably something like

opArgMax : Maybe String -> Operation

Do you need 'doSelectionField'/'doSelectionChannel' to go with 'doSelection'?

In hvega I wanted to make a "context and detail" style plot where you could zoom in both the X and Y directions. Since the selection is projected across both channels, I couldn't just use doSelection on both axes (of the detail plot) as this just used the same range from the context plot for both axes. I ended up adding versions of doSelection which took either a field name or an encoding channel - e.g. something like doSelectionField : String -> String -> ScaleDomain and doSelectionChannel : String -> Channel -> ScaleDomain which create JSON objects {"selection": selName, "field": fieldName} or {"selection": selName, "encoding": channel}

Here is a not-very-informative example I used to check it worked (in this case I used my equivalents of both doSelectionField and doSelectionChannel just to check they worked; the VL documentation suggests only one is needed and the other could remain doSelection):

https://vega.github.io/editor/#/url/vega-lite/N4KABGBEAuBOCGA7AzgMwPawLaQFxgG1hJ5k8oBPSAGigGN4AbOgV0fmgFNzI71kAFABMOLLADpoAC07R4ASkgBfALrVwUEXPLFknAI4tOiOt3zFSPabPg0oyObGjkADLUgPOAB1fiAjO4O6D74AGziAEwAHEpK6hCQAG58JhzkBBoQoBA5UFjwsADWPIwAlojc8bn2nIycdNCl6Ig6mdWQAEawLMhSrdXt5aXO5pAAHukukbShapTpALRTUbTLKnFtA5DGfELlAOZk+ATjdpBUapvt0BReZlDlXLCJTJBXEEpXG1s76HuI+36AygE1GqFKtSEVhk2ncNzuPEMSEackaiUqUHgY1KRzAiDYjG+wPOOkg4MhPCocNu90gSMQKI4pXRZyxOPI+MYhK+bSJWSukHyRR4dFKsDodRoAt+-0B5neIKBwKg5MYUPwMBhtiqyo8DEloyE6Hy5VJqvVUGssJqdQaTRaGq6PT6sR1xPhtPpjLR3AVfPaVHlyoS5spUuD9n192IRpNDrAulq9UazR4Tt6ZxlBzDroVCQ9iJYyOGTJZfp5uU+EEuCQAJMg6DJ8jwpNBoF5kLgAPRd9H7eDifbDKQsDriJpdhtN+C9zj9hZlLi9gAs4gAVshUyAlEA

how to: filter with complicated expressions

From #6

*) Table binned Heatmap

This one I can get to work, by manually implementing a "valid" filter, but it is messier than having support in the API. However, this looks like a potentially-invasive change.

The boolean operators expect strings, so we can't combine fiValid with and

  "transform": [{
    "filter": {"and": [
      {"field": "IMDB_Rating", "valid": true},
      {"field": "Rotten_Tomatoes_Rating", "valid": true}
    ]}
  }],

*) Calculate Residuals

The second filter expression here contains a range with a null in it and also a timeUnit expression, and I couldn't work out how to create it.

  "transform": [
    {"filter": "datum.IMDB_Rating != null"},
    {"filter": {"timeUnit": "year", "field": "Release_Date", "range": [null, 2019]}},

How to encode the Trellis Scatter Plot example

Apologies if I'm missing something obvious (I am using hvega rather than your module, so it could well be all my own fault ...), but I can't see how to encode the https://vega.github.io/vega-lite/examples/trellis_scatter.html example (which has changed since I last looked at it). The JSON is

{
  "$schema": "https://vega.github.io/schema/vega-lite/v3.json",
  "data": {"url": "data/movies.json"},
  "mark": "point",
  "columns": 2,
  "encoding": {
    "facet": {"field": "MPAA_Rating","type": "ordinal"},
    "x": {"field": "Worldwide_Gross","type": "quantitative"},
    "y": {"field": "US_DVD_Sales","type": "quantitative"}
  }
}

and the trouble I'm having is creating the facet entry in the encoding object. I can see column and row, but facet and facetFlow don't fit here (since they're not ... -> List LabelledSpec -> List LabelledSpec).

The closest I could find is facet3 in elm-vegalite/test-gallery/src/GalleryFacet.elm, but that follows the "old" version of this plot (which had a column field instead of facet).

lookupAs confusion on my part

Hopefully this is another one of my mis-understanderings™ - and as I'm about to leave for a week of glamping it's not urgent.

I'm trying to encode https://vega.github.io/vega-lite/examples/airport_connections.html which includes the following transforms

      "transform": [
        {"filter": {"selection": "single"}},
        {
          "lookup": "origin",
          "from": {
            "data": {"url": "data/airports.csv"},
            "key": "iata",
            "fields": ["latitude", "longitude"]
          }
        },
        {
          "lookup": "destination",
          "from": {
            "data": {"url": "data/airports.csv"},
            "key": "iata",
            "fields": ["latitude", "longitude"]
          },
          "as": ["lat2", "lon2"]
        }
      ],

The first one maps to lookup, but I can't get the second one to map to lookupAs

Missing symbols

From looking through the vega-lite 3.4.0 and 4.0.0 beta 0 schema, it looks like you are missing several symbol types. From the schema:

        "shape": {
          "description": "Shape of the point marks. Supported values include:\n- plotting shapes: `\"circle\"`, `\"square\"`, `\"cross\"`, `\"diamond\"`, `\"triangle-up\"`, `\"triangle-down\"`, `\"triangle-right\"`, or `\"triangle-left\"`.\n- the line symbol `\"stroke\"`\n- centered directional shapes `\"arrow\"`, `\"wedge\"`, or `\"triangle\"`\n- a custom [SVG path string](https://developer.mozilla.org/en-US/docs/Web/SVG/Tutorial/Paths) (For correct sizing, custom shape paths should be defined within a square bounding box with coordinates ranging from -1 to 1 along both the x and y dimensions.)\n\n__Default value:__ `\"circle\"`",
          "type": "string"
        },

So missing - unless you've added them recently ;-) - are arrow, stroke, triangle, triangle-left, triangle-right, and wedge (although it's not clear how different triangle and triangle-up are to me).

Suggestion for improvement of the API documentation

When I browse the api documentation I often find myself in the following scenario (I use log scaling in this example, but it could be anything):

  • I need logarithmic scaling in a visualization.
  • I search for 'log' in the searchbar.
  • I find scLog and want to use it, but I don't know were to put it in my code.
  • It generates a Scale, so I click that.
  • Here I find functions generating Scale, which can be very useful (e.g. if I came here from clicking Scale in an input position of a function), but not in this case.
  • What I need is a function taking Scale as input, i.e. scType.
  • Lets now pretend scType was listed here: I click it.
  • I see that scType generates a ScaleProperty. Now I'm in familiar territory because I recently used scDomain which also returns ScaleProperty: I now know where to put scLog and scType in my code.

I think it would be neat if the documentation for each type also had a list of the functions having it as an argument.

Granular axis tick label formatting based on timeunit

In pure JSON without elm

When you write the vega-lite specification in json by hand you can give an axis formatting string for each time-unit (see TimeMultiFormat) as in the following example (open in online vega editor):

{
  "$schema": "https://vega.github.io/schema/vega-lite/v5.json",
  "width": 700,
  "data": {
    "sequence": {
      "start": -11000000,
      "stop": 10000000,
      "step": 100000,
      "as": "time"
    }
  },
  "mark": "tick",
  "encoding": {
    "x": {
      "field": "time",
      "type": "temporal",
      "axis": {
        "format": {
          "year": "'%Y",
          "hours": "kl %-H",
          "minutes": "%H:%M"
          }
      },
      "scale": {"type": "utc"}    
    }
  }
}

This yields the following visualization (notice the different tick label formats depending on the granularity context):

time-axis-vegalite

This kind of formatting option is especially useful in visualizations with zoom, e.g. you don't have to write both year and seconds (and everything in between) on every tick label).

In elm-vegalite

I tried to give axFormat the whole json map as a string:

timeExample : Spec
timeExample =
    let
        data_ =
            dataSequenceAs -11000000 10000000 100000 "time"

        myAxis =
            pAxis
                [ axFormatAsTemporal
                , axFormat """{ "year": "`%Y", "hours": "kl %-H", "minutes": "%H:%M" }"""
                ]

        myScale =
            pScale [ scType scUtc ]

        enc =
            encoding
                << position X
                    [ pName "time"
                    , pTemporal
                    , myAxis
                    , myScale
                    ]
    in
    toVegaLite [ width 700, data_, enc [], tick [] ]

But then the map is just used as a regular format string:

vega-lite-time-axis-fail

Proposal

We probably want to leave axFormat as is and introduce some new functions and types like:

axFormatMulti : List TimeUnitFormat -> AxisProperty
tufYear : String -> TimeUnitFormat
tufQuarter : String -> TimeUnitFormat
tufMonth : String -> TimeUnitFormat
tufWeek : String -> TimeUnitFormat
tufDay : String -> TimeUnitFormat
tufDayOfYear : String -> TimeUnitFormat  
tufHours : String -> TimeUnitFormat
tufMinutes : String -> TimeUnitFormat
tufSeconds : String -> TimeUnitFormat
tufMilliseconds : String -> TimeUnitFormat

Then the api could look like this:

 pAxis 
    [ axFormatAsTemporal
    , axFormatMulti
        [ tufYear "`%Y"
        , tufHours "kl %-H"
        , tufMinutes "%H:%M"
        ]
    ]

Notes

I also tried to get a 24-hour clock formatting without AM/PM with just a localization config but that doesn't seem to be possible at the moment: vega/vega#3116

Hyperlink Properties

Hello! I've been trying to follow this example to add hyperlinks to my marks, but I can't find the href encoding. In the example, href is used in a similar way to both color and tooltip, which I can find in the package. Is there another way to do this that I'm missing?

Data ingestion: Apache Arrow

I had trouble getting my project to work after I switched from a csv to an arrow data source. As a sanity check I served the elm-vegalite examples folder. All the regular examples seemed to work just fine, but the one with arrow had the same behavior as in my project: empty visualizations and browser dev tools talking about WARN Data ingestion failed and TypeError: e.Table.from is not a function.

arrow-plots-empty
arrow-error-dev-tools

I was hoping vega-loader-arrow would have a similar example I could test but I just found a link to a deployed observable notebook (that worked).

Is there something wrong on my end (how I serve the files etc) or is this a bigger issue?

EDIT: I just cloned the repo to my local machine and opened the example html-files by clicking on them in the file explorer. Same behaviour.

potentially missing functionality: title, config, and filtering-expressions

Here's a couple of examples from the VegaLite gallery that I couldn't encode (I'm reasonably sure these are missing features, but perhaps I've missed something). I can split this into 3 tickets if you'd prefer.

*) Line Charts Showing Ranks Over Time

I couldn't set title to an object, just a string.

  "title": {
    "text": "World Cup 2018: Group F Rankings",
    "frame": "bounds"
  },

*) Mosaic Chart with Labels

I think ConfigurationProperty is missing a concat option:

  "config": {
    "view": {
      "stroke": ""
    },
    "concat": {"spacing": 10},
    "axis": {
      "domain": false,
      "ticks": false,
      "labels": false,
      "grid": false
    }
  }

*) Table binned Heatmap

This one I can get to work, by manually implementing a "valid" filter, but it is messier than having support in the API. However, this looks like a potentially-invasive change.

The boolean operators expect strings, so we can't combine fiValid with and

  "transform": [{
    "filter": {"and": [
      {"field": "IMDB_Rating", "valid": true},
      {"field": "Rotten_Tomatoes_Rating", "valid": true}
    ]}
  }],

I think key needs more structure than just the field name

This is from me just looking at VegaLite.elm rather than actually running it, so I may be missing something, but when adding key to hvega I found that the output was not valid according to the 4.0.2 schema. It looks like the "key" field takes an object and not a string name - e.g.

https://github.com/vega/schema/blob/master/vega-lite/v4.0.2.json#L2612

and

https://vega.github.io/vega-lite/docs/encoding.html#key

I also haven't ever used the update functionality with Vega-Lite, to change an existing visualization (and am unlikely to do so in the near future), so I really don't know what I'm doing here ;-)

Recommend Projects

  • React photo React

    A declarative, efficient, and flexible JavaScript library for building user interfaces.

  • Vue.js photo Vue.js

    🖖 Vue.js is a progressive, incrementally-adoptable JavaScript framework for building UI on the web.

  • Typescript photo Typescript

    TypeScript is a superset of JavaScript that compiles to clean JavaScript output.

  • TensorFlow photo TensorFlow

    An Open Source Machine Learning Framework for Everyone

  • Django photo Django

    The Web framework for perfectionists with deadlines.

  • D3 photo D3

    Bring data to life with SVG, Canvas and HTML. 📊📈🎉

Recommend Topics

  • javascript

    JavaScript (JS) is a lightweight interpreted programming language with first-class functions.

  • web

    Some thing interesting about web. New door for the world.

  • server

    A server is a program made to process requests and deliver data to clients.

  • Machine learning

    Machine learning is a way of modeling and interpreting data that allows a piece of software to respond intelligently.

  • Game

    Some thing interesting about game, make everyone happy.

Recommend Org

  • Facebook photo Facebook

    We are working to build community through open source technology. NB: members must have two-factor auth.

  • Microsoft photo Microsoft

    Open source projects and samples from Microsoft.

  • Google photo Google

    Google ❤️ Open Source for everyone.

  • D3 photo D3

    Data-Driven Documents codes.